

Abstract
Neural activation increases blood flow locally. This vascular signal is used by functional imaging techniques to infer the location and strength of neural activity1,2. However, the precise spatial scale over which neural and vascular signals are correlated is unknown. Furthermore, the relative role of synaptic and spiking activity in driving hemodynamic signals is controversial3-9. Prior studies recorded local field potentials (LFPs) as a measure of synaptic activity together with spiking activity and low-resolution hemodynamic imaging. Here we used two-photon microscopy to measure sensory-evoked responses of individual blood vessels (dilation, blood velocity) while imaging synaptic and spiking activity in the surrounding tissue using fluorescent glutamate and calcium sensors. In cat primary visual cortex, where neurons are clustered by their preference for stimulus orientation, we discovered new maps for excitatory synaptic activity, which were organized similar to spiking activity but were less selective for stimulus orientation and direction. We generated tuning curves for individual vessel responses for the first time and found that parenchymal vessels in cortical layer 2/3 were orientation selective. Neighboring penetrating arterioles had different orientation preferences. Pial surface arteries in cats, as well as surface arteries and penetrating arterioles in rat visual cortex (where orientation maps do not exist10), responded to visual stimuli but had no orientation selectivity. We integrated synaptic or spiking responses around individual parenchymal vessels in cats and established that the vascular and neural responses had the same orientation preference. However, synaptic and spiking responses were more selective than vascular responses—vessels frequently responded robustly to stimuli that evoked little to no neural activity in the surrounding tissue. Thus, local neural and hemodynamic signals were partly decoupled. Together, these results indicate that intrinsic cortical properties, such as propagation of vascular dilation between neighboring columns, need to be accounted for when decoding hemodynamic signals.
To determine how neural activity leads to changes in cerebral blood flow, the hemodynamic responses of individual vessels need to be compared to neural activity in the surrounding tissue11. While sensory-evoked responses of individual vessels have been measured in the somatosensory cortex and olfactory bulb of rodents, these studies have not measured vessel responses to the full range of stimuli for which the neighboring neural tissue is responsive. Thus the degree to which vascular signals match local neural activity has been difficult to assess. Here we compare neural and vascular responses to a full range of stimulus orientations in cat primary visual cortex to determine if vascular responses can be predicted from local neural activity. Additionally, cat primary visual cortex, similar to primates including humans, is organized into precise maps such that different columns of neural tissue are optimally activated by different stimulus orientations (Fig. 1a). Therefore the orientation selectivity of vessel responses can be linked to the spatial scale of neurovascular coupling. For example, if blood flow in a single cortical vessel is sensitive to neural activity over a large spatial scale covering many orientation columns, then the vessel should dilate to a broad range of stimulus orientations. On the contrary, if the vascular response is controlled very locally, i.e., within the scale of an orientation column, then individual vessels may be highly orientation selective.
Figure 1. Selectivity of blood vessel dilation to sensory stimuli in species with and without cortical orientation maps.

a, Schematic of cat visual cortex showing the columnar organization of neurons by orientation preference and a pial surface artery with multiple branches penetrating the parenchyma. Different colors of neuronal cell bodies represent their different preferred stimulus orientations. b, Time courses and polar plots (averages of six (upper panel) and eight (lower panel) trials) of the changes in dilation of two layer 2/3 arterioles in cat visual cortex to visual stimulation. Error bands represent s.e.m. and gray bars represent the periods of visual stimulation. In this and subsequent figures, stimuli were gratings that drifted in eight different directions of motion and polar plots are normalized to the maximum response. c, Time course and polar plot of responses from a surface artery in cat (average of four trials). d, Population distribution and median orientation selectivity index (OSI) for parenchymal (n = 79 vessels in 18 cats) and surface (n = 24 vessels in 9 cats) vessels. e, Schematic of rat visual cortex where neurons with different orientation preferences are intermingled. f–g, Time courses and polar plots of responses from two parenchymal arterioles (averages of seven (upper panel) and eight (lower panel) trials) and a surface artery (average of five trials) in rat visual cortex. h, Population distribution and median OSI for parenchymal (n = 16 vessels in 6 rats) and surface (n = 21 vessels in 7 rats) vessels.
We first labeled blood vessels in the cat primary visual cortex with fluorescent indicators Texas Red Dextran or Alexa 633 (see Methods and ref.12) and measured the dilation responses to drifting grating stimuli of different orientations. Veins and capillaries, which were distinguished from arteries by a number of means12 (see Methods), were not included in this initial analysis because they rarely exhibit rapid sensory-evoked dilation12-14. Our dataset included all other blood vessels provided that they were sufficiently labeled and imaged in tissue with minimal movements from respiration. All blood vessels in this dataset dilated in response to drifting grating visual stimuli (P < 0.05 ANOVA). Specifically, we found that parenchymal arterioles in layer 2/3 typically dilated more strongly in response to one or two stimulus orientations presented (Fig. 1b), whereas pial surface arteries dilated to all orientations nearly equally (Fig. 1c). For each vessel, we computed the Orientation Selectivity Index (OSI; see Methods) such that when a vessel dilates equally to all stimulus orientations the OSI = 0 and when a vessel responds only to a single orientation the OSI = 1. The OSI was much greater for parenchymal arterioles than for pial surface arteries (OSI parenchymal arteriole mean ± s.e.m. = 0.21 ± 0.01; n = 79 vessels and OSI surface artery mean ± s.e.m. 0.06 ± 0.01; n = 24 vessels; P < 10-10; Mann-Whitney test; Fig. 1d).
To further illustrate the role of an organized map of neocortical neurons in generating tuned parenchymal vessel responses, we also measured dilation changes in rat primary visual cortex. Because cortical neurons in rats are not organized in an orientation map10, each parenchymal vessel is surrounded by neurons displaying a variety of orientation preferences (Fig. 1e). In rats, we found no orientation selectivity in cortical layer 2/3 parenchymal arterioles (Fig. 1f; OSI mean ± s.e.m.= 0.06 ± 0.01; n = 16 vessels) or pial surface arteries (Fig. 1g; OSI mean ± s.e.m. = 0.05 ± 0.01; n = 21 vessels) (Fig. 1h).
To compare the orientation selectivity of cat parenchymal vessels to spiking activity in the surrounding tissue, we performed calcium imaging using OGB-1 AM or GCaMP6s along with vascular imaging from the same sites (see Methods). Figure 2a shows a penetrating arteriole that dilates most strongly to the same stimulus orientation as preferred by the immediately adjacent cortical neurons. However, the vessel also dilated when other stimulus orientations were presented, despite minimal or non-existent responses in the nearby neurons. As a result, the vessel had a substantially broader orientation selectivity index (OSI = 0.20) than the neuronal spiking activity (OSI = 0.82, average across six adjacent neurons labeled in Fig. 2a). Since a penetrating arteriole is likely to be sensitive to neural activity from more than just the immediately adjacent cells, we examined whether spiking activity over a larger region might explain the broad orientation selectivity of the parenchymal vessels. Previous work has shown that occlusion of a single penetrating arteriole in the neocortex leads to tissue death in regions with approximately 400 μm diameter15, suggesting that this is the region of tissue that an individual penetrating arteriole supplies (also see Supplementary Information). Therefore we compared vascular responses to calcium signals integrated over 400-μm-diameter windows around each parenchymal artery (Fig. 2b,c). The orientation preference of these regions of spiking activity matched those of the arteries at their centers (Fig. 2d; R = 0.94; n = 19 pairs; P < 10-8). However, the orientation selectivity of the spiking activity was higher than the corresponding artery in all regions examined (Fig. 2e; P < 10-9, paired t-test). Because the spacing of penetrating arterioles is heterogeneous (see Supplementary Information), we also examined the selectivity of neural responses in a wide range of window sizes around each vessel (100–600 μm diameter). We found that for all window sizes the spiking activity OSI was still at least 60% higher than the vessel dilation OSI (Fig. 2f; P < 10-5 at each window size)
Figure 2. Stimulus selectivity of single vessels and of spiking activity in the surrounding tissue.
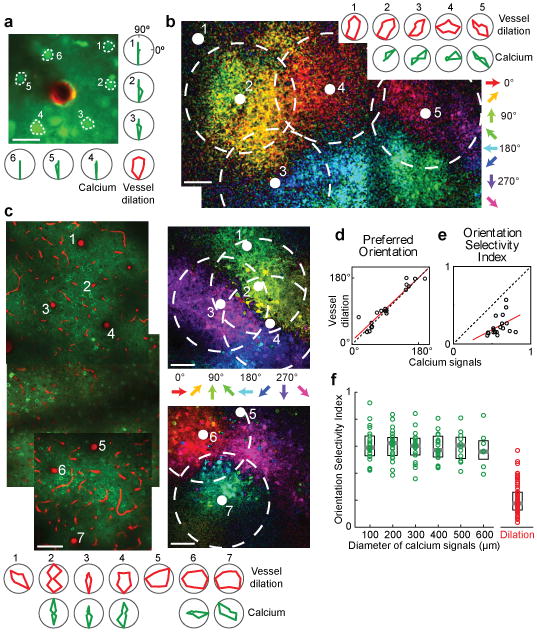
a, In vivo anatomical image of a small region of layer 2/3 cat visual cortex labeled with OGB-1 AM (green) and an arteriole labeled with Alexa 633 (red). Polar plots show the sensory evoked calcium responses from six neurons and the dilation of the arteriole. b, Pixel-based direction map and polar plots of responses from another cat labeled with OGB-1 AM and Alexa 633. The pixels are color coded by their preferred stimulus with the brightness indicating the response strength. Red polar plots show the dilation responses of the five vessels indicated by solid white circles on the direction map. Green polar plots show the calcium responses pooled in 400-μm-diameter windows around four of these vessels (dashed circles). No calcium responses are shown for the region around vessel #1 because this vessel was near the edge of the imaging field. c, Direction map and polar plots of responses from cat visual cortex labeled with GCaMP6s and blood vessels labeled with Texas Red Dextran. Left panel: Tiled in vivo anatomical images of a large region of layer 2/3 where the positions of seven penetrating arterioles are numbered. Right panels: Pixel-based direction maps of neural responses. The polar plots at the bottom show the vessel dilation responses (red) and the calcium responses (pooled over 400-μm-diameter regions) around five of these vessels (green). d, Correlation between the preferred orientation of the vessel dilation and the preferred orientation of calcium responses in 400-μm-diameter windows around each vessel (R = 0.94; P < 10-8; n = 19 windows in 8 cats; regression line shown in red). e, No significant correlation between calcium and vessel OSI (R = 0.41; P = 0.08). f, Distribution of OSI for calcium responses across tissue regions of different window sizes (n = 11 cats) and for the population of dilation responses (n = 18 cats). Solid bars are medians and boxes indicate the inter-quartile range. For all window sizes, calcium responses were more selective than the vessel dilation (P < 0.0001, Mann-Whitney test). Pixel maps shown are averages of five to six trials. Scale bars, 25 μm (a) and 100 μm (b, c).
Our calcium imaging results suggest that additional sources of neural activity (besides spiking in the local tissue around the vessel) may be contributing to sensory-evoked vasodilation. Experimental and theoretical work has implicated synaptic glutamate release as a driver of hemodynamic responses16. In particular, calculation of the energy budget of the neocortex estimated that, of all the cellular processes performed, excitatory synaptic activity has the largest metabolic demand17. Therefore, to directly measure excitatory synaptic activity over different spatial scales and compare it to single-vessel responses, we labeled neurons in the cat visual cortex with a glutamate sensor (iGluSnFR; see Methods). We found that glutamate activity (like neuronal spiking) is organized in direction and orientation maps (Fig. 3 and Extended Data Fig. 1). However, glutamate signals were generally less orientation selective than spiking activity. Integrating over 400-μm-diameter windows, the OSI for calcium (mean ± s.e.m. = 0.59 ± 0.02; n = 19 regions) was sharper than for glutamate (mean ± s.e.m. = 0.44 ± 0.02; n = 37 regions; P < 0.001; Mann-Whitney test). To determine if excitatory synaptic activity alone could account for single-vessel hemodynamic responses we integrated the glutamate signals over 400 μm diameter regions around individual arteries (Fig. 3a,b) and compared these to vessel responses from the same sites (Fig. 3b–e). We found that the visual stimulus that produced the largest glutamate signal in a 400-μm window matched the visual stimulus that resulted in the largest vessel dilation (Fig. 3c; R = 0.90; n = 37 pairs; P < 10-13). However, a 400 μm region of synaptic activity was always more selective than its corresponding penetrating arteriole (Fig. 3d; P < 10-11, paired t-test). The mismatch between orientation selectivity in individual blood vessels and synaptic activity was confirmed for a range of glutamate response window sizes (100–600 μm diameter; Fig. 3e; P < 10-5 at each window size).
Figure 3. Stimulus selectivity of single vessels and of excitatory synaptic activity in the surrounding tissue.
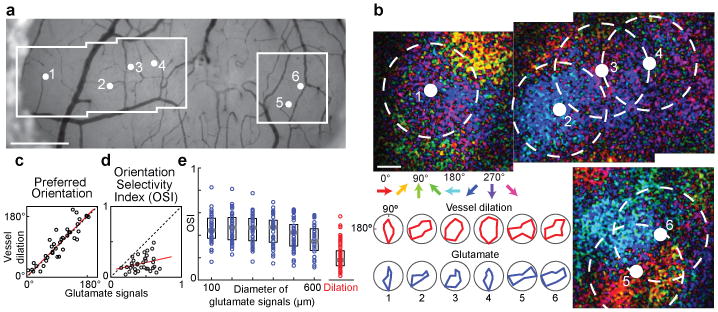
a, Bright field image of the surface of cat visual cortex showing the location of six penetrating arterioles and the regions targeted for two-photon imaging. b, Direction maps and polar plots of glutamate responses from cortical neurons labeled with iGluSnFR and dilation from blood vessels labeled with Texas Red Dextran. The positions of the arterioles and the 400-μm-diameter windows of pooled glutamate responses in cortical layer 2/3 are indicated by solid white and dashed circles, respectively. Red polar plots show the dilation responses and blue plots show the pooled glutamate activity in the windows around each arteriole. c, Correlation between the preferred orientation of the dilation responses and the preferred orientation of glutamate activity in 400-μm-diameter windows around each vessel for all cat data (R = 0.90; P < 10-13; n = 37 windows in 5 cats). d, No significant correlation between glutamate and vessel OSI (R = 0.28; P = 0.08; linear regression line shown in red). e, Distribution of OSI for glutamate activity across windows of different sizes (n = 5 cats) and for the population of dilation responses (n = 18 cats). Solid bars are medians and boxes indicate the inter-quartile range. For all window sizes, the glutamate responses were more selective than vessel dilation (P < 10-5, Mann-Whitney test). Pixel maps shown are averages of eight to ten trials. Scale bars, 500 μm (a) and 100 μm (b).
The broader tuning of the vascular response relative to synaptic and spiking activity (Figs. 2–3) suggests that vessels can respond to sensory stimuli that evoke little to no concomitant neural activity in the surrounding tissue. This phenomenon can be directly observed by comparing the response amplitudes of vessel dilation and neural activity to individual stimulus conditions. Extended Data Fig. 2a,b shows an example in which two visual stimuli (135° and 180°) evoked robust dilations in a penetrating arteriole but essentially no glutamate release in the region around the blood vessel. Across the datasets of synaptic and spiking activity, we compared the amplitude of each vessel's response to each sensory stimulus against the neural response around the vessel to the same stimulus (Extended Data Fig. 2c). Our analysis confirmed that there are many instances where there is a non-existent (or very small) synaptic or spiking response to a visual stimulus despite a robust dilation response. In general, there are very few instances where a stimulus failed to evoke a dilation response of some magnitude.
Like orientation tuning, direction selectivity is a hallmark feature of the primary visual cortex and represents the capacity of a neuron to respond preferentially to one direction of stimulus motion at the optimal stimulus orientation. We found direction maps for excitatory synaptic activity (Fig. 3) that were qualitatively similar to direction maps of spiking activity (Fig. 2). However, the directionality index10 (DI) over 400-μm-diameter windows was greater for spiking activity than for synaptic responses (DI spiking mean ± s.e.m. = 0.59 ± 0.07; n = 19 regions; DI synaptic mean ± s.e.m. = 0.33 ± 0.03; n = 37 regions; P < 0.01; Extended Data Fig. 3a). Blood vessel responses appeared to have little direction selectivity, even when surrounded by iso-direction territories of spiking activity, e.g., Fig. 2b vessels 2 and 4. Indeed, across the population, the direction selectivity of vessels was smaller than regions of spiking activity (DI vessel mean ± s.e.m. = 0.30 ± 0.02; n = 79 vessels; P < 0.0005). The population mean DI of vessels and synaptic activity were similar (Extended Data Fig. 3a; P = 0.70) although there was no correlation between the direction selectivity of a particular vessel and the glutamate signals in the surrounding tissue (Extended Data Fig. 3b; R = 0.20; n = 37 pairs; P = 0.23).
While vessel dilation responses over the population of parenchymal arterioles did not match neural orientation selectivity, we tested the possibility that the smallest vessels would show similar selectivity to neural responses. Larger penetrating arterioles (with baseline diameter > 15 μm) may perfuse larger regions of tissue than small penetrating arterioles and their finer branches. Therefore, these smaller vessels (typically 8–15 μm baseline diameter) may be sensitive to vasodilators from smaller regions of neural tissue and thus have sharper orientation tuning. Indeed we found that OSI was inversely correlated with baseline vessel diameter in cat layer 2/3 (Extended Data Fig. 4a; R = 0.37; P < 0.001). We compared the dilation responses of these small vessels (baseline diameter ≤ 15 μm, mean = 11.8 μm) to those with baseline diameter > 15 μm (based on consistency of Alexa 633 labeling12; see Methods). We found that the small vessels were slightly more tuned (OSI mean ± s.e.m. = 0.24 ± 0.02; n = 35) than the larger ones (OSI mean ± s.e.m. = 0.18 ± 0.01; n = 44; P < 0.05; Extended Data Fig. 4a,b). Importantly however, the OSI of these small vessels was still lower than synaptic and spiking activity over the full range of window sizes (P < 0.005, see Extended Data Fig. 4b,c).
Capillaries are the smallest vessels in the neocortex and therefore may be even more tuned for stimulus orientation than small arterioles. However, whether capillaries have the capacity to dilate in vivo to sensory stimuli is controversial13,14,18,19. This is likely due to inconsistent criteria for defining capillaries and distinguishing them from pre-capillary arterioles as well as to the difficulty of detecting dilation in very small vessels even with two-photon microscopy resolution13,14,18,19. However, a small dilation in a capillary that is undetectable with two-photon microscopy would still lead to easily detectable changes in red blood cell (RBC) velocity. Because RBC size is slightly larger than the capillary lumen diameter, a very small dilation in a capillary could produce a dramatic reduction in the resistance to flow (see Fig. 2e in Ref [20]). Therefore, we measured the stimulus-evoked changes in RBC velocity in a set of micro-vessels that would likely be classified as capillaries based on their high tortuosity and small diameter (4–7 μm; see Methods and Ref. 21,22). We found that the orientation selectivity based on blood velocity in these capillaries (OSI mean ± s.e.m. = 0.30 ± 0.04; n = 15 vessels) was no different from what was found for dilation of the ≤ 15-μm-diameter vessels (P = 0.16; Extended Data Fig. 4a,b). To determine if the tuning of capillaries was due to these vessels being in unusually broadly tuned windows of neural activity, we compared the OSI of neural activity around capillaries with what was found around parenchymal arterioles. The OSI of 400-μm-diameter windows of spiking activity around capillaries (mean ± s.e.m. = 0.60 ± 0.03; n = 13) and around arterioles (mean ± s.e.m. = 0.59 ± 0.02; n = 19) were indistinguishable (P = 0.94; Mann-Whitney test). Thus, stimulus-evoked changes even in capillaries were still not as selective as the responses in adjacent neural tissue.
Our results suggest that blood flow increases in parenchymal vessels are partially driven by local neural activity (which would generate the match in orientation preference) and also by an additional global component arising from adjacent functional columns (which would induce the dilation to non-preferred orientations). One possibility is that this global component is due to the propagation of dilatory signals along vessel walls. Specifically, the lack of orientation tuning in surface arteries could result from the dilation of penetrating arterioles from many different orientation domains propagating back to a surface artery. Then the propagation of dilation along the surface artery and down into multiple penetrating arterioles could broaden the locally driven dilation signal, leading to dilation in adjacent regions of tissue that have no concomitant neural activity. Previous studies in rodents have demonstrated the propagation of dilation from the parenchyma up to the cortical surface23 and along the surface over distances of at least 1 mm24-26 at rapid speeds25, but these have not been linked to the stimulus selectivity of vessel or neural responses. Consistent with this propagation of dilation hypothesis, we found that in cat visual cortex parenchymal vessels dilate before the surface vessels and that the dilation to the preferred orientation came before the dilation to the stimulus that was oriented orthogonal to the preferred orientation, i.e., at the null orientation (see Supplementary Information and Extended Data Fig. 5). Alternative hypotheses on the origin of the selectivity of vessel dilation are discussed in Supplementary Information.
In conclusion, our results have a number of implications for the interpretation of hemodynamic signals in relation to neural activity. We provide direct single-vessel evidence for the untuned global signal in the pial vasculature that has been found in low-resolution hemodynamic imaging studies27,28. After subtracting the global signal, these earlier studies often suggested that the residual tuned vascular responses were of capillary origin27,28. Here we show that individual penetrating arteries also display stimulus-specific responses. Furthermore, the orientation selectivity of these parenchymal vessels is an order of magnitude higher than what is obtained with intrinsic signal optical imaging29. We also demonstrate that an organized functional map of neural responses is required for attaining tuned hemodynamic signals (also see Ref.30). Furthermore, by sampling responses over the full range of a stimulus parameter and by directly measuring synaptic and spiking activity along with single-vessel responses in precisely defined spatial regions of tissue, we overcome many of the technical limitations of earlier studies that examined neurovascular coupling. The difficulties inherent in correlating low-resolution vascular signals with electrophysiological metrics of neural activity and in interpreting glutamate pharmacology has led to controversy regarding the spatial scale over which synaptic versus spiking activity matches vascular signals (see Supplementary Information). Here we establish that the sensory stimulus that elicits the largest synaptic or spiking response also produces the largest hemodynamic signal. However, the complete selectivity profile of neither synaptic nor spiking activity in the local tissue around a vessel can be inferred from the tuning curves of hemodynamic signals. Thus, vascular signals are partially decoupled with local neural signals, over distances of at least 300 μm.
Online Methods
Animals and surgery
All surgical and experimental procedures were approved by the Institutional Animal Care and Use Committee at Medical University of South Carolina. Cats (n = 25 of either sex; postnatal day 28 to > 2.5 kg adult) were anesthetized with isoflurane (1–2% during surgery, 0.5–1.0% during imaging) and paralyzed with a continuous infusion of vecuronium bromide (0.2 mg kg-1 hr-1, intravenously). Cats were artificially ventilated through a tracheal cannula, and the end tidal CO2 was regulated at 3.5–4.5%. Heart rate, respiration rate, temperature and electroencephalogram were also monitored. Long Evans rats (n = 10 males, postnatal days 31–45) and C57Bl/6J mice (n = 1 male, postnatal day 63) were initially anaesthetized with a bolus infusion of fentanyl citrate (0.04–0.06 mg kg-1), midazolam (3.75–6.25 mg kg-1), and dexmedetomidine (0.19–0.31 mg kg-1). The one mouse was used for a control experiment to confirm that the iGluSnFR sensor was not being saturated during sensory stimulation (see Methods below). During two-photon imaging, continuous intraperitoneal infusion with a lower concentration mixture (fentanyl citrate: 0.02–0.03 mg kg-1 h-1, midazolam: 1.50–2.50 mg kg-1 h-1, and dexmedetomidine: 0.10–0.25 mg kg-1 h-1) was administered using a catheter connected to a syringe pump.
For all animals, craniotomies (2–3 mm square) were opened over the primary visual cortex (area 18), the dura was reflected, and the craniotomies were sealed with agarose (1.5–3% dissolved in artificial cerebrospinal fluid ACSF) and a glass coverslip. When the calcium indicator Oregon Green 488 Bapta-1 AM (OGB-1 AM) was used, prior to the placement of the coverglass, a pipette was inserted into the craniotomy and the dye was injected with air pressure puffs. The dye loading procedure has been described in detail31.
In cats, we also used the genetically encoded indicators GCaMP6s32 and iGluSnFR33 to measure calcium and glutamate activity respectively. Two to four weeks prior to the imaging session, viral injections of AAV2/9.hSyn.GCaMP6s.WPRE.SV40 or AAV2/1.hSyn.iGluSnFR.WPRE.SV40 were performed under sterile surgery conditions. Cats were anesthetized with 1–2% isoflurane and vital signs were monitored. One to three craniotomies were performed over the primary visual cortex (area 18) and small holes were made in the dura. Aliquots of virus (5 μL) were diluted in phosphate buffer saline (PBS) and mannitol (5:9:6 ratio of virus:PBS:mannitol) to titers of ∼1012 genomes ml-1 with 50–200 nL of Fast Green dye (Sigma) added to visualize the injection. Glass pipettes containing the virus solution were lowered 500–800 μm into the cortex and pressure puffs were administered over 15–20 minutes until approximately 1 μL had been injected. After 10 minutes, the pipettes were slowly retracted, the craniotomies were sealed with agarose (3% dissolved in ACSF), the scalp was sutured closed and the animals were recovered and returned to their housing. All animals were treated similarly and so randomization and blinding were not required. No statistical methods were used to predetermine sample size.
Two-photon imaging
For vascular imaging, three fluorescent dyes were used as we described previously12. Alexa 633 fluor hydrazide selectively labels artery walls while Texas Red dextran (70 kDa) and fluorescein dextran (2,000 kDa) indiscriminately label the entire vascular lumen. Fluorescein dextran has similar excitation and emission properties as our neuronal labels OGB-1 AM, GCaMP6s, and iGluSnFR. Therefore, fluorescein dextran was not used for vessel dilation measurements in animals where neuronal imaging was performed because sufficient contrast between a vessel wall and background is more difficult to obtain when two green labels are used simultaneously. Fluorescein dextran was typically used for the measurement of RBC velocity and was only injected after the neural imaging was completed.
Fluorescence was monitored with a custom-built microscope (Prairie Technologies) coupled with a Mai Tai (Newport Spectra-Physics) mode-locked Ti:sapphire laser (810 nm or 920 nm) with DeepSee dispersion compensation. Excitation light was focused by a 40× (NA 0.8, Olympus), 20× (NA 1.0, Olympus) or 16× (NA 0.8, Nikon) water immersion objective and beam expansion optics. Full frame imaging of neural activity and vessel dilation were typically obtained at approximately 0.8 Hz. All the blood velocity data and the dilation of a small number of vessels were measured with line scans rather than full frame imaging by using line acquisition rates between 0.4 and 4.2 kHz.
Visual stimulation and size of imaged region
Drifting square-wave grating stimuli were presented on a 17-inch LCD monitor. The gratings were presented at 100% contrast, 30 cd m-2 mean luminance, 1.5–2.0 Hz temporal frequency. As depicted in the various time courses, e.g., Fig. 1, these stimuli were presented at eight directions of motion in 45° steps and each of these eight stimuli was interspersed with blank periods (equiluminant gray screen). Because vascular responses decay slowly, we used long blank periods (at least 4 times the stimulus duration) when measuring blood vessel responses. We also presented the eight visual stimuli in pseudo-random order. These steps ensured that a particular response would not be influenced by a residual response to the previous stimulus. The duration of the stimulation period, e.g., 6 s, and the duration of the blank period, e.g., 24 s, was always identical across all epochs in a stimulus sequence. Each of the eight stimuli was repeated at least three times and in the vast majority of the data, 5–10 trials were used. Unlike arteriole dilation, neural transients return to baseline nearly immediately upon extinguishing the visual stimulus12,34 (also see Extended Data Figs. 1 and 2). Therefore, for epochs of data collection involving only calcium or glutamate imaging, either sequential or pseudo-random sequences were used. While some neural and vascular data were collected simultaneously, our analyses benefited from collecting them sequentially for the following reasons. Neural data was typically collected in 600 × 600 μm square regions to allow the pooling of large regions of activity (see Figs. 2b,c and 3b) and multiple 600 × 600 μm square regions were often imaged in a single craniotomy to obtain maps where many orientation and direction domains were represented (see Figs. 2b,c, 3b and Extended Data Fig. 1). Higher pixel resolution was needed for resolving blood vessel dilation so we usually obtained the vessel responses immediately after the neural responses using higher optical zooms that were centered on the blood vessels of interest. Because of the optical zoom customization per imaged site and the differences in recovery of neural vs. vascular responses to baseline, the selected duration of visual stimulation for a particular experiment ranged from 2–8 s and the duration of blank periods ranged from 6–35 s.
Data-analysis overview
Images were analyzed in Matlab (Mathworks) and ImageJ (National Institutes of Health). Data with significant movements (several μm) in XY or Z were excluded. Data with small drift movements were realigned by maximizing the correlation between frames.
Quantifying vessel dilation
We analyzed dilation responses only in surface arteries and penetrating arterioles because veins and capillaries do not typically dilate to sensory stimuli less than 10 seconds in duration12-14. When veins dilate in response to very long duration sensory stimuli, these responses are relatively weak and extremely slow unlike the rapid and large responses of arteries and arterioles13. Surface arteries and penetrating arterioles are distinguished from veins using Alexa-633 as an artery specific dye, by their orange vs. purplish hue under bright-field illumination, and by the tone of the vessel walls and the speed and direction of blood flow during two-photon imaging12. Distinguishing capillaries from pre-capillary arterioles has been inconsistent in the literature13,14,18,19. Here we categorize capillaries as vessels with 4-7 μm baseline diameter21, high tortuosity and complete lack of Alexa-633 labeling12. Vessel diameter was determined in full-frame images by one of two methods. When the vessel had a circular profile (as was the case for most of the parenchymal arterioles), a region of interest was manually drawn around each vessel and a circle was fit to the pixels in the region that passed a luminance threshold (Extended Data Fig. 6). For vessels with an elongated profile (typical for pial surface vessels), a cross-section was taken through the vessel walls and the peaks in luminance (for the wall-labeling Alexa 633) or peaks in the pixel-by-pixel luminance difference along the line (for lumen labels) were used to compute the diameter12 (see Extended Data Fig. 7). For the few instances where diameter was measured using line-scans, we averaged the data along the time axis over all the lines in an image (usually 1000 lines) or obtained two data points per image by sequentially averaging half the lines in each image. Since each line was only 0.25–2.5 ms in duration, averaging across these lines still provided sufficient temporal resolution for capturing the onset, peak and recovery of sensory-evoked dilation. The diameter was computed from these line scans in the same way as for the cross-section (Extended Data Fig. 8). For all methods of dilation measurement, images were usually oversampled by interpolating between pixels from 2-20 times to allow the algorithm to compute diameter values with a spatial resolution that was finer than the pixel size in the raw data images. To compute the vascular response to each condition, a stimulus response window was defined. Because of the slow onset and offset of the vascular response, we could not simply assign the response period to correspond to the period when the stimulus was displayed on the monitor. Instead, for each vessel we selected the response period by examining the average response across all stimulus conditions and then selected the imaging frames that best approximated this response interval. Shifting this time window by adding or removing data points did not appreciably change the responses. The mean response across this time window was divided by the baseline level for each condition to get the percent-change in diameter. Responsive vessels were defined by ANOVA across baseline and 8 directions over multiple trials (P < 0.05). The Orientation Selectivity Index (OSI) was defined as: OSI = abs(Σrkeˆ(i2θk)/Σrk), where θk is the orientation of each stimulus and rk is the mean response across trials to that stimulus35. Note that OSI = 1 – circular variance. The preferred orientation was defined as: arctan(Σrkcos(2θk)/Σrksin(2θk)). The Directionality Index (DI) was computed as 1 – rnull/rpref, where rpref is the response amplitude to the preferred stimulus and rnull is the response to the stimulus with the same orientation drifting in the opposite direction. Computing the OSI based on flow rather than diameter by scaling the diameter values to the 4th power (Poiseuille's law) did not affect our results.
Measuring onset latency to dilation
To compare the latencies of pial arteries and parenchymal arterioles, we fit a linear regression line to the rising phase of the dilation (20-80% of the peak response) of each vessel. For parenchymal vessels, we used only the response to the preferred orientation because of potential latency differences between dilation to the preferred and other stimulus orientations (see below). For the pial vessels, we pooled the response to all stimulus conditions because these vessels are untuned to stimulus orientation. We used the time at which the regression line crossed the pre-stimulus baseline level as the onset latency12. This regression line metric on the average response is applicable when responses are large and relatively stable from trial to trial—as is the case for pial vessels to any stimulus orientation and for parenchymal vessels to the preferred stimulus orientation.
Since parenchymal vessels are orientation selective (Fig. 1b,d), responses to the null orientation are the weakest and, by definition, smallest in amplitude and more noisy from trial to trial. Thus, to compare the latency between the response to the preferred and null orientations in parenchymal vessels, we used a statistical test, the standardized mean difference (SMD, specifically Hedge's g36,37), in which vessels are weighted by the trial-by-trial variance in latency values (see Extended Data Fig. 5a). We first smoothed each trial's time course with a 3 frame running average. We then performed linear regression on the same interval as above (20-80% of the peak). We took the difference in the average onset latency across trials between the responses to preferred and null stimuli and standardized this difference by the pooled variability across the two conditions. The population summary SMD was obtained by using a random-effect model. This model weighs each vessel by the inverse variance of its SMD and factors in the heterogeneity present across the individual vessel data37. As a control for spurious effects, the preferred and null responses were assigned randomly for each trial and the analysis was repeated (Extended Data Fig. 5b).
Quantifying blood velocity
Velocity data was analyzed as described previously22. Briefly, line scans were first pooled into blocks of 250, 500, or 1000 lines. The angle of the RBC streaks in each image was used to determine the velocity of that block and a time course of velocity measurements was extracted. Baseline and stimulus windows were defined similarly to the dilation data and equivalent OSI and statistical analyses were performed.
Analysis of calcium and glutamate responses
Calcium and glutamate signals were analyzed the same way. Raw images were first smoothed with a 4 μm Gaussian filter. The mean fluorescence of each pixel within a given 100–600 μm-diameter window around a vessel was computed for each blank and stimulus epoch. A t-test was performed on the difference in stimulus and baseline fluorescence for each condition in each trial and if the distribution was significantly higher than zero (P < 0.05), the pixel was included in the integration window. We also performed this analysis without excluding the unresponsive pixels and the responses were indistinguishable. In some datasets, part of the 100–600 μm diameter analysis window fell outside of the image boundary and so there would be fewer pixels from those domains contributing to the overall response. Therefore, to avoid biasing the overall response of the integrated region, we divided the 100–600 μm diameter analysis window into wedges before averaging the data over the full window. Each wedge was 1/16 of the circle and was further divided into sections of 50 μm radial length. Thus, a 100-μm-diameter window had 16 sections whereas a 400-μm-diameter window had 64. The pixels with significant responses within each section were averaged together to create a time course. The time course was then normalized by a sliding baseline of the mean fluorescence of each blank interval (ΔF/F). Each time course was then weighted by the total number of pixels represented by its section, because sections farther from the vessel contain more pixels. Finally, the time courses of all the sections were averaged together to obtain the time course of the entire region. For inclusion in the population dataset, responses from the 100–600 μm diameter analysis windows had to pass the following criteria. First, each wedge had to have at least 30% of the imaged pixels passing the initial t-test to ensure that windows with wedges having no response and/or weak labeling would be removed. Secondly, at least 80% of the circular area of the window had to be within the image to ensure that a sizeable region of tissue whose orientation preference could dramatically affect the overall response was not being missed. In addition, at least 10% of each wedge had to be within the image to ensure that each wedge had some representation. For data that passed all these criteria, the responses to each condition were computed by averaging the imaging frames during stimulus presentation and across trials. Before the OSI was computed, if any conditions showed a negative response (below the baseline level), then the absolute value of the minimum response was added to all responses (to make the minimum equal zero). We have recently published a mechanistic rationale for applying such a correction in fluorescence imaging of neural responses—stimulus-evoked dilation of surface arteries can block fluorescence from the underlying tissue and make a very small response actually appear negative12. We also analyzed the data without this correction and in addition, when only including the first one-second of the response (to avoid the slower surface artery interference12). Although there were small changes in the OSI values of individual windows, the overall results did not change in either case. The neural response amplitudes, OSI and DI were all computed using the same formulae as for the vessel data. Population distribution statistics on OSI and DI measurements used the Mann-Whitney test.
Additional control for calcium imaging
Spiking activity in the neuropil should also contribute to metabolic needs and hence neurovascular coupling. Therefore, when integrating the calcium signals in the tissue surrounding each artery, we included all pixels that passed a signal-to-noise criterion (see previous section) and not only those corresponding to cell bodies. However, the neuropil may include a mixture of calcium signals from synaptic events in dendritic spines and spiking in axons arriving from regions outside of the integration window we selected. Therefore, as a control, we compared the orientation selectivity in 400-μm-diameter windows with and without including the neuropil. Masks excluding the neuropil were generated in the same way as described above except that the pixels within each wedge were constrained to the cell bodies. Cell body masks were first created using an automated algorithm that applied a series of morphological filters to identify the contours of cell bodies based on intensity, size and shape10. Cell outlines were visually inspected and errors were corrected manually. Then a t-test was performed on each pixel of these masks and the wedges were created in the same manner as before. Because of the sparse distribution of cell bodies, we did not enforce the 30% significantly responding imaged pixels criterion but all other criteria applied. The orientation selectivity with the two mask types was indistinguishable (Extended Data Fig. 9).
Control to show that visual stimulation was not saturating the iGluSnFR sensor
With visual stimulation, the glutamate signals peaked at < 10% ΔF/F. To determine if the iGluSnFR sensor responded linearly and responded over a greater range than that obtained with visual stimulation, we used iontophoresis to apply large doses of exogenous glutamate. We lowered a pipette containing 0.5 M glutamate into layer 2/3 of the visual cortex of a mouse that was labelled with iGluSnFR. We applied a range of currents (10, 20, 40, 60, 80 nA) and found that the fluorescence signals increased linearly (R > 0.99; P < 0.0001) and peaked at ∼ 60% ΔF/F (data not shown). Thus, our in vivo imaging with iGluSnFR (e.g., Extended Data Fig. 10) is likely revealing the true spatial profile of glutamate direction maps (Fig 3) and orientation maps (Extended Data Figure 1).
Extended Data
Extended Data Figure 1. Glutamate release is organized into orientation maps.
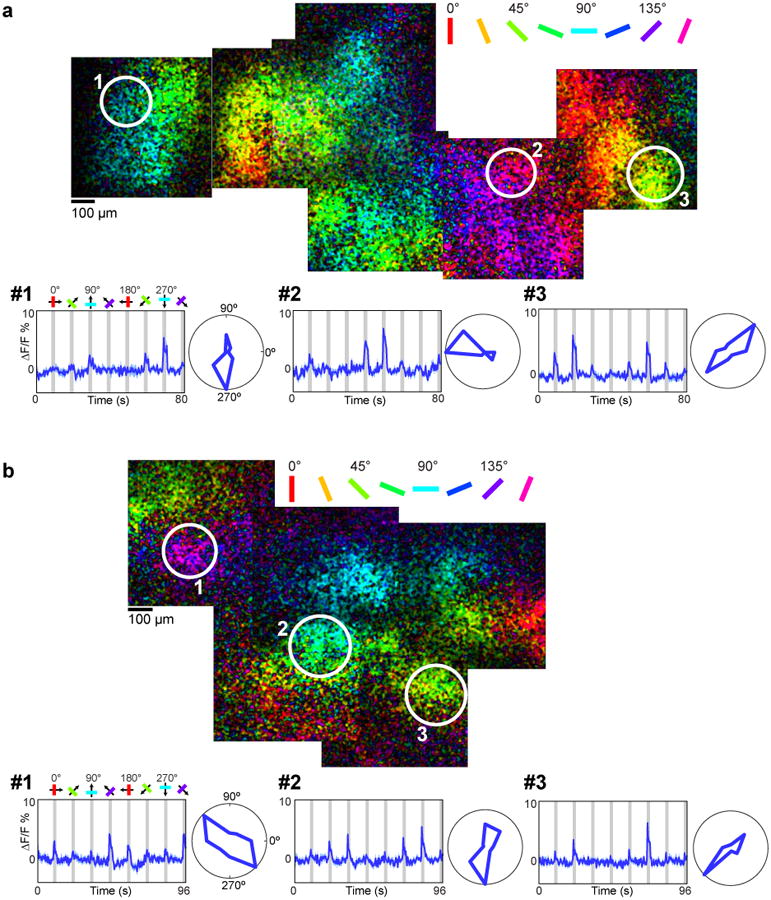
a, Region of cat visual cortex labeled with iGluSnFR. Pixels are color-coded by preferred orientation with the brightness indicating the response strength. Time courses and polar plots (averages of four trials) are shown for three regions of tissue with different orientation preferences. b, Orientation maps of iGluSnFR responses from a different cat. Time courses and polar plots are averages of 10 trials.
Extended Data Figure 2. Arteriole dilation in the absence of glutamate signaling or local spiking.

a, Time courses and polar plots of arteriole dilation (red) and the release of glutamate in a 400-μm-diameter window surrounding an arteriole (blue). Averages of eight trials are shown for vessel dilation and ten trials for glutamate responses. In time courses, error bands represent s.e.m. and gray bars represent the periods of visual stimulation. The responses to the 135° and 180° stimuli (outlined by the black box over the time courses) are large for the vessel dilation but virtually non-existent for the glutamate activity. b. Quantifying the relative amplitude of the vessel and neural responses to each of the eight stimulus directions for the single cat experiment shown in panel a. Each data point in the scatterplot represents the average response of the vessel and of the neural tissue surrounding it to a single direction of visual stimulation, normalized by the response to the best direction. c, Quantifying the relative amplitude of vessel and neural responses across all cat experiments. Top panel shows glutamate vs. dilation data (n = 37 windows and vessels in 5 cats) and the bottom panel shows calcium vs. dilation responses (n = 19 windows and vessels in 8 cats). Each data point in the scatterplot as described in b. The histograms at the top and right show the distributions of neural and dilation responses, respectively. In both population scatterplots, there are many data points in the upper left quadrant, indicating stimuli that drove robust dilation responses but minimal glutamate or calcium responses. All data are from cat visual cortex layer 2/3.
Extended Data Figure 3. Direction selectivity of parenchymal vessels and of local spiking and synaptic activity.

a, Population distributions of the direction index of calcium (green, n = 19 windows in 8 cats), glutamate (blue, n = 37 windows in 5 cats) and vessel dilation (red, n = 79 vessels in 18 cats) responses. All data were obtained from cat visual cortex and neural responses were pooled over 400-μm-diameter windows. The directionality index (DI) of spiking activity was greater than the DI of synaptic responses (P < 0.01; Mann-Whitney test) and the DI of vessel dilation (P < 0.0005; Mann-Whitney test). The DI of synaptic activity was not different from the DI of vessel dilation (P = 0.70; Mann-Whitney test). Solid bars are medians and boxes show the inter-quartile range. b, For each vessel that had a corresponding 400-μm-diameter window of calcium or glutamate activity, the vessel direction index is plotted against the corresponding neural direction index. There was no significant correlation for calcium (R = 0.2; P = 0.43; n = 19 pairs) or glutamate (R = 0.2; P = 0.23; n = 37 pairs).
Extended Data Figure 4. Dilation and velocity responses in parenchymal blood vessels with different baseline diameters.

a, The diameter of all vessels and their OSI values from cat visual cortex layer 2/3. For arterioles, OSI was determined based on dilation (n = 79 vessels in 18 cats) whereas for capillaries, OSI was calculated from blood velocity measurements (n = 15 vessels in 7 cats). b, The distribution of OSI for the three sub-groups of layer 2/3 vessels analyzed in our study (> 15 μm, n = 44 vessels in 15 cats; ≤15 μm, n = 35 vessels in 14 cats; capillaries, n = 15 vessels in 7 cats). The OSI of the ≤15 μm vessels was greater than the OSI of the > 15 μm vessels (P < 0.05; Mann-Whitney test). The OSI of the ≤15 μm vessels was not different from the OSI of the capillaries (P = 0.16; Mann-Whitney test). Solid bars are medians and boxes indicate the inter-quartile range. c, The OSI distribution of dilating vessels and 400-μm-diameter windows of calcium and glutamate responses.
Extended Data Figure 5. Onset latency of dilation in parenchymal vessels.

a, Vessel-by-vessel comparison of the onset latency difference between the response to preferred and orthogonal (null) stimulus orientations. Each whisker diagram represents a single vessel with the circle position indicating the standardized mean difference (SMD – calculated as Hedge's g) in latency. The whisker length represents the 95% confidence interval (CI) of the SMD. The size of the circle represents the weight given to the vessel when calculating the population summary SMD. The population summary SMD is shown by the solid square with the error bands giving the 95% CI. The population average shows that parenchymal vessels responded significantly faster for the preferred than the null stimulus orientation. b, As a control, the analysis shown in a was repeated after randomizing the assignment of preferred and null on individual trials for each vessel. All data are from cat visual cortex layer 2/3 (n = 79 vessels in 18 cats).
Extended Data Figure 6. Dilation measurements with circle fitting.

a, The steps of the circle fitting algorithm are illustrated for a blank and a stimulus frame corresponding to the penetrating arteriole shown in the lower panel of Fig. 1b. The raw image data (first panel) is oversampled by linear interpolation between pixels (second panel). Then a luminance threshold (a fraction of the gradient between the brightest and darkest pixel of the image) is applied (third panel). Finally a 2-D sobel filter is applied to the thresholded pixels to detect the edge of the vessel (fourth panel). The circle fit is only applied to the pixels in the fourth panel but it is overlaid on all the panels for illustration purposes. b, As the threshold is increased, fewer pixels pass the threshold and therefore the baseline diameter changes. However, the percent change in diameter across baseline and stimulus presentations (the response amplitude) and the response selectivity remain the same. Note that for vessel geometries needing an elliptical fit rather than a circular fit (see Extended Data Fig. 8c and Methods), the shorter axis of the fitted ellipse was used to estimate the vessel diameter.
Extended Data Figure 7. Dilation measurements using the cross section algorithm do not depend on the precise location and angle of the selected cross section.
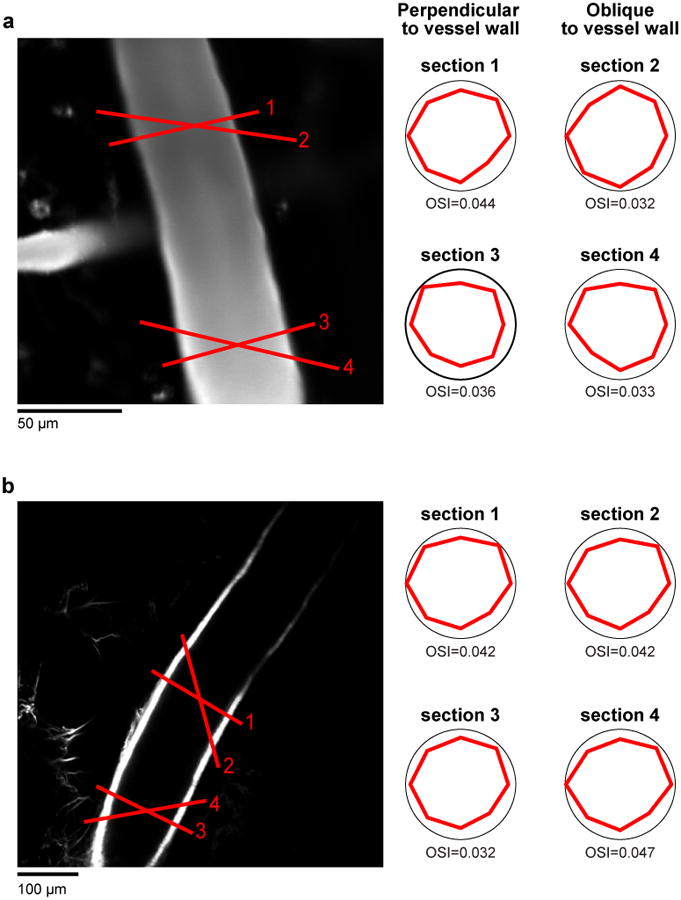
a, Example cat pial artery (from Fig. 1c) labeled with Texas-red dextran. b, Another pial artery from a different cat labelled with the artery specific dye Alexa 633. Both arteries show similar tuning for cross-sections drawn > 100 μm apart and also drawn perpendicular and obliquely relative to the vessel walls.
Extended Data Figure 8. Dilation measurements in small arterioles and comparison of dilation measurement techniques.
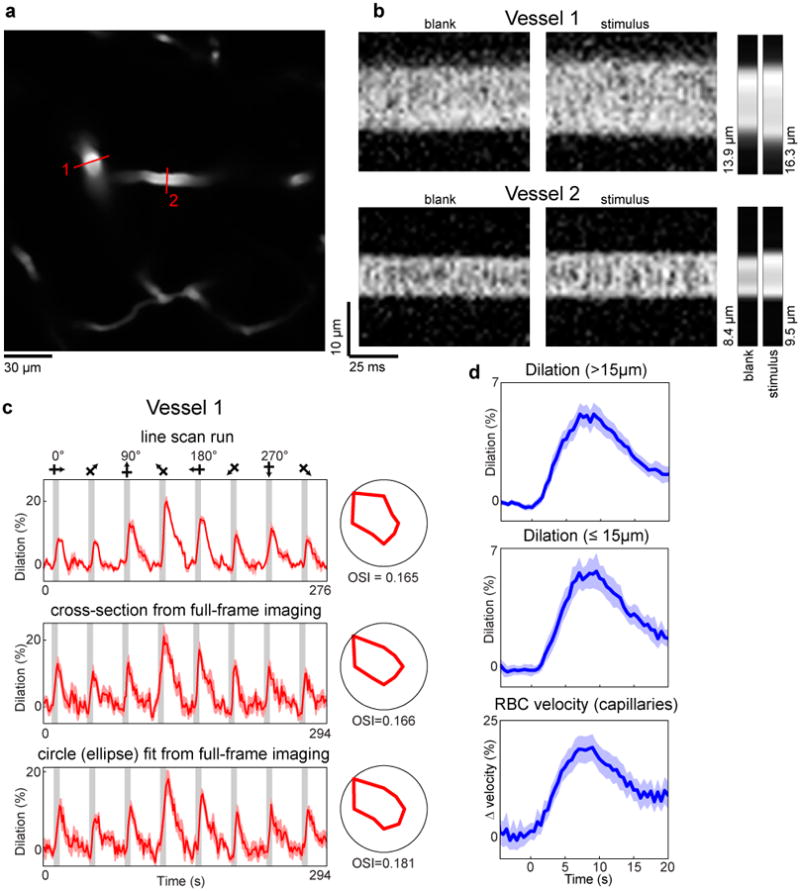
a, A penetrating artery (#1, whose responses are shown in the upper panel of Fig. 1b) and its daughter branch (#2) in cat layer 2/3 labeled with Texas-red dextran. Red lines indicate the position of the laser scan path across the vessels for line-scan diameter measurements. b, Individual line-scans are stacked next to each other to create X-Time (XT) images. The four large rectangular panels are XT images of a blank and stimulus frame for each of two vessels shown in panel a. The small panels to the right are the average across the image (∼ 0.96 seconds) for each of the four frames. The computed diameter values are also shown. These images were oversampled by interpolating between pixels (by 5 times for vessel 1 and by 20 times for vessel 2) before the diameter was calculated. c, The time courses and polar plots of the responses for three different diameter measurements are shown for vessel 1—as a line-scan, a cross-section from a full-frame imaging run (seven trials), and the circle fit from the full-frame imaging run. In this particular example we used an ellipse rather than a circle because of the elongation of the vessel due to its diving obliquely to the imaging plane. d, Time courses of the vessel responses to preferred stimulus orientations for the three groups of vessels shown in Extended Data Fig. 4b. The responses for each vessel were aligned by stimulus onset and binned in 400 ms bins. The population average was then smoothed with a three frame running average. Mean responses in dark colors and light bands indicate s.e.m. Note that the similar error bands and temporal profiles indicate that the smallest vessels had similar quality of responses to the larger ones.
Extended Data Figure 9. Comparison of orientation selectivity in regions of calcium responses with and without neuropil.
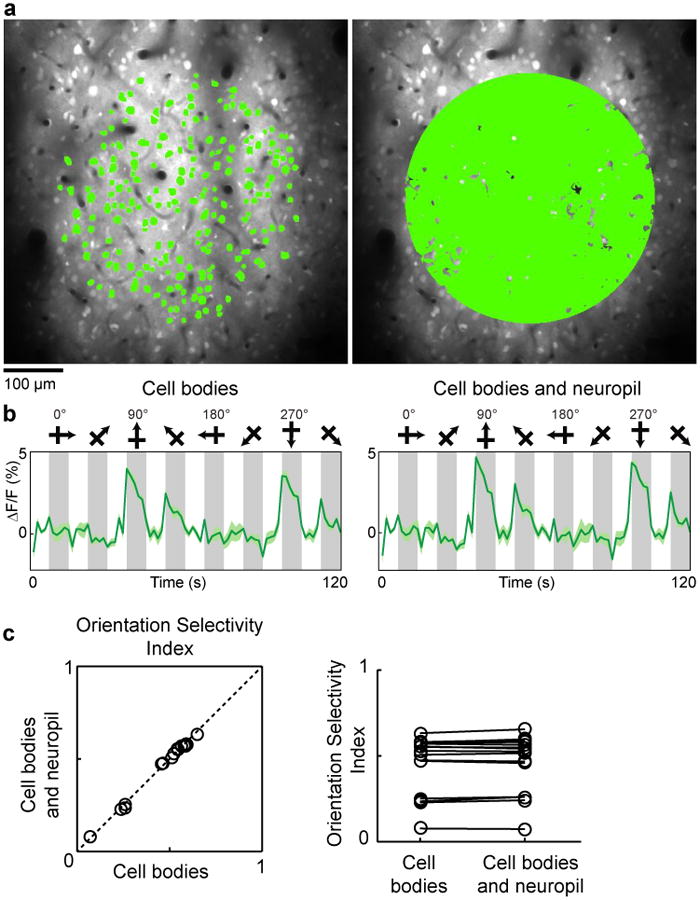
a, In vivo anatomical image of cells labeled with OGB-1 AM in cat visual cortex and selection of two different masks for quantitative analysis of orientation selectivity. Left panel: A 400-μm-diameter mask comprising soma pixels only. Right panel: A 400-μm-diameter mask comprising all significantly responding pixels (see Methods). b, The time courses of calcium responses computed from the two masks. Time courses are averages of five trials, error bands represent s.e.m. and gray bars represent the periods of visual stimulation. c, For a population of 16 imaged regions (from 7 cats), the orientation selectivity index (OSI) was computed with the two masks and found to be indistinguishable (cell bodies only OSI mean ± s.e.m. = 0.46 ± 0.04; cell bodies and neuropil OSI mean ± s.e.m. = 0.47 ± 0.04; P = 0.12; paired t-test).
Extended Data Figure 10. Orientation selective responses in Layer 1 neurons and synapses.
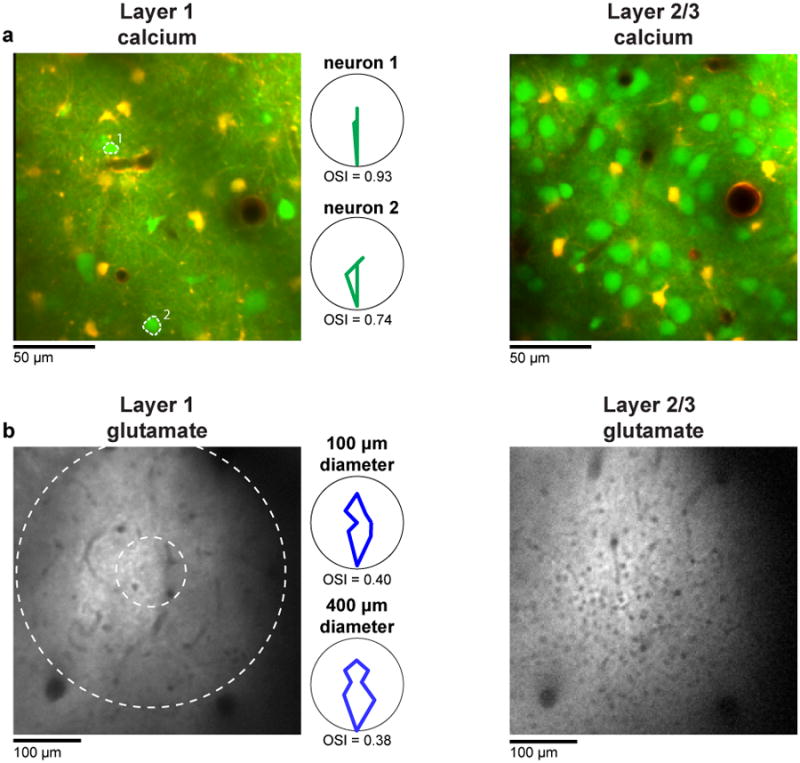
a, Region of cat visual cortex labeled with OGB 1-AM (to measure spiking activity) and SR101 (to distinguish astrocytes). Note the much sparser density of neuronal cell bodies in layer 1 (left) compared with deeper in layer 2/3 (right). The polar plots are the responses of the two layer 1 neurons labeled in the image. b, Region of cat visual cortex labeled with iGluSnFR (to measure synaptic activity). Again the density of cell bodies (the small black holes) in layer 1 (left) is much lower than in layer 2/3 (right). The polar plots are the responses of a 400-μm and 100-μm-diameter window of layer 1 glutamate activity.
Supplementary Material
Acknowledgments
We thank A. Shih for comments on the manuscript. This work was supported by grants from the NIH, NSF, Whitehall and Dana Foundations to P.K.
Footnotes
Author contributions P.K. conceived and supervised the project. All authors collected data. P.O. and P.C. analyzed data. P.O., M.L. and P.K. wrote the paper. All authors commented on and approved the final manuscript.
Competing interests statement The authors declare that they have no competing financial interests.
References
- 1.Raichle ME, Mintun MA. Brain work and brain imaging. Annu Rev Neurosci. 2006;29:449–476. doi: 10.1146/annurev.neuro.29.051605.112819. [DOI] [PubMed] [Google Scholar]
- 2.Grinvald A, Lieke E, Frostig RD, Gilbert CD, Wiesel TN. Functional architecture of cortex revealed by optical imaging of intrinsic signals. Nature. 1986;324:361–364. doi: 10.1038/324361a0. [DOI] [PubMed] [Google Scholar]
- 3.Heeger DJ, Huk AC, Geisler WS, Albrecht DG. Spikes versus BOLD: what does neuroimaging tell us about neuronal activity? Nat Neurosci. 2000;3:631–633. doi: 10.1038/76572. [DOI] [PubMed] [Google Scholar]
- 4.Logothetis NK, Pauls J, Augath M, Trinath T, Oeltermann A. Neurophysiological investigation of the basis of the fMRI signal. Nature. 2001;412:150–157. doi: 10.1038/35084005. [DOI] [PubMed] [Google Scholar]
- 5.Sirotin YB, Das A. Anticipatory haemodynamic signals in sensory cortex not predicted by local neuronal activity. Nature. 2009;457:475–479. doi: 10.1038/nature07664. [DOI] [PMC free article] [PubMed] [Google Scholar]
- 6.Maier A, et al. Divergence of fMRI and neural signals in V1 during perceptual suppression in the awake monkey. Nat Neurosci. 2008;11:1193–1200. doi: 10.1038/nn.2173. [DOI] [PMC free article] [PubMed] [Google Scholar]
- 7.Wang Z, Roe AW. Columnar specificity of microvascular oxygenation and blood flow response in primary visual cortex: evaluation by local field potential and spiking activity. J Cereb Blood Flow Metab. 2012;32:6–16. doi: 10.1038/jcbfm.2011.152. [DOI] [PMC free article] [PubMed] [Google Scholar]
- 8.Logothetis NK. What we can do and what we cannot do with fMRI. Nature. 2008;453:869–878. doi: 10.1038/nature06976. [DOI] [PubMed] [Google Scholar]
- 9.Ekstrom A. How and when the fMRI BOLD signal relates to underlying neural activity: the danger in dissociation. Brain Res Rev. 2010;62:233–244. doi: 10.1016/j.brainresrev.2009.12.004. [DOI] [PMC free article] [PubMed] [Google Scholar]
- 10.Ohki K, Chung S, Ch'ng YH, Kara P, Reid RC. Functional imaging with cellular resolution reveals precise micro-architecture in visual cortex. Nature. 2005;433:597–603. doi: 10.1038/nature03274. [DOI] [PubMed] [Google Scholar]
- 11.Kleinfeld D, et al. A guide to delineate the logic of neurovascular signaling in the brain. Front Neuroenergetics. 2011;3:1. doi: 10.3389/fnene.2011.00001. [DOI] [PMC free article] [PubMed] [Google Scholar]
- 12.Shen Z, Lu Z, Chhatbar PY, O'Herron P, Kara P. An artery-specific fluorescent dye for studying neurovascular coupling. Nat Methods. 2012;9:273–276. doi: 10.1038/nmeth.1857. [DOI] [PMC free article] [PubMed] [Google Scholar]
- 13.Drew PJ, Shih AY, Kleinfeld D. Fluctuating and sensory-induced vasodynamics in rodent cortex extend arteriole capacity. Proc Natl Acad Sci USA. 2011;108:8473–8478. doi: 10.1073/pnas.1100428108. [DOI] [PMC free article] [PubMed] [Google Scholar]
- 14.Hillman EMC, et al. Depth-resolved optical imaging and microscopy of vascular compartment dynamics during somatosensory stimulation. Neuroimage. 2007;35:89–104. doi: 10.1016/j.neuroimage.2006.11.032. [DOI] [PMC free article] [PubMed] [Google Scholar]
- 15.Shih AY, et al. The smallest stroke: occlusion of one penetrating vessel leads to infarction and a cognitive deficit. Nat Neurosci. 2013;16:55–63. doi: 10.1038/nn.3278. [DOI] [PMC free article] [PubMed] [Google Scholar]
- 16.Attwell D, et al. Glial and neuronal control of brain blood flow. Nature. 2010;468:232–243. doi: 10.1038/nature09613. [DOI] [PMC free article] [PubMed] [Google Scholar]
- 17.Howarth C, Gleeson P, Attwell D. Updated energy budgets for neural computation in the neocortex and cerebellum. J Cereb Blood Flow Metab. 2012;32:1222–1232. doi: 10.1038/jcbfm.2012.35. [DOI] [PMC free article] [PubMed] [Google Scholar]
- 18.Hall CN, et al. Capillary pericytes regulate cerebral blood flow in health and disease. Nature. 2014;508:55–60. doi: 10.1038/nature13165. [DOI] [PMC free article] [PubMed] [Google Scholar]
- 19.Hill RA, et al. Regional Blood Flow in the Normal and Ischemic Brain Is Controlled by Arteriolar Smooth Muscle Cell Contractility and Not by Capillary Pericytes. Neuron. 2015;87:95–110. doi: 10.1016/j.neuron.2015.06.001. [DOI] [PMC free article] [PubMed] [Google Scholar]
- 20.Blinder P, et al. The cortical angiome: an interconnected vascular network with noncolumnar patterns of blood flow. Nature Neuroscience. 2013;16:889–897. doi: 10.1038/nn.3426. [DOI] [PMC free article] [PubMed] [Google Scholar]
- 21.Kleinfeld D, Mitra PP, Helmchen F, Denk W. Fluctuations and stimulus-induced changes in blood flow observed in individual capillaries in layers 2 through 4 of rat neocortex. Proc Natl Acad Sci U S A. 1998;95:15741–15746. doi: 10.1073/pnas.95.26.15741. [DOI] [PMC free article] [PubMed] [Google Scholar]
- 22.Chhatbar PY, Kara P. Improved blood velocity measurements with a hybrid image filtering and iterative Radon transform algorithm. Frontiers in Neuroscience. 2013;7 doi: 10.3389/fnins.2013.00106. [DOI] [PMC free article] [PubMed] [Google Scholar]
- 23.Tian P, et al. Cortical depth-specific microvascular dilation underlies laminar differences in blood oxygenation level-dependent functional MRI signal. Proceedings of the National Academy of Sciences. 2010;107:15246–15251. doi: 10.1073/pnas.1006735107. [DOI] [PMC free article] [PubMed] [Google Scholar]
- 24.Berwick J, et al. Fine Detail of Neurovascular Coupling Revealed by Spatiotemporal Analysis of the Hemodynamic Response to Single Whisker Stimulation in Rat Barrel Cortex. Journal of Neurophysiology. 2008;99:787–798. doi: 10.1152/jn.00658.2007. [DOI] [PMC free article] [PubMed] [Google Scholar]
- 25.Chen BR, Bouchard MB, McCaslin AFH, Burgess SA, Hillman EMC. High-speed vascular dynamics of the hemodynamic response. NeuroImage. 2011;54:1021–1030. doi: 10.1016/j.neuroimage.2010.09.036. [DOI] [PMC free article] [PubMed] [Google Scholar]
- 26.Chen BR, Kozberg MG, Bouchard MB, Shaik MA, Hillman EM. A critical role for the vascular endothelium in functional neurovascular coupling in the brain. J Am Heart Assoc. 2014;3:e000787. doi: 10.1161/JAHA.114.000787. [DOI] [PMC free article] [PubMed] [Google Scholar]
- 27.Vanzetta I, Slovin H, Omer DB, Grinvald A. Columnar resolution of blood volume and oximetry functional maps in the behaving monkey; implications for FMRI. Neuron. 2004;42:843–854. doi: 10.1016/j.neuron.2004.04.004. [DOI] [PubMed] [Google Scholar]
- 28.Fukuda M, et al. Localization of Activity-dependent Changes in Blood Volume to Submillimeter-scale Functional Domains in Cat Visual Cortex. Cerebral Cortex. 2005;15:823–833. doi: 10.1093/cercor/bhh183. [DOI] [PubMed] [Google Scholar]
- 29.Rao SC, Toth LJ, Sur M. Optically imaged maps of orientation preference in primary visual cortex of cats and ferrets. J Comp Neurol. 1997;387:358–370. doi: 10.1002/(sici)1096-9861(19971027)387:3<358::aid-cne3>3.3.co;2-v. [DOI] [PubMed] [Google Scholar]
- 30.Li Y, Van Hooser SD, Mazurek M, White LE, Fitzpatrick D. Experience with moving visual stimuli drives the early development of cortical direction selectivity. Nature. 2008;456:952–956. doi: 10.1038/nature07417. [DOI] [PMC free article] [PubMed] [Google Scholar]
- 31.O'Herron P, et al. Targeted labeling of neurons in a specific functional micro-domain of the neocortex by combining intrinsic signal and two-photon imaging. Journal of Visualized Experiments. 2012 doi: 10.3791/50025. [DOI] [PMC free article] [PubMed] [Google Scholar]
- 32.Chen TW, et al. Ultrasensitive fluorescent proteins for imaging neuronal activity. Nature. 2013;499:295–300. doi: 10.1038/nature12354. [DOI] [PMC free article] [PubMed] [Google Scholar]
- 33.Marvin JS, et al. An optimized fluorescent probe for visualizing glutamate neurotransmission. Nat Methods. 2013;10:162–170. doi: 10.1038/nmeth.2333. [DOI] [PMC free article] [PubMed] [Google Scholar]
- 34.Kara P, Boyd JD. A micro-architecture for binocular disparity and ocular dominance in visual cortex. Nature. 2009;458:627–631. doi: 10.1038/nature07721. [DOI] [PMC free article] [PubMed] [Google Scholar]
- 35.Ringach DL, Shapley RM, Hawken MJ. Orientation selectivity in macaque V1: diversity and laminar dependence. J Neurosci. 2002;22:5639–5651. doi: 10.1523/JNEUROSCI.22-13-05639.2002. [DOI] [PMC free article] [PubMed] [Google Scholar]
- 36.Hedges LV, Olkin I. Statistical method for meta-analysis. Academic press; 2014. [Google Scholar]
- 37.Chhatbar PY, et al. Transcranial Direct Current Stimulation Post-Stroke Upper Extremity Motor Recovery Studies Exhibit a Dose-Response Relationship. Brain Stimul. 2016;9:16–26. doi: 10.1016/j.brs.2015.09.002. [DOI] [PMC free article] [PubMed] [Google Scholar]
Associated Data
This section collects any data citations, data availability statements, or supplementary materials included in this article.