Abstract
To modify the Pichia pastoris cell surface, two classes of hydrophobins, SC3 from Schizophyllum commune and HFBI from Trichoderma reesei, were separately displayed on the cell wall. There was an observable increase in the hydrophobicity of recombinant strains. Candida antarctica lipase B (CALB) was then co-displayed on the modified cells, generating strains GS115/SC3-61/CALB-51 and GS115/HFBI-61/CALB-51. Interestingly, the hydrolytic and synthetic activities of strain GS115/HFBI-61/CALB-51 increased by 37% and 109%, respectively, but decreased by 26% and 43%, respectively, in strain GS115/SC3-61/CALB-51 compared with the hydrophobin-minus recombinant strain GS115/CALB-GCW51. The amount of glycerol by-product from the transesterification reaction adsorbed on the cell surface was significantly decreased following hydrophobin modification, removing the glycerol barrier and allowing substrates to access the active sites of lipases. Electron micrographs indicated that the cell wall structures of both recombinant strains appeared altered, including changes to the inner glucan layer and outer mannan layer. These results suggest that the display of hydrophobins can change the surface structure and hydrophobic properties of P. pastoris, and affect the catalytic activities of CALB displayed on the surface of P. pastoris cells.
Keywords: Hydrophobin, co-display, hydrophobicity, Candida antarctica lipase B, Pichia pastoris
Introduction
Hydrophobins, which are produced exclusively by filamentous fungi, belong to a family of small amphipathic proteins. They all contain similar hydropathy patterns and eight cysteine residues at conserved positions. The amphipathic protein layer is formed when assembly occurs on the surface, and finally changes the wettability of the solid to make the hydrophilic surface hydrophobic and vice versa (Wösten et al. 1994b; Wosten et al. 1993). Hydrophobins have been suggested for use in a wide variety of biotechnological applications, including formation of coatings and removal of diesel oil from contaminated water, and promotion of tissue-culture cell growth. Further applications include acting as emulsifying agents, and as additives in the manufacture of aerated foods, due to their surface-modifying activities and lack of immunogenicity (Linder 2009). Hydrophobins can be divided into two classes based on differences in hydropathy properties, solubilities and the types of layers they form (Wessels 1996), although intermediate forms between class I and class II could also exist by bioinformatics analysis. Many hydrophobins with distinct physicochemical characteristics may have been overlooked in the past (Jensen et al. 2010; Littlejohn et al. 2012). The class I hydrophobin SC3 from Schizophyllum commune has excellent surface activity. At the liquid–vapor interface, SC3 causes a large decrease in the surface tension of water (from 72 to 43 mJ m−2) at a concentration of 0.1 mg/ml (Van der Vegt et al. 1996). The class II hydrophobin HFBI from Trichoderma reesei was expressed on the surface of yeast by fusing it to the cell wall flocculation protein Flo1 of Saccharomyces cerevisiae to modify the cell surface properties. The results indicated that modified cells with HFBI had a more apolar and slightly less negatively charged surface compared with the S.cerevisiae strain (Nakari-Setälä et al. 2002). The fact that hydrophobins changed the surface characteristics of the yeast cells opens the door for the development of new high-efficiency cell catalysts.
Many studies have been performed to understand the relationships between immobilized lipase activities and surface characteristics of solid materials. Lipases (glycerol-ester hydrolases, EC3.1.1.3) are one of the most widely used enzymes in biocatalysis and scientific applications because of their diverse substrate specificity, stereo-specificity, and tolerance of heat and various organic solvents (Jaeger and Eggert 2002). Most types of lipases were found that existed the interfacial activation phenomenon. Lipases usually adopt two forms: closed form (inactive) in which the substrate access to the active center is blocked by a hydrophobic amino acids chain, called “lid”, and open form (active) in which lid polypeptide flips, opening the active center pocket. The two forms are found in an equilibrium shifted toward the closed state in a homogeneous aqueous solutions. Once meeting the hydrophobic environment, the equilibrium is shifted toward the open form (Brzozowski et al. 1991). The interfacial activation mechanism inspired the design of immobilized lipase with high enzymatic activity. For example, Guisán first reported the hyperactivation of lipase via interfacial adsorption on hydrophobic supports. The activity of lipase immobilized on the octyl-agarose gels increased by 6–20 fold than the soluble one (Bastida et al. 1998). Fernandez-Lafuente further reported the immobilization that involves the open form of the lipase (Manoel et al. 2015). Schilke and Kelly presented a method for covalent immobilization of Candida antarctica lipase B (CALB) on solid surfaces using a long hydrophobic polytryptophan tether, which resulted in 35 times greater esterification and five times greater hydrolytic activity against p-nitrophenol palmitate (Schilke and Kelly 2008). In addition, Chen et al. showed that a small change in the hydrophobic/hydrophilic balance of the epoxy-activated polymer films not only changed the binding ability between polymer films and CALB, but also significantly affected the specific activity of the bound CALB (Chen et al. 2008).
The display of lipase on yeast cell surface is currently a very active topic in the field of organic bioconversion. It can be used as a whole-cell biocatalyst, which is a promising alternative to conventional immobilized lipase, and have been used in the synthesis of chiral compounds (Matsumoto et al. 2002), biodiesel (Jin et al. 2013), and flavor esters (Jin et al. 2012). However, the surfaces of yeast cells are relatively hydrophilic because of the presence of various polysaccharides and proteins. When lipases displayed on the cell surface were used to catalyze an esterification reaction of triglyceride, the glycerol by-products would be absorbed on support and form a hydrophilic layer, leading to cell aggregation, poor dispersibility of displayed lipase, and decreased catalytic activity (Jin et al. 2013). Séverac developed a lipase immobilization system on the support of Accurel MP, which found very hydrophobic. The new immobilized lipase could not absorb the glycerol and permit long-lasting continuous transesterification reactions (Séverac et al. 2011).
On the base of their characteristics, hydrophobins SC3 and HFBI from Schizophyllum commune and Trichoderma reesei, respectively, were displayed on the surface of Pichia pastoris cells to modify the surface structure. After co-displaying CALB on the cell surfaces, the hydrolytic and synthetic activities of CALB were examined. The results indicated that the hydrophobin HFBI increased the catalytic activity of CALB obviously. Finally, the hydrophobicity, structure, and effect of CALB displayed on P. pastoris cells were investigated.
Materials and methods
Strains and culture conditions
P. pastoris strain GS115 and Escherichia coli TOP10 were purchased from Invitrogen (Carlsbad, CA, USA). E.coli TOP 10 cells were used in plasmid construction and were incubated at 37 °C in Luria-Bertani low salt medium (1% w/v tryptone, 0.5% w/v yeast extract, 0.5% w/v NaCl) supplemented with 100 µg/ml zeocin. P. pastoris yeast strains were cultured at 30°C in the following media: YPD (1% w/v yeast extract, 2% w/v peptone, and 2% w/v glucose) for sub-cultivation; BMGY (1% w/v yeast extract, 2% w/v peptone, 100 mM potassium phosphate pH 6.0, 1.34% w/v yeast nitrogen base (YNB), and 1% v/v glycerol) for cell growth; and BMMY (same as BMGY but substituting 1% v/v glycerol for 1% v/v methanol) for recombinant protein production.
Construction and fermentation of the yeast transformants
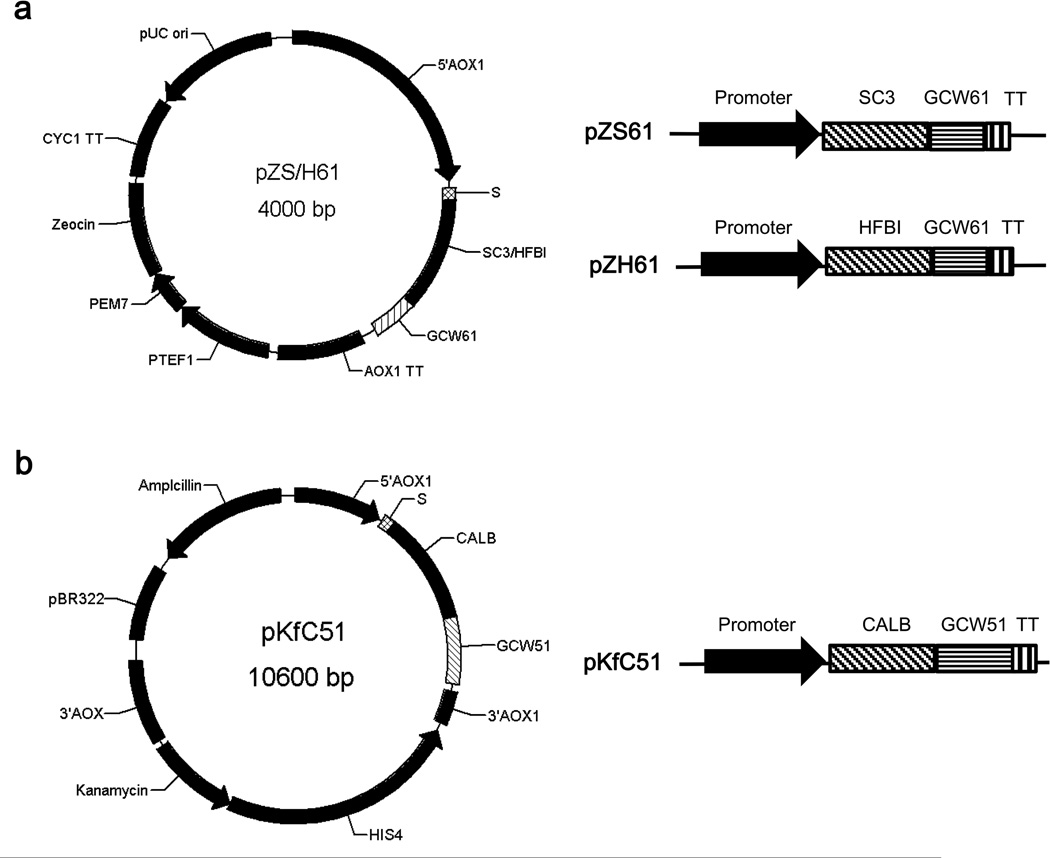
The codon optimized S. commune SC3 gene sequence (GenBank: KU173824) and the T. reesei HFBI gene sequence (GenBank: KU173825) were synthesized by Sangon Biotech Corporation (Shanghai, China). All primers used for plasmid construction are listed in Table S1. The SC3 gene was amplified by polymerase chain reaction (PCR) using the primers PS-1/PS-2, containing an EcoR I site at the 5′-terminus and a Mlu I sites at the 3′- terminus. The HFBI gene was amplified using the same method with primers PH-1/PH-2, containing the same restriction sites. The GCW61 gene (NCBI accession no. XM_002494287.1) was amplified from the genomic DNA of P. pastoris GS115 using primers P61-1/P61-2 containing Mlu I and Not I restriction sites. The PCR products were gel-purified and digested with corresponding restriction enzymes. The digested fragments (SC3/HFBI and GCW61), along with plasmid pPICZaA digested with EcoR I and Not I, were ligated overnight. The resulting recombinant plasmids, named pZS61 and pZH61 (Fig.1a), were transformed into chemically competent E. coli TOP 10 cells. The plasmids from positive clones were purified and verified by restriction enzyme digestion and sequencing. The recombinant plasmids were then linearized with Sac I and subsequently transformed into the host strain GS115 by electroporation, according to the manufacturer's instructions (Invitrogen). The recombinants were named GS115/SC3-GCW61 and GS115/HFBI-GCW61. CALB was amplified from the plasmid pKNS-CALB (Su et al. 2010) using primers PfC-1/ PfC-2, containing a FLAG tag, EcoR I and Mlu I restriction sites. The GCW51 gene (NCBI accession no. XM_002493737.1) was amplified from the genomic DNA of P. pastoris GS115 using primers P51-1/P51-2 containing Mlu I and Not I restriction sites. With the same ligated method, the digested fragments CALB, GCW51 and plasmid pPIC9K digested with EcoR I and Not I, were ligated overnight. The resulting recombinant plasmid, named pKfC51 (Fig.1b), was linearized with Sac I and transformed into GS115, GS115/SC3-GCW61, and GS115/HFBI-GCW61 cells. The recombinant strains were named GS115/CALB-GCW51, GS115/SC3-61/CALB-51, and GS115/HFBI-61/CALB-51, respectively. All the P. pastoris strains used in the present study are described in Table 1.
Fig.1.
Schematic diagram of plasmid construction and outline of the vector expression cassette used in this study. a The vectors pZS61 and pZH61contained a SC3-GCW61 fusion and a HFBI-GCW61fusion, respectively. b The vector pKfC51 contained a CALB-GCW51 fusion. S,alpha signal sequence; TT, transcription termination.
Table 1.
Strains used in this study
| Strains | Essential properties | Reference |
|---|---|---|
| GS115 | Host strain | Invitrogen |
| GS115/SC3-GCW61 | GS115 displaying hydrophobin SC3 with anchoring protein GCW61. |
This study |
| GS115/HFBI-GCW61 | GS115 displaying hydrophobin HFBI with anchoring protein GCW61. |
This study |
| GS115/CALB-GCW51 | GS115 displaying CALB with anchoring protein GCW51. |
This study |
| GS115/SC3-61/CALB-51 | GS115/SC3-GCW61 co-displaying CALB with anchoring protein GCW51. |
This study |
| GS115/HFBI-61/CALB-51 | GS115/HFBI-GCW61 co-displaying CALB with anchoring protein GCW51 |
This study |
The strains were pre-cultured in BMGY medium to an optical density (measured at 600 nm) of 2 to 6. The cultures were then centrifuged at 6,000×g for 1 min and the cells were resuspended in BMMY medium containing 1% (v/v) methanol to an OD600 of 1. Pure methanol was added to the culture medium every 24 h to maintain the induction of the proteins for 120 h. All fermentations were carried out in shakers (250rpm) at 30 °C.
Immunofluorescence microscopy and flow cytometry analysis
The strains containing a FLAG tag were harvested following120 h of methanol induction. Flow cytometry analysis was performed as described by Sun et al. (Sun et al. 2012). Cells were centrifuged at 6,000×g for 1 min and the supernatant was discarded. The cells were washed three times with 10 mM phosphate-buffered saline (PBS, pH 7.4) and then resuspended in PBS containing 1% (m/v) bovine serum albumin (BSA) to block the cell surface. A monoclonal antibody against the FLAG tag (DYKDDDDK) was used as the primary antibody (diluted 1:200 in PBS). The antibody was added to 200 µl of cell suspension (OD600=5), and then incubated on a rotator for 2 h at 37 °C. Cells were then washed three times with PBS by centrifugation and resuspended in 200 µl of PBS (containing1% BSA) prior to being exposed to Alexa Fluor 488 goat anti-mouse IgG antibody (diluted 1:200 in PBS). Following incubation for 1 h at 37°C, cells were washed with PBS three times by centrifugation and then resuspended in 1.5 ml of PBS. Finally, a 2 µl cell suspension was loaded onto a glass slide and directly examined using a fluorescence microscope (BX51, Olympus, Japan). The remaining cell suspension was used for flow cytometry analysis (Beckman Coulter, Fullerton, CA). Ten thousand cells per sample were counted and analyzed using Exp032 software (Beckman Coulter).
Assay of cell surface hydrophobicity
The hydrophobic nature of the outermost surface of the yeast cells was determined by microbial adhesion to hydrocarbon (MATH), which is modified from the protocol in reference (Hama et al. 2010). In this method, the proportion of the yeast cells passing into the organic phase reflects the adsorption of the yeast cells to the organism. The yeast solutions were washed twice and then resuspended to an OD600=2 in PBS (pH=8.0, 1 mM). The absorbance of the cell suspension was accurately measured and defined as A1. Two milliliters of n-butyl alcohol were then added to 2 ml of the cell suspension in a 15-ml screw-capped bottle. After vortexing for 30 s, the mixture was allowed to stand for 3 min to enable the complete separation of the two phases. The absorbance of the lower aqueous phase at 600 nm was measured and defined as A2. Hydrophobicity is then given as percentages calculated from the following equation: hydrophobicity (%) = (A1−A2)/A1.
The analysis of CALB activity
A modified lipase hydrolytic activity assay was used (Zhang et al. 2013). After induction with BMMY for the expression of CALB, the hydrolytic activity was measured spectrophotometrically using p-nitrophenyl butyrate (pNPB; Sigma, St. Louis, MO, USA) as the substrate. pNPB was emulsified by sonication in ultrapure water containing 0.5% Triton X-100, resulting in a final concentration of 25 mM. The 1 ml reaction solution, consisting of 940 µl of 50 mM Tris-HCl buffer (pH 8.0), 10 µl of cell suspension with appropriate dilution, and 50 µl pNPB, was incubated for 5 min at 45 °C. After the reaction was completed, the assay mixture was centrifuged at 6,000 × g at room temperature for 1 min. A 200-µl aliquot of the supernatant was added to a 96-well plate and the absorbance was measured using a kinetic microplate reader (Molecular Devices, Sunnyvale, CA, USA). Average values were generated from triplicates of each sample. The cell density was confirmed by OD600 measurement. The hydrolytic activity of CALB was defined as the amount of enzyme that released l µmol p-nitrophenol (pNP) per min from pNPB under the assay conditions.
The synthetic activity was performed using the ester synthesis method as described by Sun and Xu (Sun and Xu 2008) with modification. The recombinant P. pastoris was induced with BMMY for the expression of CALB. The cells were harvested, then washed three times and resuspended with 50 mM Tris-HCl buffer (pH 8.0). The cell suspension was lyophilized overnight in a Christ Alpha 2–4 freeze Dryer (Christ, Osterode, Germany). A 0.05 g aliquot of lyophilized whole-cell lipase powder was added to 10 ml of heptane containing 0.6 M hexanoic acid and 0.6 M ethanol. The reaction was performed in 50-ml Erlenmeyer shake flasks at 50 °C for 30 min with shaking at 200 rpm. Ethyl hexanoate present in the reaction mixture was assayed using an Agilent 7890A gas chromatography apparatus equipped with a DB-FFAP silica capillary column (0.25mm×30m, Agilent, Santa Clara, CA, USA) and a hydrogen flame-ionization detector. The column temperature was held at 80 °C for 0.5 min, and then increased to 120 °C at 40°C/min, and maintained for 0.5 min. The temperature was then increased to 160°C at 40 °C/min and held for 0.5 min. The injector and detector temperatures were both set at 250 °C. The carrier gas was nitrogen. One unit of lipase synthetic activity was defined as the amount of enzyme catalyzed to produce 1µmol of ester per minute. All reported data are averages of the values obtained from experiments that were performed at least in triplicate.
Quantification of CALB displayed on the cell surface
The amount of CALB displayed on the cell surface was determined using 4-methylumbelliferyl hexylphosphonate (4-MUHP) and a method described previously (Jin et al. 2014). The reaction system contained 0.1 g of lyophilized cells, 25 µl of 1mM lipase irreversible inhibitor 4-MUHP, 25 µl of distilled H2O, and 1950 µl of anhydrous ethanol. The reaction was carried out at 40 °C for 6 days with shaking at 200 rpm. Once the reaction was complete, the reactant was centrifuged at 6,000×g for 5 min to collect the reaction liquid. Cells were resuspended in 2 ml of anhydrous ethanol at 40 °C for 1 h before the extract was collected. The procedure was repeated four times. The total reaction liquid and extract were combined and diluted to a certain volume with absolute ethanol. Finally, 200 µl of reaction liquid were added to a black 96-well plate. The fluorescence intensity of the sample solution was detected using an Infinite M200 multi-function microplate reader (TECAN, Männedorf, Switzerland), with an excitation wavelength of 320 nm and an emission wavelength of 380 nm. The data are averages of at least triplicate experiments. The amount of enzyme displayed on the cell surface was the mass ratio of CALB and cells.
The adsorption of glycerol by-product on the cell surface
The hydrophilic by-products of the transesterification reaction, such as water and glycerol, are easily adsorbed on the cell surface, which can seriously affect cell dispersion and block the contact between enzyme and substrate. The detection of glycerol by-product was adsorbed as described by Jin et al. (Jin et al. 2013), with some modifications. The reaction mixtures were as follows: soybean oil (0.965g), isooctane (0.9% v/v, soybean oil), lyophilized cells (0.19% w/w, soybean oil), and methanol (3.65% mol/mol, soybean oil). Methanol was added in equal amounts using a two-step procedure at 0 h and 8 h. The reactions were performed in 10-ml Erlenmeyer shake flasks at 50 °C for 20 h with shaking at 200 rpm. The amount of glycerol adsorbed on the cell surface was assessed by rinsing the immobilized lipase with tert-butanol to remove the glycerol. The sample was then subjected to gas chromatography (GC) analysis.
An Agilent 7890A gas chromatograph equipped with a hydrogen flame-ionization detector and a DP-17column (0.32mm×30m, Agilent, Santa Clara, CA, USA) was used for GC analysis. Injector and detector temperatures were set at 320 °C and 350 °C, respectively. The carrier gas was nitrogen. When glycerol samples were analyzed, the column temperature was held at 50 °C, then raised to 320 °C at 15 °C/min and maintained for 2 min. All reported data are averages of experiments performed at least in triplicate.
Detection of the cell wall components of yeast
Congo red (CR) stain was first used to qualitatively check the β-1,3-glucan content of the cells. Cells were grown in liquid YPD at 30°C overnight. About 5×10⁷ cells were diluted in a 10-fold series (from 10−1 to10−5 relative to the initial culture) in water. Aliquots (5 µl) from each dilution series were applied onto the surface of YPD agar and incubated at 30 °C for 48 h.
The β-1,3 glucan content was measured as previously described (Sekiya-Kawasaki et al. 2002) with some modifications. In brief, cells were grown to OD600=1.0. A 1-ml volume of cells (5×10⁶ cells) was washed twice with TE (10 mM Tris-HCl, 1 mM EDTA, pH 8.0) and then resuspended in 250 µl of TE. NaOH (6M) was added to the cells to achieve a final concentration of 1 M, and then incubated at 80 °C for 30 min. A 1.05-ml aliquot of AB mix (0.03% aniline blue (Sangon, Shanghai, China), 0.18 M HCl, and 0.49 M glycine/NaOH, pH 9.5) was then added to the cell mixture. The tube was vortexed briefly, then incubated at 50 °C for 30 min. Fluorescence of β-1,3-glucan was then quantified using a spectrofluorometer with excitation wavelength 400 nm and emission wavelength 460 nm.
Transmission electron microscopy (TEM)
Strains co-displaying hydrophobin and CALB were harvested following BMMY induction for 120 h. Cell cultures were centrifuged at 6,000×g and the supernatant was discarded. The pellets were washed once with water and then immediately frozen using a Bal-Tec HP10 high-pressure freezer (Bal-Tec AG, Balzers, Liechtenstein). Freeze-substitution was performed in Leica EM AFS2 as described previously (McDonald and Webb 2011). First, the specimen carrier was placed into the substitution solution (1% OsO4, 0.1% uranyl acetate, and 2% water in acetone) vials under liquid nitrogen. Then the frozen water in the specimens was gradually replaced within a series of steps: −140 °C~−90 °C (30 min), −90 °C (48 h), −90 °C~−80°C (2 h), −80 °C (24 h), −80 °C~−20 °C (12 h), −20 °C (12 h), −20 °C~0 °C (4 h), 0 °C (2 h), 0 °C~4 °C (1 h), 4 °C (2 h, rinse three times with pure acetone). Subsequently, the specimens were brought to room temperature within 2 h, and then rinsed three times with pure acetone for 30 min per rinse. The re-substituted samples were infiltrated with Epon resin/pure acetone in steps of 10% (1 h), 20% (1 h), 50% (2 h), 75% (8 h), and pure resin (12 h, 12 h, 12 h), and then polymerized for 48 h at 60 °C. The blocks were then cut into 100-nm sections with a diamond knife on a Leica EM UC6 microtome (Leica, Darmstadt, Germany), and collected on formvar-coated copper slot grids. All specimens were examined on a JEOL 1400 electron microscope operating at 120 keV.
Results
Display of hydrophobins on the cell surface
To display the hydrophobins on the surface of P. pastoris GS115, the genes encoding hydrophobins SC3 and HFBI were separately fused with GCW61, encoding the cell wall anchor protein. The α-factor secretion signal sequence from S. cerevisiae was placed upstream of the hydrophobin genes to guide the target proteins in the secretion process. The resulting plasmids pZS61 and pZH61 (Fig.1a) were linearized and transformed into the host strain GS115. Following screening, the recombinant strains GS115/SC3-GCW61 and GS115/HFBI-GCW61were obtained.
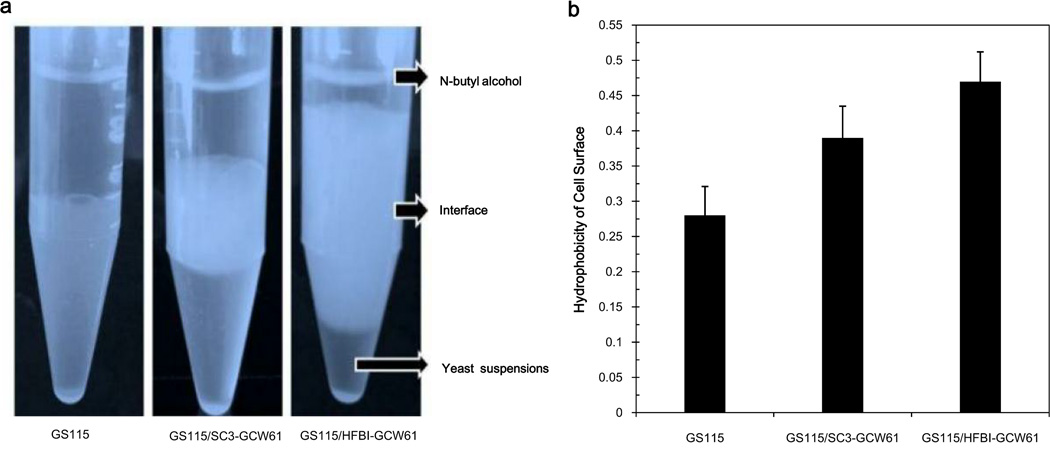
First, the surface hydrophobicities of the three strains, GS115/SC3-GCW61, GS115/HFBI-GCW61, and GS115, were examined, respectively. We observed different interfacial phenomena for the three strains (Fig.2a). The hydrophobin-modified cells showed obvious bubbles between the layers of n-butyl alcohol and cell suspension. The results of the cell hydrophobicity assays are presented in Fig.2b. The hydrophobicity of host strain GS115 was 0.28, while strain GS115/SC3-GCW61 exhibited a hydrophobicity of 0.39 (128% of that of the host strain). Strain GS115/HFBI-GCW61 showed even stronger hydrophobicity (0.47), which corresponded to 168% of that of the host strain. Therefore, cell surface display of hydrophobins affected the hydrophobicity of the P. pastoris cell surface.
Fig.2.
Analysis of the surface hydrophobicity of the three strains. Recombinant cells were induced to display CALB in BMMY medium containing 1% (v/v) methanol for 120 h. a The interfacial phenomena of the recombinant cells. b Hydrophobicity of the cells as measured by the modified microbial adhesion to hydrocarbon method. Data was obtained from three independent experiments.
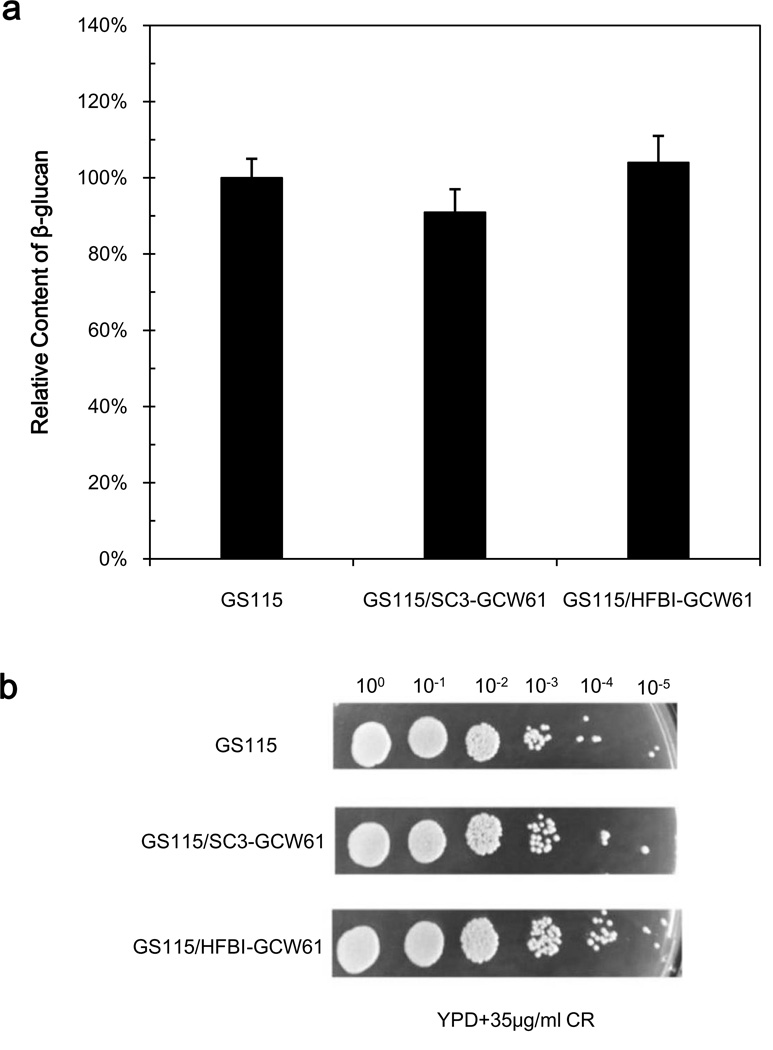
Following modification of the cell surface with hydrophobins, we examined the sensitivity of the strains to the cell wall-disrupting reagent CR (Fig.3b), which can detect additional defects in the β-1-3- D-glucan assembly (Kopecká and Gabriel 1992). Strain GS115/SC3-GCW61 showed an increased sensitivity, and quantitative analysis showed that the strain had a slight decrease (91% of that of the wild-type) compared with GS115 (Fig.3a). No obvious CR sensitivity increase was observed for strain GS115/HFBI-GCW61, but a slight increase in the amount of cell wall component β-1,3-glucan was noted.
Fig. 3.
Analysis of cell wall composition of three strains. a Levels of β-1,3-glucan as a percentage of the amount present in strain GS115. b Sensitivity of the three strains to Congo red in YPD medium.
Co-display of CALB and hydrophobins on the cell surface
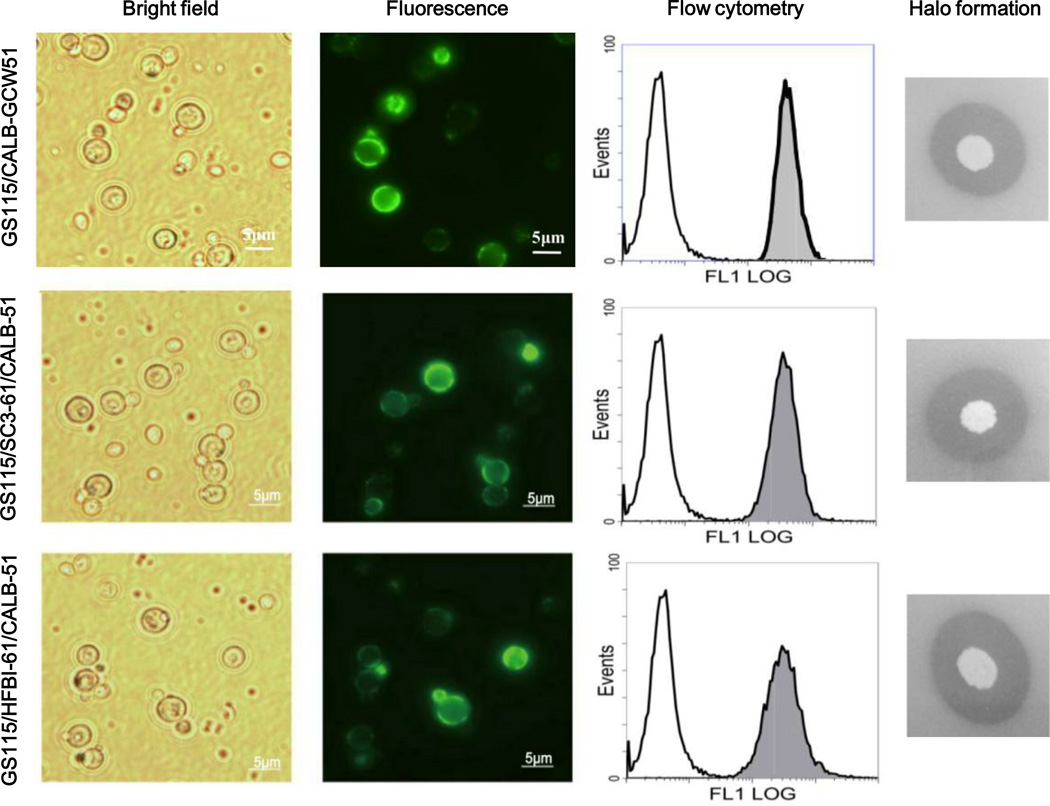
We attempted to co-display CALB on the surface of P. pastoris cells that were already functionally displaying both hydrophobins. The plasmid pKfC51 (Fig.1b) containing CALB was transformed into GS115, GS115/SC3-GCW61, and GS115/HFBI-GCW61 cells, generating recombinant strains GS115/CALB-GCW51, GS115/SC3-61/CALB-51, and GS115/HFBI-61/CALB-51. Results from fluorescence microscopy and flow cytometry confirmed the successful display of CALB on the cell surface (Fig.4).
Fig.4.
Fluorescence microscopy, flow cytometry and halo formation analysis of the expression of CALB on the surface of recombinant P. pastoris strains. The x-axis of flow cytometry represents the fluorescence intensity, and the y-axis represents the cell count. Strain GS115 was set as the background, and the gray-filled peaks show increased fluorescence intensity on the cell surface.
After the CALB and hydrophobins were confirmed to be co-displayed, the hydrophobicity of cell surface and the activities of CALB were quatitatively analyzed. To further investigate the reasons for the changed CALB activities, we examined the amount of CALB and absorbed glycerol on the yeast cell surface.
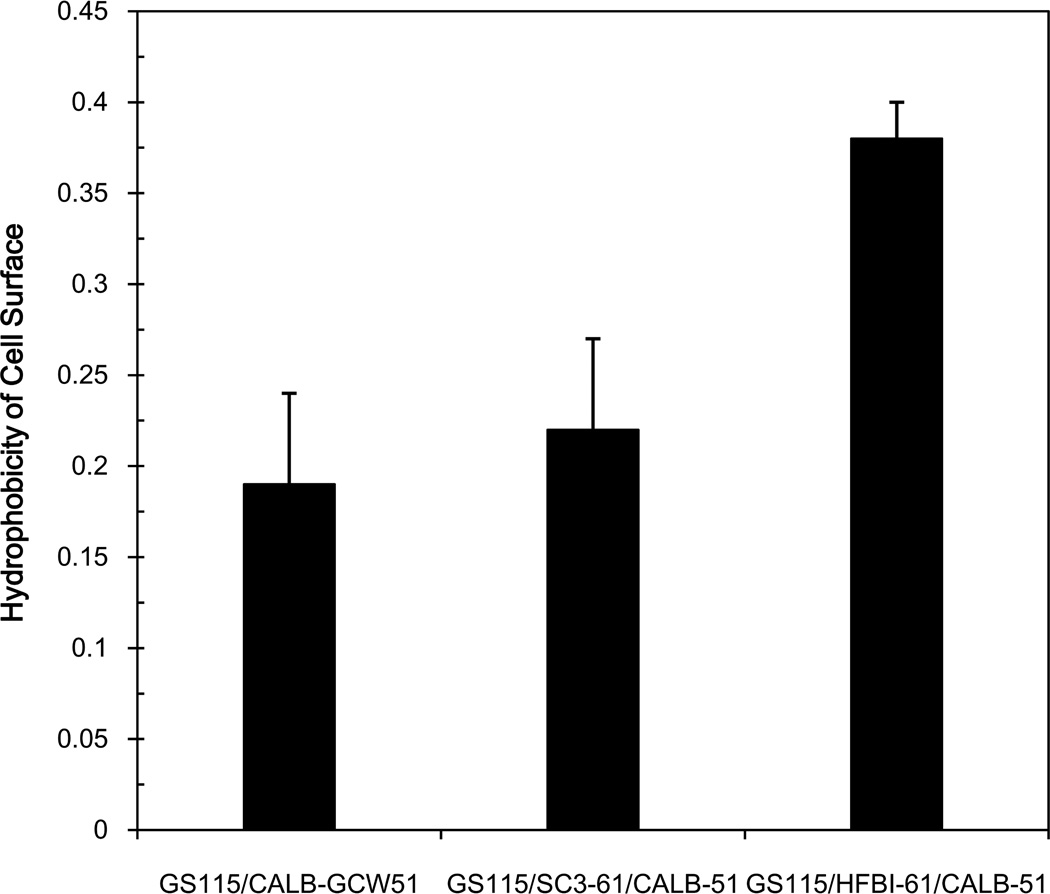
Firstly, we investigated the cell surface hydrophobicity of the recombinant strains to determine the interaction between the cell surfaces and the environment. The hydrophobicities of three strains, GS115/SC3-61/CALB-51, GS115/HFBI-61/CALB-51, and GS115/CALB-GCW51, are presented in Fig.5. The hydrophobicity of strain GS115/CALB-GCW51 was 0.19. Strain GS115/SC3-61/CALB-51 exhibited a slight increase in hydrophobicity (0.22) compared with GS115/CALB-GCW51 (116% of that of the hydrophobin-minus control). Strain GS115/HFBI-61/CALB-51 showed the largest increase in hydrophobicity (0.38), corresponding to an increase of 100% compared with GS115/CALB-GCW51. Compared with strains displaying only the hydrophobins, the hydrophobicity of the co-displaying strains was slightly reduced.
Fig. 5.
Analysis of the surface hydrophobicity of the three strains co-displaying CALB and hydrophobins. Recombinant cells were induced to display CALB in BMMY medium containing 1% (v/v) methanol for 120 h. The hydrophobicity of the cells was measured using the modified microbial adhesion to hydrocarbon method. Data was obtained from three independent experiments.
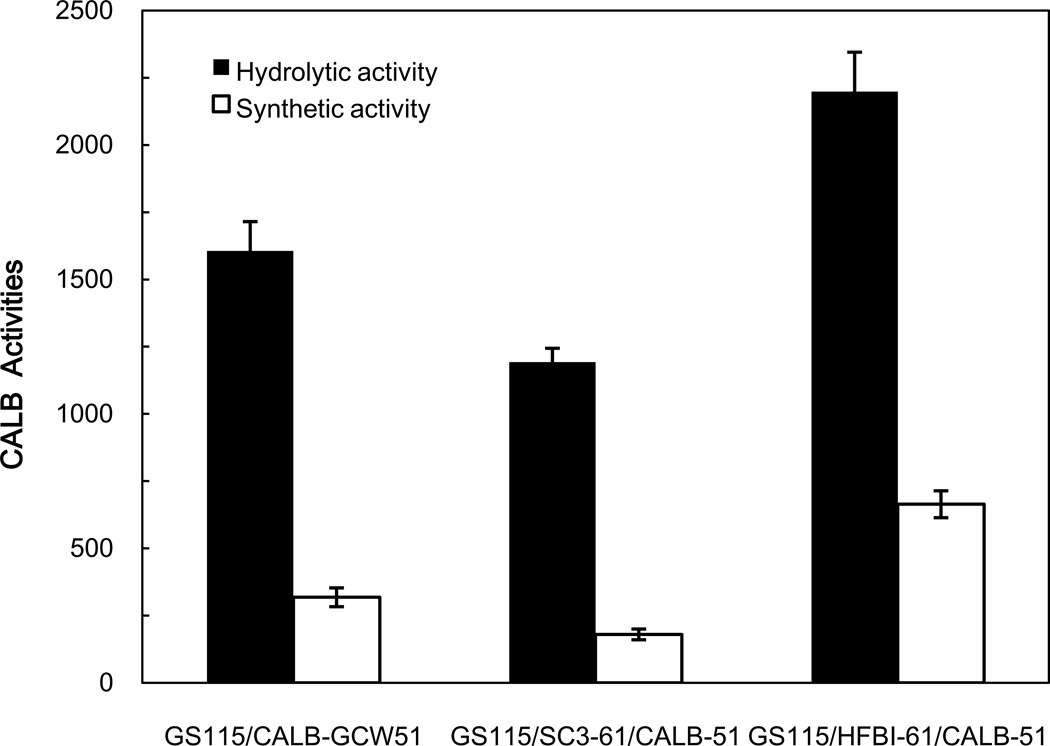
And then, the hydrolytic activity of CALB was qualitatively analyzed on a tributyrin agar plate. After culturing the three recombinant strains for three days at 30 °C, haloes were observed around the edge of the clones (Fig.4). We confirmed that CALB expressed and functioned successfully. After being induced with BMMY 120 h, the CALB activities of the three recombinant strains at maximum activity were examined quantitatively (Fig.6). The hydrolytic activity and synthetic activity of recombinant strain GS115/SC3-61/CALB-51, containing the class I hydrophobin SC3, were decreased, but the strain GS115/HFBI-61/CALB-51, containing the class II hydrophobin HFBI appeared the increasing trend, compared with strain GS115/CALB-GCW51. The hydrolytic activities of strain GS115/SC3-61/CALB-51 was 1192 U/g, corresponding to a decrease of 26%, and the strain GS115/HFBI-61/CALB-51 was 2198 U/g, corresponded to an increase of 37%, compared with strain GS115/CALB-GCW51 (1606U/g). The synthetic activities of strain GS115/SC3-61/CALB-51 was 180 U/g, corresponding to a 43% decrease, while that of strain GS115/HFBI-61/CALB-51 was 664U/g, corresponding to an increase of 109%, compared with strain GS115/CALB-GCW51 (180U/g). These results suggest that CALB activity depends on the hydrophobin with which it is co-displayed.
Fig.6.
Analysis of the hydrolytic and synthetic activity of cells co-displaying CALB and hydrophobins on the cell surface. Recombinant cells were induced to display CALB in BMMY medium containing 1% (v/v) methanol for 120 h. The hydrolytic activity was measured using pNPB as the substrate, and the synthetic activity was evaluated by the synthesis of ethyl hexanoate. Data was obtained from three independent experiments.
Finally, we examined the amount of CALB displayed on the surface of the yeast cells to determine the relationship between activity and amount of CALB. The amount of CALB displayed on the surface of strain GS115/CALB-GCW51 was 2.7‰ g/g cell. Both strains GS115/SC3-61/CALB-51 and GS115/HFBI-61/CALB-51 showed a decrease in the amount of displayed CALB, corresponding to 75.2% and 74.4% of the amount present in strain GS115/CALB-GCW51, respectively. This confirmed that co-expression of hydrophobins on the host strain GS115/CALB-GCW51 affected the expression of CALB.
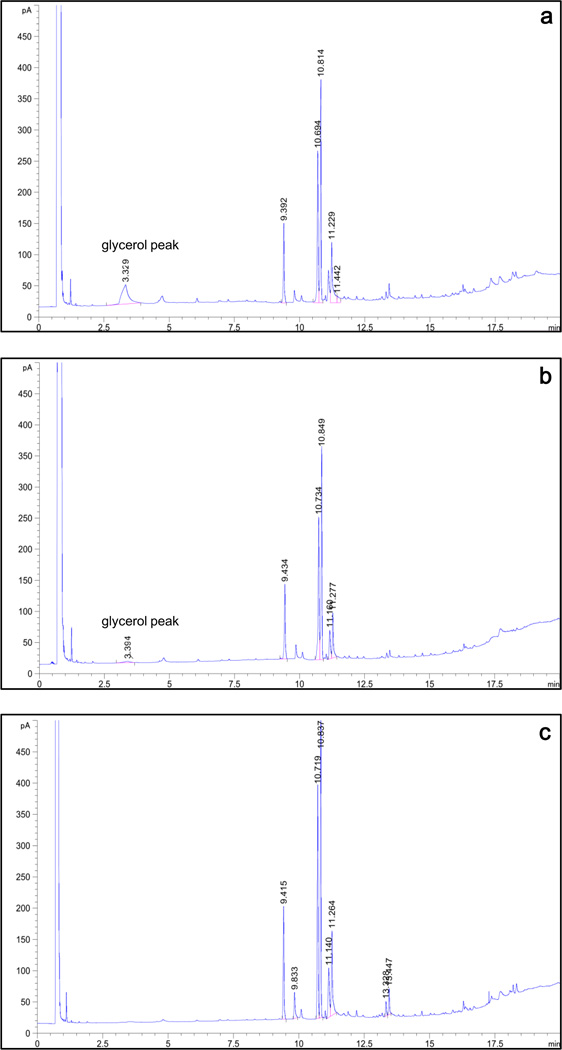
Because the yeast cell wall consists of mannoprotein and β-glucan, the yeast cell surface is relatively hydrophilic. When yeast cells are used as a whole-cell catalyst and reacted in organic solvent, the by-products, such as glycerol, are easily adsorbed on the hydrophilic cell surface. This blocks contact between enzymes and their substrates. During transesterification reactions, a considerable amount of glycerol by-product attached itself to the surface of strain GS115/CALB-GCW51. However, following modification with hydrophobins, the amount of attached glycerol on the cell surface significantly decreased. Strain GS115/SC3-61/CALB-51 showed little adsorption, while glycerol adsorption was completely abolished on the surface of strain GS115/HFBI-61/CALB-51 (Fig.7).
Fig.7.
Analysis of the degree of glycerol adsorption on the surface of recombinant cell with gas chromatography. The recombinant cells used in the transesterification reaction as whole cell catalysts. After the reactions finished, cell were rinsed with tert-butanol to remove the glycerol adsorbed on the cell surface, and then the amount of glycerol was detected. a GS115/CALB-GCW51, b GS115/SC3-61/CALB-51, and c GS115-51/HFBI-61/CALB-51.
Analysis of cell wall structure of recombinant strains co-displaying CALB and hydrophobins
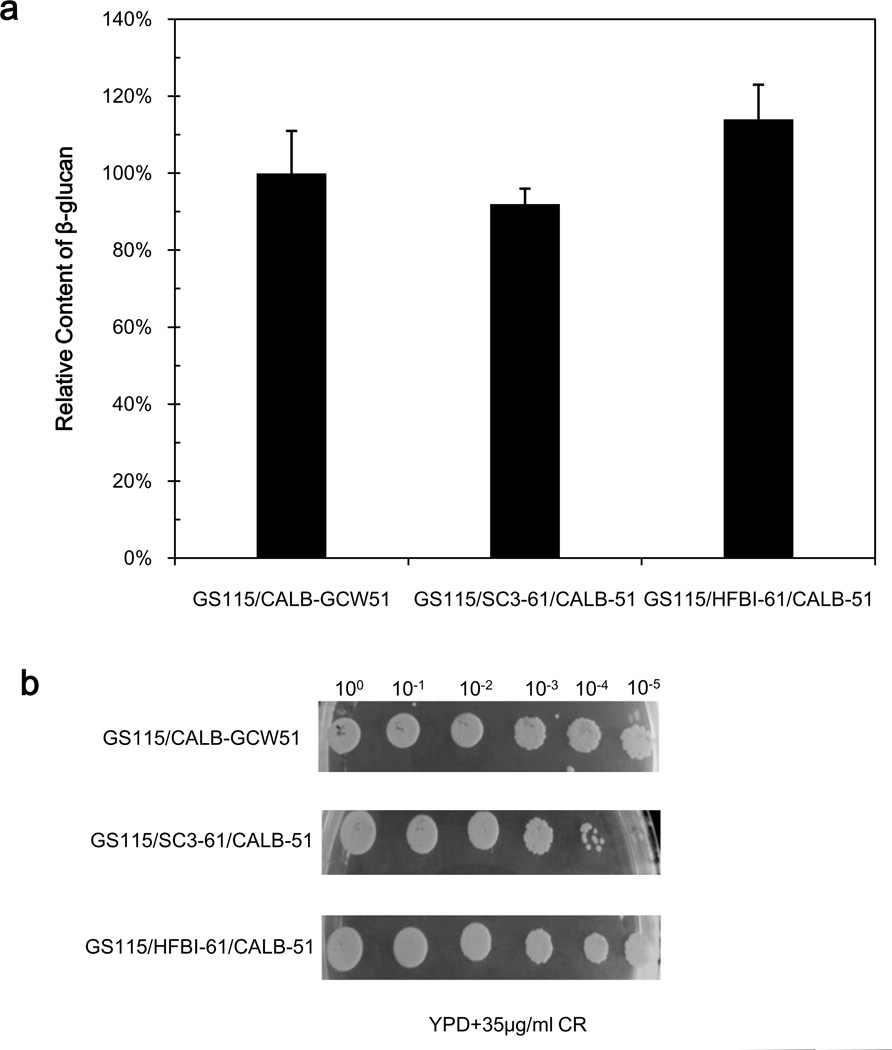
As described above, surface properties varied among the recombinant strains co-displaying CALB and hydrophobins. We examined the phenotypes of the three strains using cell wall-disrupting reagent CR. Strain GS115/SC3-61/CALB-51 exhibited an increased sensitivity to CR (Fig.8b), which suggested a defect in the β-1-3-D-glucan assembly (Kopecká and Gabriel 1992). The amount of cell wall component β-1,3-glucan was further analyzed (Fig.8a). Results showed that strain GS115/SC3-61/CALB-51 had a slightly decreased amount of β-1,3-glucan, only 92% of that of strain GS115/CALB-GCW51. Strain GS115/HFBI-61/CALB-51 was not sensitive to CR, and showed a slight amount increase of cell wall component β-1,3-glucan (114% of the amount present in strain GS115/CALB-GCW51).
Fig.8.
Analysis of recombinant yeast cell wall composition. a Levels of β-1,3-glucan as a percentage of that of strain GS115/CALB-GCW51. b The sensitivity of the three strains to Congo red in YPD medium.
The surface property differences indicate structural differences among the strains. Therefore, TEM was carried out to analyze the cell wall structures of the recombinant strains co-displaying CALB and hydrophobins. As shown in Fig.9, both the cell wall inner layers of the strains GS115/SC3-61/CALB-51 and GS115/HFBI-61/CALB-51 are thicker than that of strain GS115/CALB-GCW51, while the cell wall outer layer of strain GS115/SC3-61/CALB-51 had slightly longer mannan fibrils (Fig.9b and 9e). However, strain GS115/HFBI-61/CALB-51 showed dramatically shorter outer mannan fibrils (Fig.9c and 9f).
Fig.9.
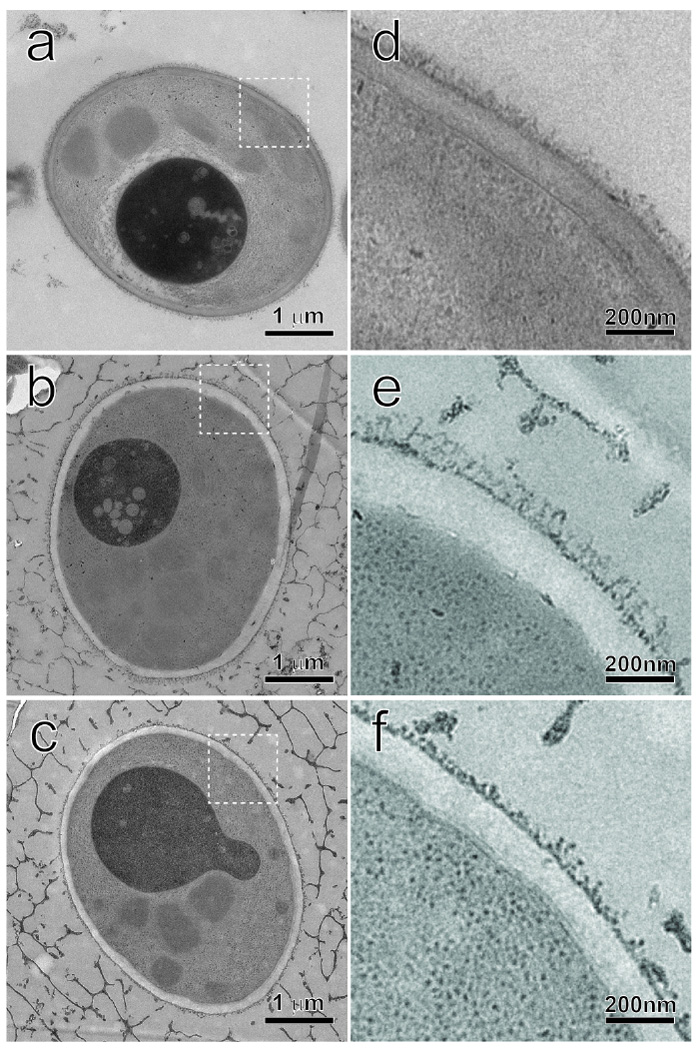
Electron microscopy of the three recombinant yeast strains. The cells were rapidly frozen after methanol induction for 96 h. Following freeze-substitution, infiltration and polymerization, the sample blocks were serially sectioned to a thickness of about 100 nm. The structural preservation is very good as demonstrated in the whole-cell micrographs in a GS115/CALB-GCW51, b GS115/SC3-61/CALB-51, and c GS115-51/HFBI-61/CALB-51. The cell wall regions, marked by the dash-line squares in the left figure column, are further magnified in d GS115/CALB-GCW51, e GS115/SC3-61/CALB-51 and f GS115-51/HFBI-61/CALB-51, respectively. The difference of the inner layers and the outer mannan fibrils are visible among the three strains.
Discussion
Because of their amphiphilic nature and self-assembly properties, free hydrophobins have been used as emulsifiers in food processing and surfactants, as well as in surface coating and enzyme immobilization, and may have future applications in nanotechnology. They have even been used as indicators for beer gushing (Scholtmeijer et al. 2001; Wessels 1997). In this study, we attempted to modify the cell surface hydrophobicity of P. pastoris and improve the activity of CALB displayed on the yeast cell surface by co-displaying hydrophobins SC3 and HFBI.
Based on their characteristics and sequence analysis, hydrophobins have been grouped into two main classes: class I and class II. Overall, the two classes share similar structural properties, but they differ in the way in which they form assembled structures, and consequently show differences in the properties of these structures. Class II hydrophobins have only been identified in Ascomycetes, while class I hydrophobins are present in both Basidiomycetes and Ascomycetes species. In class II hydrophobins, hydrophobic amino acids follow the cysteine doublets, while the cysteine doublets are followed by hydrophilic amino acids in class I hydrophobins (Wessels 1997). Therefore, less variation is seen in the cysteine spacing of class II hydrophobins than in class I (Kershaw and Talbot 1998). Class II hydrophobins form 2D crystalline films on the air-water interface but do not show rodlet structures (Kisko et al. 2008).
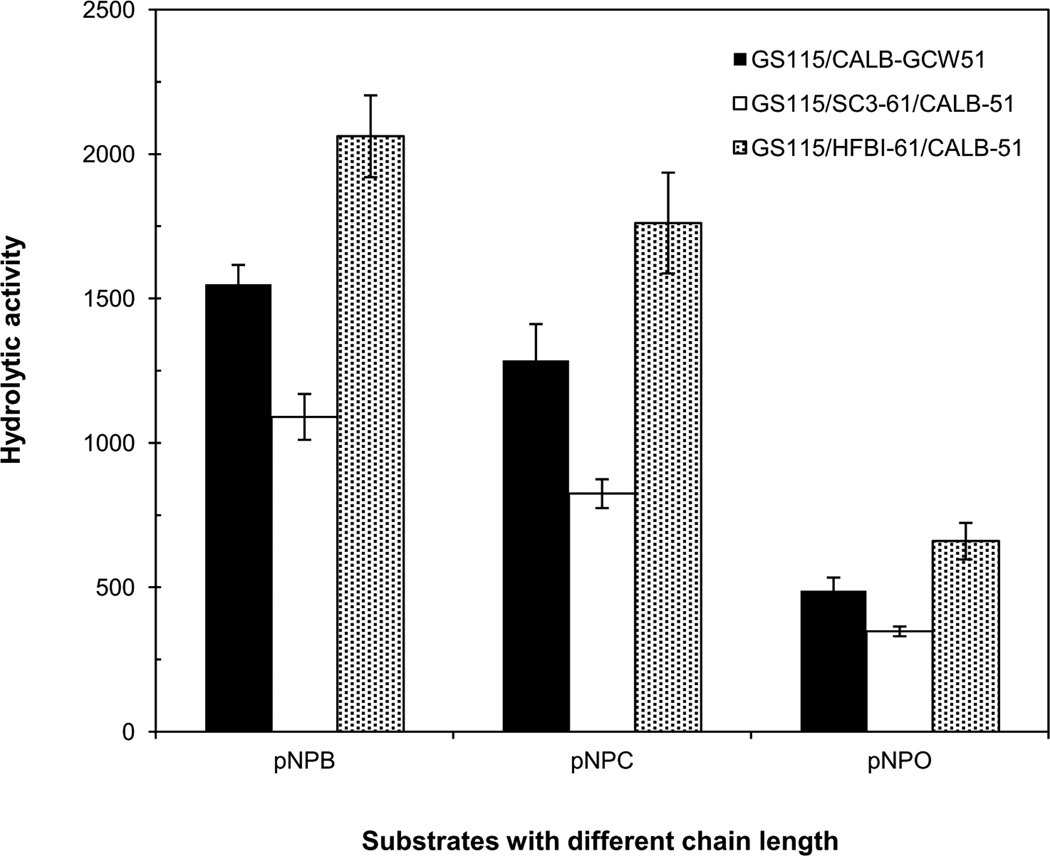
The class II hydrophobin HFBI from T.reesei has a compact globular fold with many of the aliphatic hydrophobic side chains collected in one patch on the surface. The patch comprises about 18% of the surface area, and leads to an amphiphilic structure (Kallio et al. 2007). Thus, HFBI from T.reesei was chosen for display on the cell surface of P. pastoris in the current study. Our findings showed a stronger interface activity and hydrophobicity between n-butyl alcohol and water in strain displaying HFBI, as shown in Fig.2a. The results confirmed that amphiphilic hydrophobins can interact with surfaces and lower surface tension. Importantly, display of HFBI improved the hydrolytic and synthetic activity of CALB on the cell surface of P. pastoris (Fig. 6). Palomo et al. bound Pleurotus ostreatus hydrophobins to a hydrophilic glyoxyl-agarose, and then immobilized lipase on the modified agarose. They verified that the lipase was mediated by the bound hydrophobin, and the open lid is the active form, which exposes hydrophobic patches on the lipase surface. It was suggested that an “interfacial activation” mechanism of hydrophobins on lipase may exist (Palomo et al. 2003), because the internal face of the lid and the surroundings of the active center existed in CALB (Sarda and Desnuelle 1958). When lipases are immobilized on yeast cells surface, it was suggested that the mechanism can be similar to the immobilization on other hydrophobic carriers, i.e., by interfacial activation of the lipase through interaction of the hydrophobic surfaces (Linder et al. 2005). Recently, Stauch et al observed the lid open and closed conformations of CALB at atomic resolution (Stauch et al. 2015). Manoel et al immobilized lipase on hydrophobic octyl agarose and confirmed that the open form of the lipase became stabilized after adsorption, and its maintenance was no longer dependent on the medium conditions (Manoel et al. 2015). We inferred that the hydrophobic environment caused by HFBI made the conformations of co-displaying CALB open, and finally the activities of CALB increased. To further indicate the conformations of CALB, we explored the effect of different substrates on the activities of CALB, such as p-nitrophenyl butyrate (pNPB), p-nitrophenyl caproate (pNPC) and p-nitrophenol octanoate (pNPO) (Fig.10). Among the three substrates, they all presented the same trend of lipase activities compared with the strain GS115/CALB-GCW51. The optimal substrate was pNPB, and the carbon chain length of substrate pNPO could affect it access to the active site. We thought that CALB kept the stable conformations after modification with hydrophobins, because different chain length of substrates accessed into the CALB showed different activities. The hydrophobin HFBI promoted the conformations and interfacial activation of CALB, which also seem to be propitious to longer chain substrates than that of GS115/SC3-61/CALB-51 and GS115/CALB-GCW51. The results were alike with the report from Zisis (Zisis et al. 2015).
Fig.10.
Analysis of the hydrolytic activity of cells co-displaying CALB with different substrates. The three substrates were p-nitrophenyl butyrate (pNPB), p-nitrophenyl caproate (pNPC) and p-nitrophenol octanoate (pNPO), respectively. The methods were the same as analysis of CALB hydrolytic activity with pNPB. Data was obtained from three independent experiments.
The Class I hydrophobin SC3, self-assembles at the aerial hyphae surface, and forms a protein membrane constituting the hydrophobic rodlet layer (Wösten et al. 1994a). All hydrophobins contain eight cysteines that form four disulfide bonds in the pattern Cys1-Cys6, Cys2-Cys5, Cys3-Cys4, Cys7- Cys8. Unlike class II hydrophobins, the Cys3-Cys4 loop of SC3 varies considerably in length (Kwan et al. 2006). Usually, class I hydrophobins have highly characteristic structures, named rodlets, and can form highly insoluble membranes in water, organic solvents, and 2% SDS. In the present study, SC3 from S. commune was displayed on the yeast cell surface, maintaining relative hydrophobicity (Fig.2), and formed an active interface between water and the organic solvent. Although SC3 has excellent surface activity, this activity was reduced when the level of surface expression was decreased. In addition, the SC3 displayed on the surface of the cells was not found in the typical rodlet structures, but had longer outer mannan fibrils (Fig.9b). In solution, hydrophobins behave in a way that resembles typical surfactants, forming different types of aggregates in a concentration-dependent manner. We therefore suggest that in the current study, the amount of SC3 displayed on the cell surface was not sufficient to form the typical rodlet structure. Unfortunately, co-displaying SC3 and CALB decreased both the hydrolytic and synthetic activities of CALB.
We also compared the amount of CALB displayed on the surfaces of strains GS115/SC3-61/CALB-51 and GS115/HFBI-61/CALB-51 with that of strain GS115/CALB-GCW51. Strains GS115/SC3-61/CALB-51 and GS115/HFBI-61/CALB-51 displayed 75.2% and 74.4%, respectively, of the amount of CALB displayed by the control strain. Therefore, co-display of hydrophobins decreased the amount of CALB on the yeast cell surface. However, the hydrolytic and synthetic activities of CALB on the surface of GS115/HFBI-61/CALB-51 cells were increased by 30% and 109%, respectively, compared with GS115/CALB-GCW51. In contrast, the hydrolytic and synthetic activities of strain GS115/CALB-51/SC3-61 decreased by 26% and 43%, respectively, compared with the control strain. Combined with the changes of cell wall structure and adsorption of glycerol to cell surface, it indicates that co-display of hydrophobin mainly affects the structure of the yeast cell surface and the microenvironment surrounding CALB. The hydrophobin gene expression affecting the hyphal cell wall structure was also exist in Schizophyllum commune. The amount of water-soluble (1–3) β-glucan and alkali-resistant glucan were changed (Wetter and Han 2000). In addition, the kinetic parameter Km of CALB display on strain GS115/HFBI-61/CALB-51 was 34 mM, compared with 54 mM for strain GS115/CALB-GCW51. These data illustrate that the increase in affinity between substrate and CALB observed in strain GS115/HFBI-61/CALB-51 likely led to the increase in hydrolytic and synthetic activities. Strain GS115/SC3-61/CALB-51 showed an increased Km (72mM), consistent with the decreased CALB activities. From this, we inferred that the affinity between substrate and CALB was weakened following modification with hydrophobin SC3. Espino-Rammer et al. reported that when fused with glutathione S-transferase, the class II hydrophobins HFB4 and HFB7 showed subtle differences in structure, and the hydrophobicity plots were correlated with unequal hydrophilicity and hydrophobicity (Espino-Rammer et al. 2013). They also concluded that HFB4 can stimulate enzymatic hydrolysis of PET by fungal cutinase. Chen et al. also showed that lipase activity was associated with the hydrophobicity of the immobile surface (Chen et al. 2008).
To summarize, surface display of fungal hydrophobins SC3 and HFBI successfully modified the hydrophobicity of the surface of P. pastoris cells. The hydrolytic and synthetic activities of CALB were affected by SC3 and HFBI in a different manner when co-displayed on the cell surface. Recombinant strain GS115/HFBI-61/CALB-51 showed favorable catalytic activity compared with the control. The cell wall characterizations for these recombinant strains suggested that changes to the microenvironment are caused by display of the hydrophobins, which affected the activity of CALB. We therefore confirmed that hydrophobin HFBI from T. reesei can improve the hydrophobicity of the yeast cell surface, and increase the catalytic activity of CALB.
Supplementary Material
Acknowledgments
The authors thank Mr. Shufeng Sun and Mrs. Rebecca Fisher at the Wadsworth Center for their assistance in yeast cell growth, specimen preparation and electron microscopy. M.R. participated in the work under the support of the Wadsworth Center’s Research Experience for Undergraduates (REU) program grant DBI1062963 from the National Science Foundation (NSF). This work was supported in whole by the grants to Ying Lin, the National Natural Science Foundation of China (31170031), the China National High Technology Research and Development Program (863-2012AA022205), and High Technology Research and Development of Guangdong Province (2012A080800013), and in part by the National Institutes of Health (NIH) grants GM101026 and GM097010 to Haixin Sui.
Footnotes
Compliance with ethical standards
This article does not contain any studies with human participants or animals by any of the authors.
Conflict of interest
The authors declare that they have no conflict of interest.
References
- Bastida A, Sabuquillo P, Armisen P, Fernandez-Lafuente R, Huguet J, Guisan JM. A single step purification, immobilization, and hyperactivation of lipases via interfacial adsorption on strongly hydrophobic supports. Biotechnol Bioeng. 1998;58(5):486–493. doi: 10.1002/(sici)1097-0290(19980605)58:5<486::aid-bit4>3.0.co;2-9. [DOI] [PubMed] [Google Scholar]
- Brzozowski A, Derewenda U, Derewenda Z, Dodson G, Lawson D, Turkenburg J, Bjorkling F, Huge-Jensen B, Patkar S, Thim L. A model for interfacial activation in lipases from the structure of a fungal lipase-inhibitor complex. Nature. 1991;351(6326):491–494. doi: 10.1038/351491a0. [DOI] [PubMed] [Google Scholar]
- Chen B, Pernodet N, Rafailovich MH, Bakhtina A, Gross RA. Protein immobilization on epoxy-activated thin polymer films: effect of surface wettability and enzyme loading. Langmuir. 2008;24(23):13457–13464. doi: 10.1021/la8019952. [DOI] [PubMed] [Google Scholar]
- Espino-Rammer L, Ribitsch D, Przylucka A, Marold A, Greimel KJ, Acero EH, Guebitz GM, Kubicek CP, Druzhinina IS. Two novel class II hydrophobins from Trichoderma spp. stimulate enzymatic hydrolysis of poly (ethylene terephthalate) when expressed as fusion proteins. Appl Environ Microb. 2013;79(14):4230–4238. doi: 10.1128/AEM.01132-13. [DOI] [PMC free article] [PubMed] [Google Scholar]
- Hama S, Yoshida A, Nakashima K, Noda H, Fukuda H, Kondo A. Surfactant-modified yeast whole-cell biocatalyst displaying lipase on cell surface for enzymatic production of structured lipids in organic media. Appl Microbiol Biot. 2010;87(2):537–543. doi: 10.1007/s00253-010-2519-1. [DOI] [PubMed] [Google Scholar]
- Jaeger K-E, Eggert T. Lipases for biotechnology. Curr Opin Biotech. 2002;13(4):390–397. doi: 10.1016/s0958-1669(02)00341-5. [DOI] [PubMed] [Google Scholar]
- Jensen BG, Andersen MR, Pedersen MH, Frisvad JC, Søndergaard I. Hydrophobins from Aspergillus species cannot be clearly divided into two classes. BMC Res Notes. 2010;3(1):344. doi: 10.1186/1756-0500-3-344. [DOI] [PMC free article] [PubMed] [Google Scholar]
- Jin Z, Han S-Y, Zhang L, Zheng S-P, Wang Y, Lin Y. Combined utilization of lipase-displaying Pichia pastoris whole-cell biocatalysts to improve biodiesel production in co-solvent media. Bioresource Technol. 2013;130:102–109. doi: 10.1016/j.biortech.2012.12.020. [DOI] [PubMed] [Google Scholar]
- Jin Z, Ntwali J, Han S-Y, Zheng S-P, Lin Y. Production of flavor esters catalyzed by CALB-displaying Pichia pastoris whole-cells in a batch reactor. J Biotechnol. 2012;159(1):108–114. doi: 10.1016/j.jbiotec.2012.02.013. [DOI] [PubMed] [Google Scholar]
- Jin Z, Zhang K, Zhang L, Zheng S-P, Han S-Y, Lin Y. Quantification analysis of yeast-displayed lipase. Anal Biochem. 2014;450:46–48. doi: 10.1016/j.ab.2013.12.035. [DOI] [PubMed] [Google Scholar]
- Kallio JM, Linder MB, Rouvinen J. Crystal structures of hydrophobin HFBII in the presence of detergent implicate the formation of fibrils and monolayer films. J Biol Chem. 2007;282(39):28733–28739. doi: 10.1074/jbc.M704238200. [DOI] [PubMed] [Google Scholar]
- Kershaw MJ, Talbot NJ. Hydrophobins and repellents: proteins with fundamental roles in fungal morphogenesis. Fungal Genet Biol. 1998;23(1):18–33. doi: 10.1006/fgbi.1997.1022. [DOI] [PubMed] [Google Scholar]
- Kisko K, Szilvay GR, Vuorimaa E, Lemmetyinen H, Linder MB, Torkkeli M, Serimaa R. Self-assembled films of hydrophobin proteins HFBI and HFBII studied in situ at the air/water interface. Langmuir. 2008;25(3):1612–1619. doi: 10.1021/la803252g. [DOI] [PubMed] [Google Scholar]
- Kopecká M, Gabriel M. The influence of congo red on the cell wall and (1 → 3)-β-d-glucan microfibril biogenesis in Saccharomyces cerevisiae. Arch Microbiol. 1992;158(2):115–126. doi: 10.1007/BF00245214. [DOI] [PubMed] [Google Scholar]
- Kwan A, Winefield R, Sunde M, Matthews J, Haverkamp R, Templeton M, Mackay J. Structural basis for rodlet assembly in fungal hydrophobins. P Natl Acad Sci USA. 2006;103(10):3621–3626. doi: 10.1073/pnas.0505704103. [DOI] [PMC free article] [PubMed] [Google Scholar]
- Linder MB. Hydrophobins: proteins that self assemble at interfaces. Curr Opin Colloid In. 2009;14(5):356–363. [Google Scholar]
- Linder MB, Szilvay GR, Nakari-Setälä T, Penttilä ME. Hydrophobins: the protein-amphiphiles of filamentous fungi. FEMS microbiol Rev. 2005;29(5):877–896. doi: 10.1016/j.femsre.2005.01.004. [DOI] [PubMed] [Google Scholar]
- Littlejohn KA, Hooley P, Cox PW. Bioinformatics predicts divers Aspergillus hydrophobins with novel properties. Food Hydrocolloid. 2012;27(2):503–516. [Google Scholar]
- Manoel EA, dos Santos JC, Freire DM, Rueda N, Fernandez-Lafuente R. Immobilization of lipases on hydrophobic supports involves the open form of the enzyme. Enzyme Microb Tech. 2015;71:53–57. doi: 10.1016/j.enzmictec.2015.02.001. [DOI] [PubMed] [Google Scholar]
- Matsumoto T, Fukuda H, Ueda M, Tanaka A, Kondo A. Construction of yeast strains with high cell surface lipase activity by using novel display systems based on the Flo1p flocculation functional domain. Appl Environ Microb. 2002;68(9):4517–4522. doi: 10.1128/AEM.68.9.4517-4522.2002. [DOI] [PMC free article] [PubMed] [Google Scholar]
- McDonald KL, Webb RI. Freeze substitution in 3 hours or less. J Microsc Oxford. 2011;243(3):227–233. doi: 10.1111/j.1365-2818.2011.03526.x. [DOI] [PubMed] [Google Scholar]
- Nakari-Setälä T, Azeredo J, Henriques M, Oliveira R, Teixeira J, Linder M, Penttilä M. Expression of a fungal hydrophobin in the Saccharomyces cerevisiae cell wall: effect on cell surface properties and immobilization. Appl Environ Microb. 2002;68(7):3385–3391. doi: 10.1128/AEM.68.7.3385-3391.2002. [DOI] [PMC free article] [PubMed] [Google Scholar]
- Palomo JM, Peñas MM, Fernández-Lorente G, Mateo C, Pisabarro AG, Fernández-Lafuente R, Ramírez L, Guisán JM. Solid-phase handling of hydrophobins: immobilized hydrophobins as a new tool to study lipases. Biomacromolecules. 2003;4(2):204–210. doi: 10.1021/bm020071l. [DOI] [PubMed] [Google Scholar]
- Sarda L, Desnuelle P. Actions of pancreatic lipase on esters in emulsions. BBA-Biomembranes. 1958;30(3):513. doi: 10.1016/0006-3002(58)90097-0. [DOI] [PubMed] [Google Scholar]
- Séverac E, Galy O, Turon F, Pantel CA, Condoret J-S, Monsan P, Marty A. Selection of CalB immobilization method to be used in continuous oil transesterification: analysis of the economical impact. Enzyme Microb Tech. 2011;48(1):61–70. doi: 10.1016/j.enzmictec.2010.09.008. [DOI] [PubMed] [Google Scholar]
- Schilke KF, Kelly C. Activation of immobilized lipase in non-aqueous systems by hydrophobic poly-DL-tryptophan tethers. Biotechnol Bioeng. 2008;101(1):9–18. doi: 10.1002/bit.21870. [DOI] [PMC free article] [PubMed] [Google Scholar]
- Scholtmeijer K, Wessels J, Wösten H. Fungal hydrophobins in medical and technical applications. Appl Microbiol Biot. 2001;56(1–2):1–8. doi: 10.1007/s002530100632. [DOI] [PubMed] [Google Scholar]
- Sekiya-Kawasaki M, Abe M, Saka A, Watanabe D, Kono K, Minemura-Asakawa M, Ishihara S, Watanabe T, Ohya Y. Dissection of upstream regulatory components of the Rho1p effector, 1, 3-β-glucan synthase, in Saccharomyces cerevisiae. Genetics. 2002;162(2):663–676. doi: 10.1093/genetics/162.2.663. [DOI] [PMC free article] [PubMed] [Google Scholar]
- Stauch B, Fisher SJ, Cianci M. Open and closed states of Candida antarctica lipase B: protonation and the mechanism of interfacial activation. J Lipid Res. 2015;56(12):2348–2358. doi: 10.1194/jlr.M063388. doi: [DOI] [PMC free article] [PubMed] [Google Scholar]
- Su G-D, Huang D-F, Han S-Y, Zheng S-P, Lin Y. Display of Candida antarctica lipase B on Pichia pastoris and its application to flavor ester synthesis. Appl Microbiol Biot. 2010;86(5):1493–1501. doi: 10.1007/s00253-009-2382-0. [DOI] [PubMed] [Google Scholar]
- Sun SY, Xu Y. Solid-state fermentation for whole-cell synthetic lipase production from Rhizopus chinensis and identification of the functional enzyme. Process Biochem. 2008;43(2):219–224. [Google Scholar]
- Sun Y-F, Lin Y, Zhang J-H, Zheng S-P, Ye Y-R, Liang X-X, Han S-Y. Double Candida antarctica lipase B co-display on Pichia pastoris cell surface based on a self-processing foot-and-mouth disease virus 2A peptide. Appl Microbiol Biot. 2012;96(6):1539–1550. doi: 10.1007/s00253-012-4264-0. [DOI] [PubMed] [Google Scholar]
- Tweddell RJ, Kermasha S, Combes D, Marty A. Immobilization of lipase from Rhizopus niveus: a way to enhance its synthetic activity in organic solvent. Biocatal Biotransfor. 1999;16(6):411–426. [Google Scholar]
- Van der Vegt W, Van der Mei H, Wösten H, Wessels J, Busscher H. A comparison of the surface activity of the fungal hydrophobin SC3p with those of other proteins. Biophys Chem. 1996;57(2):253–260. doi: 10.1016/0301-4622(95)00059-7. [DOI] [PubMed] [Google Scholar]
- Wösten H, Asgeirsdottir S, Krook J, Drenth J, Wessels J. The fungal hydrophobin Sc3p self-assembles at the surface of aerial hyphae as a protein membrane constituting the hydrophobic rodlet layer. Eur J Cell Biol. 1994a;63(1):122–129. [PubMed] [Google Scholar]
- Wösten H, Schuren F, Wessels J. Interfacial self-assembly of a hydrophobin into an amphipathic protein membrane mediates fungal attachment to hydrophobic surfaces. EMBO J. 1994b;13(24):5848–5854. doi: 10.1002/j.1460-2075.1994.tb06929.x. [DOI] [PMC free article] [PubMed] [Google Scholar]
- Wessels JG. Hydrophobins: proteins that change the nature of the fungal surface. Adv Microb Physiol. 1997;38(38):1–45. doi: 10.1016/s0065-2911(08)60154-x. [DOI] [PubMed] [Google Scholar]
- Wetter MAV, Han ABWHS. Hydrophobin gene expression affects hyphal wall composition in Schizophyllum commune. Fungal Genet Biol. 2000;31(2):99–104. doi: 10.1006/fgbi.2000.1231. [DOI] [PubMed] [Google Scholar]
- Wosten HA, De Vries OM, Wessels JG. Interfacial self-assembly of a fungal hydrophobin into a hydrophobic rodlet layer. Plant Cell. 1993;5(11):1567–1574. doi: 10.1105/tpc.5.11.1567. [DOI] [PMC free article] [PubMed] [Google Scholar]
- Zhang L, Liang S, Zhou X, Jin Z, Jiang F, Han S, Zheng S, Lin Y. Screening for glycosylphosphatidylinositol-modified cell wall proteins in Pichia pastoris and their recombinant expression on the cell surface. Appl Environ Microb. 2013;79(18):5519–5526. doi: 10.1128/AEM.00824-13. [DOI] [PMC free article] [PubMed] [Google Scholar]
- Zisis T, Freddolino PL, Turunen P, van Teeseling MC, Rowan AE, Blank KG. Interfacial activation of Candida antarctica lipase B: combined evidence from experiment and simulation. Biochemistry. 2015;54(38):5969–5979. doi: 10.1021/acs.biochem.5b00586. [DOI] [PMC free article] [PubMed] [Google Scholar]
Associated Data
This section collects any data citations, data availability statements, or supplementary materials included in this article.


