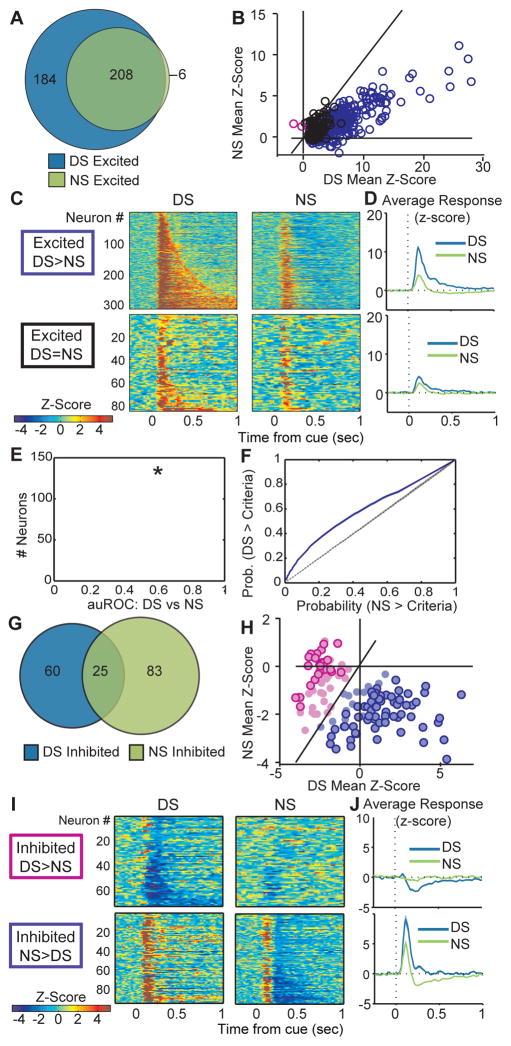
Figure 2. VP neurons are more excited by the DS than the NS.
A, Venn diagram showing that of the 392 neurons excited by the DS, 214 are also excited by the NS. B, Scatterplot of normalized (as z-score) responses to the NS versus the DS, showing neurons that repond significantly more to the DS (purple) or the NS (pink). C, Heat maps of responses to the DS (left) and NS (middle) split into neurons that respond significantly more to the DS than the NS (top), and neurons that do not respond significantly differently to the DS versus the NS (bottom). Each line represents the PSTH of an individual neurons, normalized and color-coded. Within each category, neurons are sorted by response to the NS. D, Average responses to the DS (blue) and NS (green) as grouped in C. E, Histogram of the area under the receiver-operating characteristic (auROC) curve, for the analysis of firing in the DS and NS analysis windows; the population average is indicated in red, and the dotted line shows the average control auROC (* = p<0.001). D, Average ROC curve for the whole population for predicting the DS versus NS (purple line; shading depicts standard error) and the control analysis comparing two baseline windows (dotted black line). G, Venn diagram showing neurons inhibited by the DS (85), and NS (108) are only semi-overlapping. H, Scatterplot of normalized (as z-score) responses to the NS versus the DS, showing neurons that are significantly more inhibited following the DS (dark pink outline) or the NS (dark purple outline). I, Heat maps of responses to the DS (top) and NS (bottom) split into neurons that are more inhibited by the DS than the NS (left; pink centers in H), or more inhibited by the NS than the DS (right; purple centers in H). Each line represents the PSTH of an individual neurons, normalized and color-coded. Within each category, neurons are sorted by response to the NS. J, Average responses to the DS (blue) and NS (green) as grouped n I.

