Abstract
We present details on the alignment and calibration of a goniometer assembly consisting two stacked, optically encoded, vertical axis rotation stages. A technique for its calibration is presented that utilizes a stable, uncalibrated, third stage to position a mirror in conjunction with a nulling autocollimator. Such a system provides a self-calibrating set of angular stages with absolute accuracy of ±0.1 second of plane angle (k=2 expanded uncertainty) around the full circle, suitable for laboratory application. This calibration technique permits in situ, absolute angular calibration of an operational goniometer assembly that is requisite for fully traceable angle measurement, as the installation of the encoder is known to change its performance from the angular calibration data provided by the manufacturer.
I. INTRODUCTION
The National Institute of Standards and Technology provides a suite of Standard Reference Materials (SRMs) for calibration of diffraction measurements and equipment. While powder diffraction can provide information on a multitude of sample characteristics, the ubiquitous measurement issue is that of diffraction line position. This corresponds to the measurement of the crystallographic lattice parameters in a manner that is traceable to the Système Internationale (SI) via Bragg’s law: λ = 2d sinθ. Bragg’s law relates the wavelength of the X-rays used in the experiment, λ, to the hkl lattice spacing, d, of the sample; the sample may be either in the form of a powder or a single crystal. In order to establish SI traceability, the lattice spacing of well characterized reference crystals is established via X-ray / Optical interferometry [1, 2]. These crystals are used in a double crystal diffraction experiment to yield an SI traceable characterization of the x-ray emission spectrum of a given element. Lastly, the powder sample is characterized using the known spectrum, yielding the desired SRM certified with respect to lattice parameters. Both the characterization of the emission spectrum and the powder measurements require a dual, concentric axes goniometer for which a self calibrating angle measurement verification procedure has been conducted. Therefore; a procedure for calibration of a goniometer assembly suitable for use in laboratory setting, with a minimum impact on it’s angular measurement application, is needed.
Laboratory goniometers typically utilize a worm and ring gear arrangement to achieve the rotational motion, with an optical encoder to measure the rotation angle. The use of optical encoders to provide absolute angular calibration of goniometer stages is well established [3–5]. There is a long history of calibrating such stages by methods known either as “circle closure” or “cross calibration” [3, 6–9, e.g.]. The highest precision stage yet realized, described in [7], is a purpose-built angular calibration system, and not suitable in our application. Optical encoders are typically provided with specifications of their angular accuracy, as measured by the manufacturer under reasonable conditions. This accuracy is typically guaranteed only if the encoder is installed correctly, but this statement is essentially circular; if it doesn’t meet specifications, it is probably installed incorrectly. Therefore, one must have an independent in situ method to demonstrate the accuracy of the measurement. Furthermore, it is well known that the manufacturer’s specifications for the accuracy of the encoder are worst-case bounds on long-period periodic errors which we show to be temporally stable; therefore, quantification of these long-range errors will yield an angle measurement accuracy superior to the manufacturer’s original specifications.
This particular work presents a method for calibrating a set of stacked, concentric goniometer stages, using no fixed angular artifact, such as an optical polygon. Through the use of a third, uncalibrated, annular stage, system calibration can be carried out with minimal disruption to the functioning goniometer, so it can be checked easily at a time close to when the system is being applied to a real experiment, to assure the integrity of its angular results. This technique does not require custom optical encoders to function correctly. We present an updated look at the mathematics, and the requirements of how angles should be sampled so as to verify short-range “compensation” corrections while measuring the long-range errors. We also present details of the methods of aligning and balancing such a system so that it can attain the expected angular measurement accuracy. Such a system could either consist of 2 precision stages, with a third, uncalibrated stage on top of it, or three or more precision stages. We specifically discuss the first case, but the method could be easily extended to an arbitrary stack of stages.
II. APPARATUS AND TECHNIQUE
A. Diffractometer stages
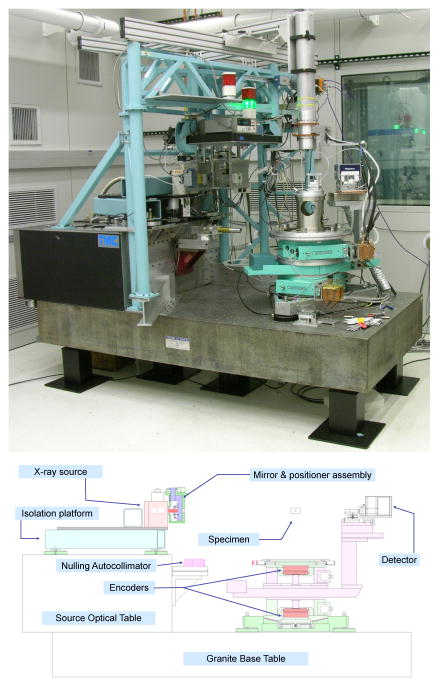
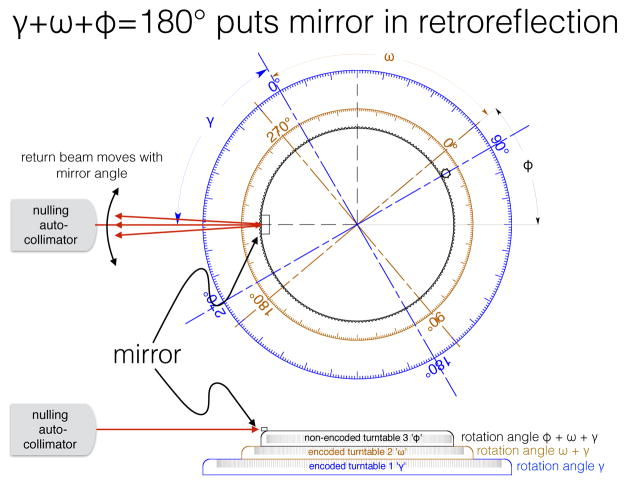
The diffractometer system we describe consists of two Huber 4301 rotation stages, with embedded Heidenhain RON905 angular encoders read out by Heidenhain EIB741 interpolation electronics. The upper stage typically carries the sample (or the first crystal in a double-crystal experiment); the lower stage typically carries the X-ray analyzer (or the second crystal in a double-crystal system) and the X-ray detector. On top of these two encoded, precision stages is an annular third stage which is driven a simple un-encoded spur / ring gear arrangement and uses six air brakes in conjunction with a flexural structure to lock the stage to the top of the one below it; this prevents drift while measurements are being performed. It is through this third stage that we are able to fully calibrate the angular scales of the two high-precision stages without resorting to any external artifact, such as an optical polygon, and without de-mounting any sample stage which may be installed at the time of the calibration. Figure 1 shows a photograph and overall schematic of the system; figure 2 shows a schematic of the definitions of the goniometer stage angles γ, ω, and ϕ. This system rests upon a 30cm thick granite table, in a space which is temperature controlled to a stability better than 0.01°C. The stages are driven by 5-phase Oriental Motor stepper motors that are water cooled. This cooling minimizes thermally induced motion of the mirror and thermally induced shimmer in the autocollimator beam from warm air rising from the upper motor when it moves under the autocollimator beam path. The drive is discussed in more detail in [10].
Figure 1.
Photograph of complete system and general schematic.
Figure 2.
Schematic of stages as configured for circle closure
B. Nulling autocollimator
A nulling autocollimator is a device which very precisely indicates when an optical beam it emits through a fine slit is reflected back on the same slit via a mirror attached to a system which is being analyzed. The particular feature of this device is that it only measures a null angle, so as long as it can do this repeatedly, it allows very precise resetting of an external mirror to a specific angle. The newest NIST nulling autocollimator has been recently documented [5]. For the purposes of the measurements described below, we operate it as follows:
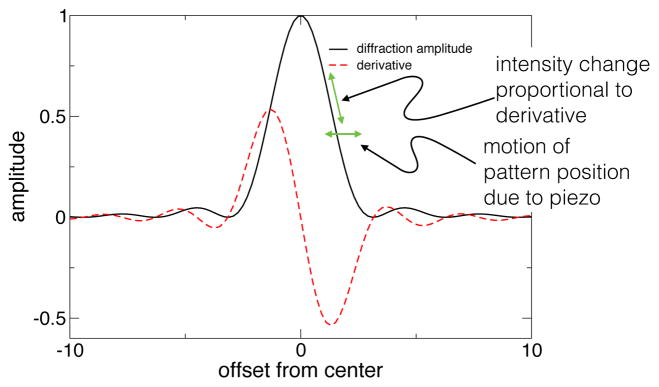
The piezoelectric crystal of the autocollimator is driven directly with a 1V sinusoidal signal at a frequency of 1kHz from a Stanford Research Systems model 830 lock-in amplifier. This creates a modulation of angle which is narrower than the width of the optical diffraction pattern of the source slit, which results in the modulation creating a signal proportional to the derivative of the intensity of the diffraction pattern. This frequency is chosen higher than the 100Hz that was used in [5], so that the diffraction pattern can be swept over fairly quickly without coupling between the proper modulation and the intensity variation from the sweeping of the pattern.
The autocollimator output is coupled to the lock-in through a high-pass RC filter with a −3dB frequency around 10Hz. This eliminates a large dynamic signal on the front end of the lock-in when the diffractometer is sweeping the beam up the side of the diffraction pattern.
The lock-in amplifier is set to detect the in-phase component of the intensity from the autocollimator. This is the appropriate phase for derivative detection. The detected signal amplitude peaks at about 10mV with a noise floor around 10μV.
A schematic of the signals from the system is shown in figure 3. A sample of modeled signals from such a system illustrates how the nulling autocollimator interacts with its drive and detection electronics, while a mirror swings across its field of view. The single-slit diffraction pattern intensity from the source slit, which is collimated by a lens, reflected from the target mirror, and re-imaged on the slit by the same lens, is given by:
| (1) |
where jn is the spherical Bessel function of order n, and is mathematically more convenient to differentiate than the explicit ratio and I0 is the peak intensity. If the piezoelectric mirror is being moved sinusoidally at frequency f and amplitude ε, and the retroreflecting mirror is moving at angular speed v, then the full, time-dependent signal I(t) seen by the detector will be
Figure 3.
Diffraction pattern and derivative as seen by nulling autocollimator
| (2) |
Note the extra factor of 2 in the 2 vt term; the beam angle from a mirror moves twice the mirror angle itself. If αε ≪ 1, this expands to:
| (3) |
The detected signal voltage V(t) from the lock-in comes from the second term, and is:
| (4) |
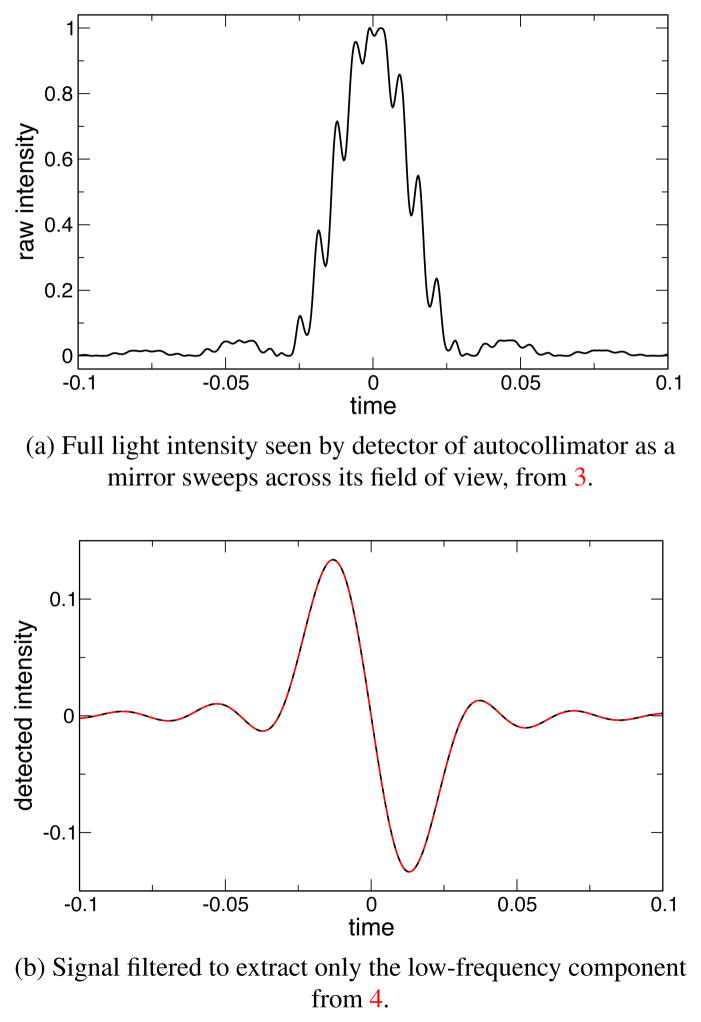
In figure 4a we display the diffraction pattern crossing the detector as a result of the combined slewing of the mirror and the sinusoidal wobble of the piezoelectric mirror mount in the autocollimator. One can see that the period of the wobble is short compared to the transit time of the diffraction pattern; this is necessary to achieve a stable measure of the zero crossing. The modulation is from the second term of 3. A detailed analysis shows that having at least 5 full cycles over the first lobe of the diffraction pattern is sufficient. The lock-in amplifier extracts, by filtering, the portion containing cos2π f t, according to 4, and the result of such filtering is shown in figure 4b.
Figure 4.
Processing of signals through autocollimator electronics (simulation).
III. DATA COLLECTION AND ANALYSIS
The method we describe is an extension of the techniques of [4, 5]. The procedure is:
set the third stage to an angle, ϕn, which will be selected from various points spanning a full circle. Typically about 10 positions are used. The stage is then clamped with its air brake, and allowed to settle for about 10 seconds. At this point in the experiment, there is considerable uncertainty as to the true value of ϕn owing to the imprecision in the spur / ring gear drive mechanism of the third stage. The actual value of ϕn will be determined in subsequent analyses.
adjust the ω and γ stages to an angle such that ω +γ +ϕn ≈ 180. The approximation is because we do not know the actual value of ϕn. A recommendation is ω = 180−ϕn/2, γ = +ϕn/2. Assuring that both ω and γ have variable starting positions scattered around half of the circle reduces effects in the correlation matrix from the fit due to third-stage drift during a fixed-ϕn measurement cycle (which is discussed below).
scan either ω or γ fairly quickly over a range larger than the uncertainty in ϕ, until an autocollimator feature is detected. Compute a better approximation of ϕn from this. This scan covers about 0.2 degree and crosses the feature in roughly 100ms.
-
select a series of γn,m values approximately evenly spaced around a full circle. There are two strategies for this:
choose γn,m precisely at integral multiples of the encoder mark period, in which case, all samples will be taken at essentially constant phase on the short-period ‘compensation’ function of the encoder. The short-period component then drops out.
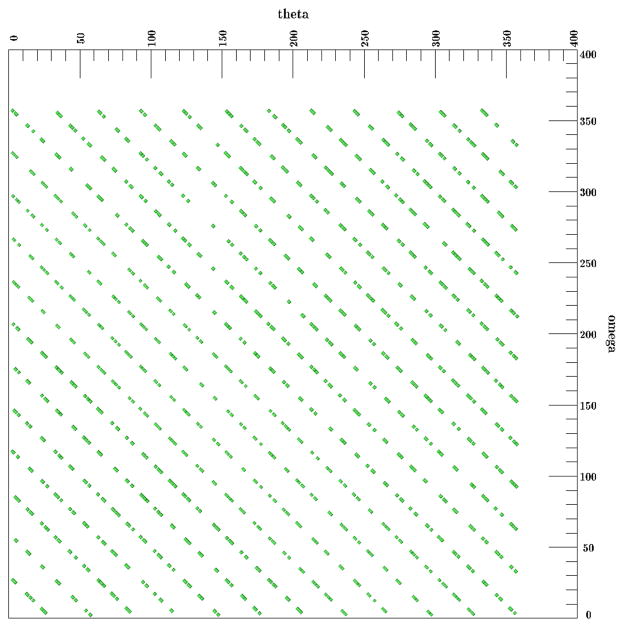
choose the γn,m samples randomly with respect to the encoder marks, and apply the short-period correction as in [10]. This then makes a strong test of the simultaneous validity of both the short- and long-range corrections. We typically use angles of 10° × m ± 2.5° where the random term is rectangularly distributed around the given center. A sample grid is shown in figure 5. The uniform diagonals from upper left to lower right correspond to individual scans with a fixed ϕn. Angles are wrapped to 360°; actual scans extended beyond this range to make scans continuous.
for each γn,m step the ω stage slowly across the predicted position of the autocollimator null at ωn,m = 180−γn,m − ϕn, and collect the autocollimator signal Vn,m, j as a function of ωn,m, j. These scans typically cross the pattern in a few seconds. In this case, there are many thousand cycles of the autocollimator mirror wobble in one pattern, so the requirement of at least 5 cycles is fully satisfied. This scan can either be a step-and-read scan, or a continuous motion scan. We have determined that for our system, the continuous motion scan, combined with high-speed reading of the encoder angle and lock-in voltage, provides satisfactory results. The continuous-motion scan can be carried out many times faster than the step-and-read scan.
repeat for multiple ϕn.
Figure 5.
Sample γ − ω grid, as used in analysis below. The slightly randomized nature of the sampling is visible.
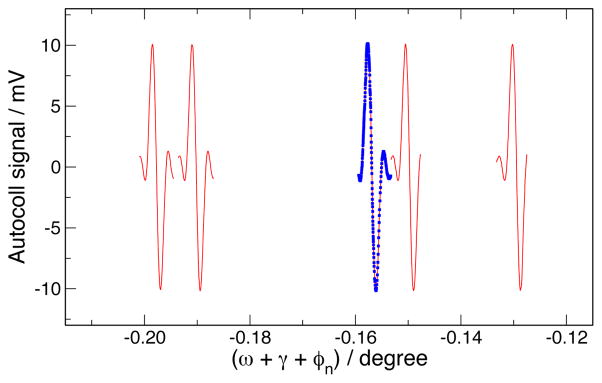
The resulting data sets Vn,m, j are a series of functions looking much like figure 4b. A sample of a few zero crossings is shown in figure 6. These samples are taken from different settings of the third stage. They are offset due to the inaccuracy of setting the third stage angle ϕn; however, the actual angle will be determined in the fitting procedure. The next step is to extract the precise position of the zero crossing from these data sets, by one of several potential fitting procedures. The use of line fitting near the zero crossing vs. using a Gaussian-weighted least-squares fit to 4 were compared by evaluating the RMS amplitude of the residuals of the final closure fits. Appropriate choice of the width of the weighting function results in significantly better performance with the fit to 4 than for the line fit. We have achieved very good performance with a Gaussian weight with σ = Δxpp where Δxpp is the measured distance between the positive and negative peak of the measured pattern. Each of these fits gives us the actual value of ωn,m. We would like to point out that, since circle closure is a completely self-consistent fit, the appropriate test for a ‘better’ choice of any part of the fitting algorithm is that it provides the smallest residuals.
Figure 6.
Example zero crossings. The symbols on one plot mark individual measurements to show typical data collection density.
A. Analysis
Following [5], equation 2, we extend the angular condition to include error terms from both the ω and γ stages. We define corrected angles Ω and Γ as:
| (5) |
| (6) |
The condition to see a null on the autocollimator is Ω+Γ+ϕ = 180°. Then, an observed null satisfies
| (7) |
Note that this is a linear equation in the unknowns ϕn, Ah, Bh, Ch, and Dh. The complete set of found nulls thus creates an overdetermined set of linear equations which can be solved classically, and which results in a least-squares minimization of residuals. However, we have found that, on our system, the third stage and mirror drift slowly, probably as a result of residual thermal stresses from the drive motors, especially the small, but uncooled, motor for the third stage itself. To get optimal fitting, we have determined that adding a linear slew rate to each ϕn improves the quality of the fits. The data we present below demonstrates these corrections. With δn being the drift rate after the nth move, 7 becomes
| (8) |
where tn is the time at the approximate middle of the nth scan. Our fitting procedure allows us to either fit δn or to freeze it at 0, to ascertain how much the drift affects the quality of the fit. With a sufficiently diverse set of ϕn values scattered around the circle, this extra term is well determined and does not interfere with the A, B, C, D coefficients. We have observed that if one exercises the goniometer for a day in advance of making these measurements, the δn values tend to be quite small, but with the fitting of this parameter, there is no need to do such a long warm-up of the machine. Note that all that is important for this drift is that it be fairly uniform over the time of one loop of the closure, which is typically 10 minutes to 20 minutes (depending on scan width and speed).
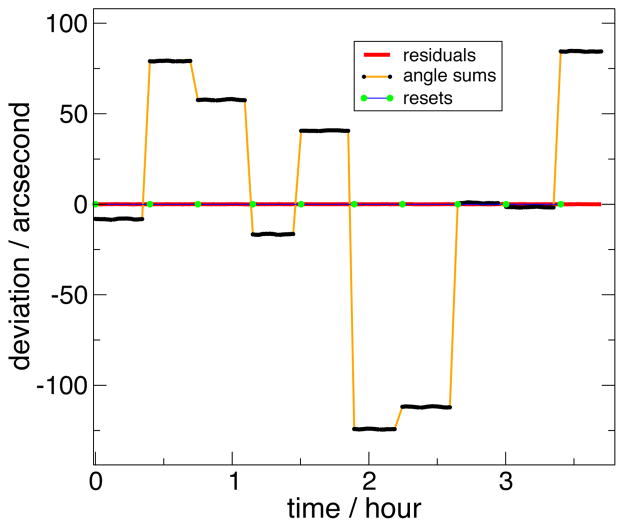
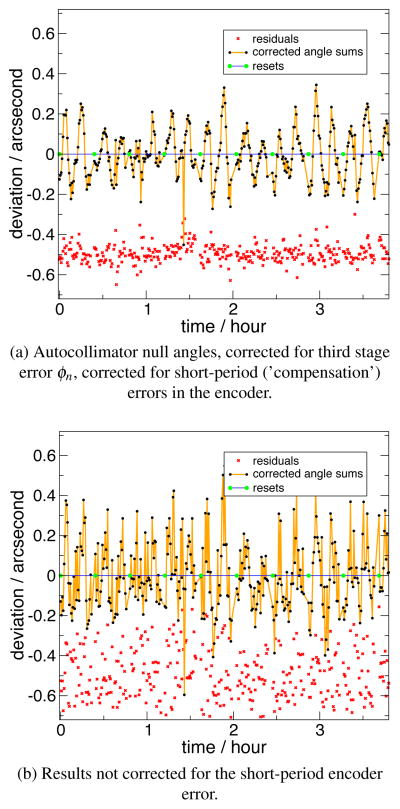
Figure 7 shows the sum γ+ω+ϕ (shifted vertically to center at zero for the graph) as directly determined from the autocollimator zero crossings, as a function of time during the data taking process. The data set labeled ‘resets’ has a mark on it every time the third stage is moved. The large steps in this plot show the error in the positioning of the third stage. The useful signal is a small variation on the top of each large step. Figure 8a has had ϕn + (t − tn)δn from the fit subtracted, to show this signal. These data are what is being fit to determine the actual angular deviation of interest. The residuals from the actual fit are also shown. The RMS value of the residuals is 0.035 second.
Figure 7.
Autocollimator null angles, uncorrected for the initial uncertainty in ϕn. These are the raw data which go into the fits of 8. Note that this, along with figure 8, is a subset of the 18 hour data set used for the full fit, for clarity.
Figure 8.
Angle error signal from autocollimator. Residuals have been shifted vertically for clarity.
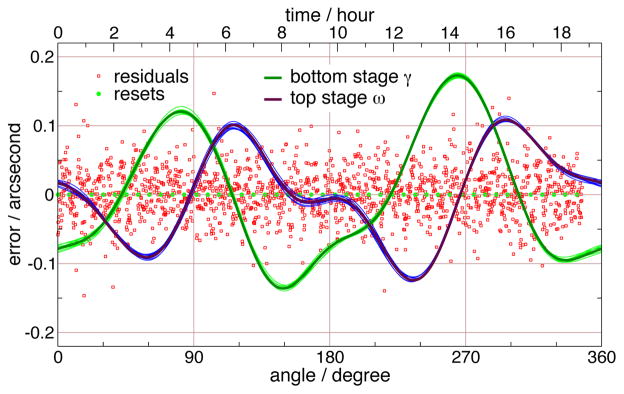
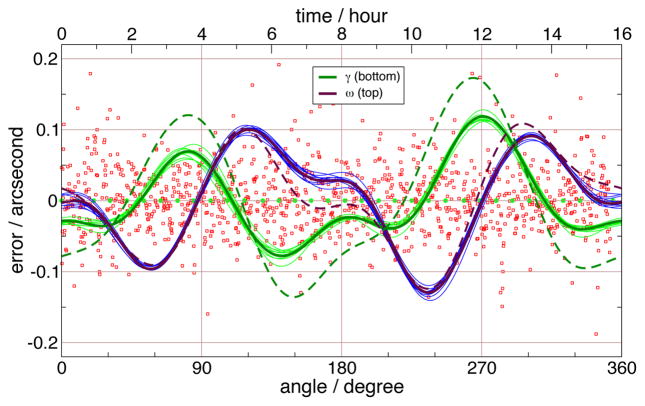
The fit to 8 yields the coefficients Ah, Bh, Ch, and Dh, which describe the error correction for each stage. Figure 9 shows the separated sums of the A and B terms for the ω stage, and the C and D terms for the γ stage as a function of the rotation angle (bottom axis). It also shows the fit residuals and 3rd stage moves as a function of time (top axis). These curves define the underlying error structure of the installed angle encoders for the fully operational system. The band around the fit is a result of 10 bootstrapped resamplings, to show an approximate statistical (type A) error band on the fit (see [11] §15.6); this statistical error band is extremely small, due to the large amount of data taken for this run, and does not indicate a meaningful uncertainty in a small number of measurements. Based on the statistical uncertainties and observed stability of this fit over time, the claimed expanded (k=2) uncertainty of the angles measured by this system is 0.1 second.
Figure 9.
Fitted values for γ and ω corrections.
B. Effect of short-period angle correction (compensation)
In a previous paper [10], we discussed a mechanism for determining the short-range errors in an encoder due to nonlinearities in the interpolation process between the encoder marks. Once one has tentatively made that measurement, it is very important to have some way to test it, but this is quite difficult in general because it is a small correction, and most experiments will not be sufficiently sensitive to directly determine the validity of the correction with confidence. However, the measurements we have carried out above are, due to the strong self-consistency requirements, quite sensitive to the quality of the short-period error correction. As discussed above, we have chosen to randomly sample our angles around an approximately uniform grid. This guarantees that we see the effect of the combined short-period correction of both encoders. The results above have the correction turned on. We can repeat the same fits with the correction turned off. Since the correction is carried out in post-processing, this is very simple to do, without re-taking any data. Figure 8b shows the result, and should be compared directly to figure 8a. Note that the RMS value of the residuals is now 0.11 second.
C. Effect of axial misalignment
One systematic effect which could create an error in the angle calibration is misalignment of the goniometer axes relative to the vertical axis of the nulling autocollimator. Achieving proper alignment between the autocollimator and a single rotation stage can be accomplished in a straightforward manner with a leveling operation of both devices. However, with a goniometer assembly consisting of stacked rotation stages, this strategy will only be effective if the rotation axes of the stacked stages are known to be parallel; else, the rotation axes of an upper stage will precess as the lower stage is rotated. This will lead to the mirror rocking up and down as the goniometer rotates since the stage and autocollimator axes are never entirely parallel, and this will appear as an apparent shift in the null angle which is a function of the rotation angle that is indistinguishable from a real angle error in the encoder. Note that overall tilt of the goniometer is not an issue; since the mirror is always at the same physical position during all of the closure, the tilt angle never changes. It is the misalignment of the two axes which causes the vertical shift.
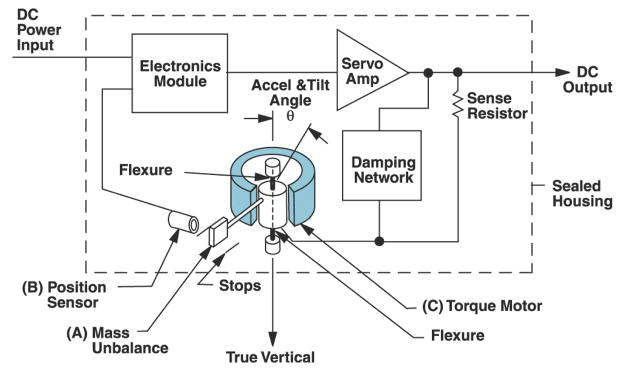
To test for the parallelism of the the rotation axes, we utilize a Jewell Instruments LSRP-1 servo inclinometer mounted on the sample or ω stage. This device has a sensitivity of 5V/degree and a noise floor around 250μV, corresponding to about 0.2 second, when its output signal is averaged over 100 power line cycles. It operates as a force-balance accelerometer, using a D’Arsonval movement to balance an off-axis paddle. A schematic is shown in figure 10.
Figure 10.
LSRP-1 functional schematic, from [12]. Used with permission.
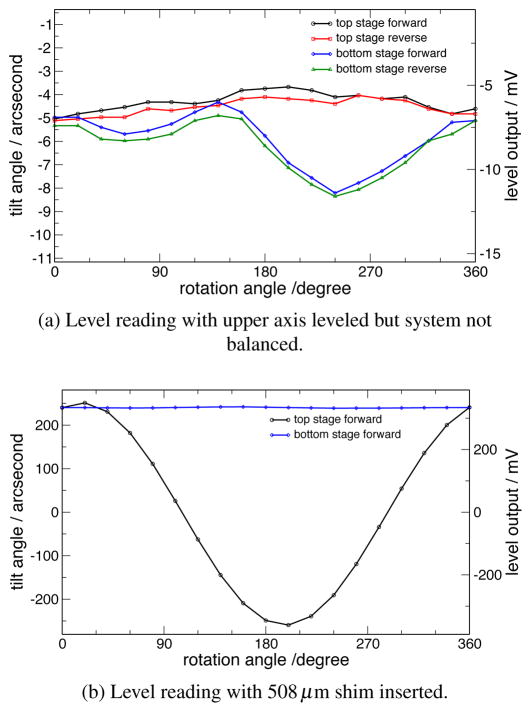
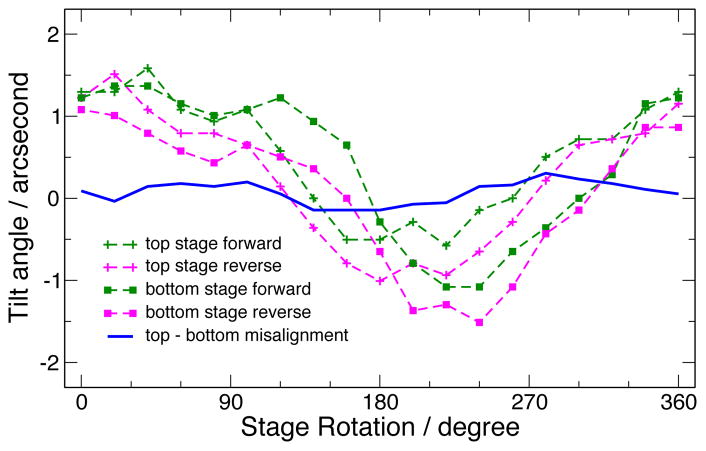
Figure 11a shows a plot of the output of the level when each axis of the goniometer is rotated after a leveling procedure established that the rotation axis of the upper stage was, indeed, vertical. The small offset between forward and reverse turns is an inertial effect on the level; allowing longer settling after the rotations decreases the effect. The first harmonic of the difference between the two signals is the misalignment between the rotation axis. Higher harmonics correspond to wobble of the goniometer stages. The non-harmonic substructure of the difference is indicative that direction of one, or both, of the rotation axes is changing during the experiment. Also, note that any constant vertical offset is a meaningless mounting tilt of the level.
Figure 11.
Measurement of axial misalignment of the goniometer stages. The traces shows the angle from level measured with an electronic level mounted on the top stage, as each stage is rotated.
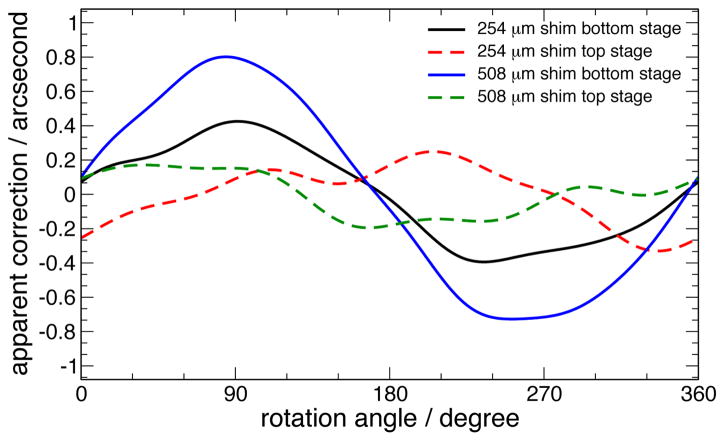
To determine the sensitivity of the autocollimator to vertical wobble, we inserted shims between the two goniometer stages. This was done with 254μm and 508μm (nominal) thickness shims, across the 40cm diameter of the goniometer, corresponding to 131 second and 232 second tilts of the stages. Since the shims were between the two stages, they produced a vertical angle shift of the mirror which depended only on the angle of the bottom stage; the top stage rotated about this new, tilted axis and was not affected. Figure 11b shows the output of the level for the 508μm shim, and figure 12 shows the closure data which results from each shim set. Note the large vertical scale change between figures 11a and 11b. Note that all the error should appear in the results from the bottom stage, the shims rotate with the bottom stage causing the upper stage rotation axis to precess and the mirror to effectively oscillate about a horizontal axis. However, the upper stage encoder (dotted lines) is being operated with its shaft misaligned to the point that the “encoder installation” is outside the specifications for which accuracy is guaranteed. This results in the upper stage showing a smaller, but real deviation from optimal performance. The misalignment introduced for this experiment with the 508μm shim is at least 50 times larger than the error when the system is well aligned. The approximately 50% amplitude of the apparent error for 254μm shims, and the magnitude of the correction for 508μm establishes rough linearity. From this experiment, we can derive a cross-coupling of 0.8/232 = 0.0034 between the the axial misalignment angle and the measured angular error of the encoder. The use of two shim sets verifies the linearity of the effect. Since our production measurements were taken with the system aligned within 1 second, this sets an upper limit of about 0.004 second peak error due to this misalignment.
Figure 12.
Fits to closures made with upper stage intentionally tilted off axis.
D. Effect of instrument balance
As a component of the investigation of the axial alignment of the instrument, we observed, as in figure 11a, deviations between the directions of the two axes which were not consistent with a simple misalignment. Only variation with sinθ (where θ is either rotation angle, here) can be corrected by shimming and tilting the system; sin2θ variation (and any higher harmonics) of the pointing of the axis of the system point to a different fundamental source. The goniometer assembly was dismantled to examine for possible sources of error. It was determined that the assembly had been manufactured to tolerances that would ensure parallelism of the rotation axes to within ±2 second.
Additional experiments, however, indicated that off axis loading of the individual rotation stages was highly problematic. Relatively small off-axis loads caused the rotation stages to perform outside of their nominal (unloaded) ±2 second specifications for wobble. It became apparent that the ω stage was loading the γ stage on which it was mounted in an off axis manner, leading to the observation of 11a. This behavior was addressed by adding counterweights to the ω stage opposite the drive motor assembly and the worm drive. Our final measurements were made with the leveling as in figure 13. These data indicate that the stage axes are parallel to ±.25 second, while the assembly is tilted by 1 second.
Figure 13.
Leveling signature of the machine with the counterbalancing weights installed. Note the misalignment now has an amplitude of only about 0.2 second.
It is important to note that the off-axis loading of the system may well have effects beyond simple tilting of the axis with its impact on the accuracy of the autocollimator. The original measured angular correction function, analogous to figure 9 but not shown, collected before the balancing issue was investigated changed by more than could be explained by the cross-axis coupling in the nulling autocollimator discussed in the previous section. From an examination of the schematic of the goniometer assembly shown in figure 1 it is clear the tilting of the ω stage from off axis loading will cause the driveshaft of the γ stage encoder to move off the desired rotation axis. The will cause the γ stage encoder to behave as if it were “installed” outside the specifications for which accuracy of the encoder is guaranteed. Our calibration would correctly measure this error in the end, since it is a real and repeatable defect in the response of the encoder, compensate for the defect in subsequent measurements. However, such a deviation did correctly indicate that the encoder was not “installed” correctly.
E. Long-term Stability
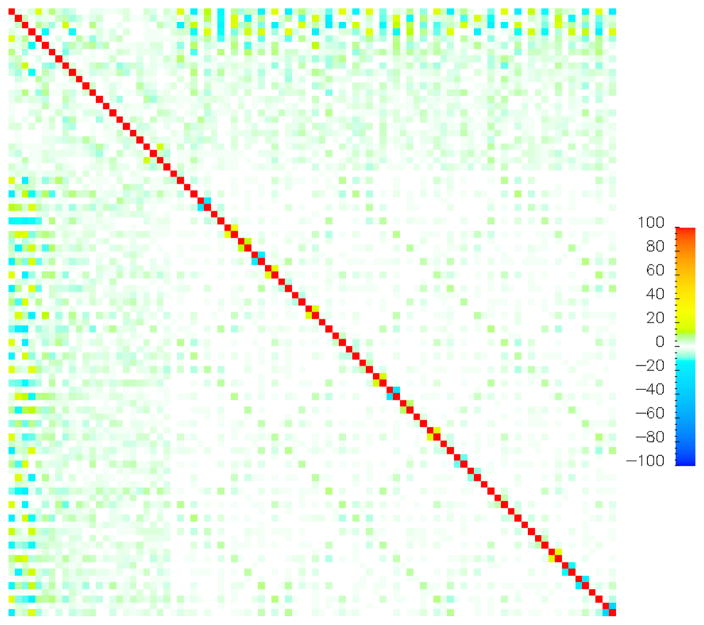
As a test of the stability of the calibration shown above, we re-took a set of closure data approximately 6 months after the data above were collected. In the interim, the system had had detectors and other material loaded and unloaded repeatedly, and it had been operated for production data taking for many hundred hours. The newly collected closure is shown in figure 14. An explanation of what is plotted is associated with figure 9. It shows significant changes from that shown in figure 9; the γ axis (green) has changed significantly (but not outside of error bounds we specify), and ω (blue) is almost unchanged. It is worth noting that all of the unbalanced loads appear on the γ (bottom) stage. We speculate that exercising the machine has relaxed some stress in that axis, resulting in a correction function which is closer to ideal. It is therefore suggested that, before a machine is calibrated, it is a good idea to exercise the axes thoroughly under conditions of actual use. The parameter correlation matrix (in %) for this fit is shown in figure 15. The axes are just parameter indices in the fit. It is important to look at this matrix to verify that no unintended correlations are degrading parameter error bounds. The largest off-diagonal elements are roughly 25%. The block of 24 rows at the top correspond to the trigonometric terms for a 6-harmonic fit. The rest of the matrix contains alternating ϕn and δn terms. The data taken in figure 9 were taken with a less-optimal selection of starting angles than were the data of figure 14 (γ always started out near 0 instead of ϕn/2 after a ring move) and showed much larger correlation between trigonometric terms and the δn terms.
Figure 14.
Closure function 6 months after original for stability check; dashed lines are data from figure 9.
Figure 15.
Correlation matrix for fit in figure 14.
IV. CONCLUSION
We have realized a self-calibrating, dual-axis angle measurement engine with an expanded (k=2) uncertainty of ±0.1 second. A uniform temperature around the instrument is crucial to eliminate thermal instabilities in the autocollimator optical path; water cooling of the drive motors was necessary to achieve this. The criticality of axis alignment has been established, along with methods for the measurement of this alignment on a vertical axis instrument. The issue of load balancing on rotation stages of conventional ball-bearing design was investigated and addressed; the procedures used are applicable only to stages with vertical axes in which gravitational torques can be eliminated. Calibration can be performed with a minimum disruption to the angle measurement application for which the machine was commissioned.
Footnotes
Certain commercial equipment, instruments, or materials are identified in this paper in order to specify the experimental procedure adequately. Such identification is not intended to imply recommendation or endorsement by the U.S. government, nor is it intended to imply that the materials or equipment identified are necessarily the best available for the purpose.
References
- 1.Deslattes RD, Henins A. Phys Rev Lett. 1973;31:972–975. [Google Scholar]
- 2.Becker P, Dorenwendt K, Ebeling G, Lauer R, Lucas W, Probst R, Rademacher HJ, Reim G, Seyfried P, Siegert H. Phys Rev Lett. 1981;46:1540–1543. [Google Scholar]
- 3.Estler W, Queen Y, Bryan J. CIRP Annals – Manuf Tech. 1993;42:573–576. [Google Scholar]
- 4.Estler WT. J Res NIST. 1998;103:141–151. doi: 10.6028/jres.103.008. [DOI] [PMC free article] [PubMed] [Google Scholar]
- 5.Kinnane MN, Hudson LT, Henins A, Mendenhall MH. Metrologia. 2015;52:244–250. [Google Scholar]
- 6.Troughton E. Phil Trans Royal Soc. 1809;99:105–145. http://www.jstor.org/stable/107252. [Google Scholar]
- 7.Probst R, Wittekopf R, Krause M, Dangschat H, Ernst A. Measurement Science and Technology. 1998;9:1059–1066. [Google Scholar]
- 8.Watanabe T, Fujimoto H, Masuda T. Journal of Physics: Conference Series. 2005;13:240. [Google Scholar]
- 9.Geckeler RD, Link A, Krause M, Elster C. Meas Sci Tech. 2014;25:055003. [Google Scholar]
- 10.Mendenhall MH, Windover D, Henins A, Cline JP. Metrologia. 2015;52:685–693. doi: 10.1088/0026-1394/53/3/933. [DOI] [PMC free article] [PubMed] [Google Scholar]
- 11.Press WH, Flannery BP, Teukolsky SA, Vetterling WT. Numerical Recipies in C. 2. Cambridge University Press; 1992. [Google Scholar]
- 12.Jewell instruments inertial sensor theory introduction. http://www.jewellinstruments.com/inertial-sensor-theory-101/


