

Abstract
Purpose
To analyze the vitreoretinal interface in diabetic eyes using three-dimensional wide-field volumes acquired using high-speed, long-wavelength swept-source optical coherence tomography (SS-OCT).
Design
Prospective cross-sectional study.
Methods
Fifty-six diabetic patients (88 eyes) and 11 healthy non-diabetic controls (22 eyes) were recruited. Up to eight SS-OCT volumes were acquired for each eye. A registration algorithm removed motion artifacts and merged multiple SS-OCT volumes to improve signal. Vitreous visualization was enhanced using vitreous windowing method.
Results
Of 88 diabetic eyes, 20 eyes had no retinopathy, 21 eyes had non-proliferative diabetic retinopathy (NPDR) without macular edema, 20 eyes had proliferative diabetic retinopathy (PDR) without macular edema and 27 eyes had diabetic macular edema (DME) with either NPDR or PDR. Thick posterior hyaloid relative to healthy non-diabetic controls was observed in 0/20 (0%) diabetic eyes without retinopathy, 4/21 (19%) eyes with NPDR, 11/20 (55%) eyes with PDR, and 11/27 (41%) eyes with DME (p=0.0001). Vitreoschisis was observed in 6/22 (27%) healthy non-diabetic eyes, 9/20 (45%) diabetic eyes without retinopathy, 10/21 (48%) eyes with NPDR, 13/20 (65%) eyes with PDR and 17/27 (63%) eyes with DME (p=0.007). While no healthy non-diabetic controls and diabetic eyes without retinopathy had adhesions/pegs between detached posterior hyaloid and retina, 1/21 (4%), 11/20 (55%) and 11/27 (41%) eyes with NPDR, PDR and DME respectively demonstrated this feature (p=0.0001).
Conclusion
SS-OCT with motion-correction and vitreous windowing provides wide-field three-dimensional information of vitreoretinal interface in diabetic eyes. This may be useful in assessing progression of retinopathy, planning diabetic vitreous surgery and predicting treatment outcomes.
INTRODUCTION
The vitreous body is the largest structure in the human eye and occupies the space behind the lens and in front of the retina.1–3 In its normal state, the vitreous firmly adheres to the vitreous base, optic disk and macula at birth.1–3 As the eye ages, a complex series of events causes the posterior vitreous cortex (hyaloid) to detach from the inner retinal surface. This occurrence is termed as posterior vitreous detachment (PVD) and is a normal aging process.3–5 In some eyes, there may be an incomplete or defective separation of the posterior hyaloid from the inner retina leading to an anomalous PVD. Such an occurrence may result in the pathological manifestations of the disorders of the vitreomacular interface.3,5,6 Retinal pathologies such as diabetic retinopathy, diabetic macular edema, age-related macular degeneration and retinal vascular occlusions may be concurrently associated with abnormalities of the vitreomacular interface.7–11
Diabetic retinopathy is the most common cause of new onset visual impairment in working age adults in the United States.12 It is typically classified as either non-proliferative diabetic retinopathy (NPDR) or proliferative diabetic retinopathy (PDR). Either one can have diabetic macular edema (DME).13 The pathogenesis and progression of diabetic retinopathy involves changes in the vitreous structure.1,7,10,11,14–16 However, because the vitreous is transparent, it is often difficult to reliably image the vitreous and the vitreoretinal interface. Since optical coherence tomography (OCT) was introduced as a non-invasive optical imaging modality for diagnosis of various retinal diseases,17 it has become a standard imaging modality in ophthalmic practice. With the advancement of OCT technology from time-domain to spectral-domain OCT (SD-OCT), improved in-vivo visualization of the posterior vitreous and vitreoretinal interface has become possible through improved axial resolution, higher imaging speed and improved signal-to-noise ratio.18–21 Recent SD-OCT studies have analyzed the vitreoretinal interface in diabetic macular edema and described features such as incomplete PVD, vitreomacular traction and epiretinal membranes.10,11
Of late, the introduction of swept-source OCT (SS-OCT) technology has enabled higher image acquisition speed, wider imaging field, and lower sensitivity roll-off versus depth compared to SD-OCT technology.22 Using SS-OCT, recent studies demonstrated an ability to better visualize the posterior vitreous and vitreoretinal interface in healthy eyes and determined the prevalence and described the dimensions and shapes of the bursa premacularis and area of Martegiani.23–25 A more detailed three-dimensional analysis of the posterior vitreous and vitreoretinal interface using volumetric SS-OCT with a high A-scan density acquired over a wide field of the retina covering the fovea and the optic nerve head regions was recently demonstrated by Liu JJ et al.26 In this study,26 a vitreous windowing method was employed to enhance the details of the vitreous, and various features of the posterior vitreous and vitreoretinal interface in young healthy eyes were described. Another recent SS-OCT study examined the vitreoretinal interface in 4 patients with PDR and described features such as neovascularization and vitreoschisis.27 This report27 was limited to a small number of patients, a study of only the proliferative stage of diabetic retinopathy, and the use of single B-scan imaging protocols on SS-OCT.
Given that the vitreous plays an important role in the pathogenesis of diabetic retinopathy, 1,7,10,11,14–16 the present study aims to perform an in-vivo three-dimensional analysis of the features of the posterior vitreous and vitreoretinal interface in diabetic eyes either without clinical evidence of retinopathy or with different stages of retinopathy, in comparison to age-matched healthy non-diabetic control eyes. It uses a vitreous windowing method to enhance visualization of the posterior vitreous and the vitreoretinal interface26 applied to three-dimensional wide-field volumetric SS-OCT covering the fovea and optic nerve head regions obtained using a high-speed, long-wavelength SS-OCT prototype.
METHODS
Subjects
Fifty-six patients with diabetes (88 eyes) with or without clinically visible diabetic retinopathy and 11 healthy non-diabetic controls (22 eyes) were prospectively recruited at the New England Eye Center, Tufts Medical Center, Boston, MA, between September 2012 and June 2014, for imaging on a prototype SS-OCT system. This system was developed at Massachusetts Institute of Technology, Cambridge, MA and deployed at the New England Eye Center, Boston, MA. The healthy non-diabetic controls had a best-corrected visual acuity of 20/20 or better and underwent fundus examination to exclude any existing retinal or choroidal pathology. The diabetic patients had a best-corrected visual acuity of 20/200 or better and underwent complete ophthalmic examination including dilated fundus examination on slit lamp biomicroscopy, fundus photography, OCT imaging on commercially available SD-OCT (Carl Zeiss Meditec Inc., Dublin, California, USA, Software version 6.0), and in certain cases, fluorescein angiography. All subjects with a myopic refractive error of greater than 6 diopters were excluded. Diabetic patients with concomitant posterior segment pathologies such as age-related macular degeneration, central serous chorioretinopathy, prior vitrectomy, retinal detachment and history of hypertension were also excluded.
Based on clinical assessment, the diabetic patients were characterized into 4 groups: (1) diabetes without retinopathy (20 eyes), (2) non-proliferative diabetic retinopathy (NPDR) without macular edema (21 eyes), (3) proliferative diabetic retinopathy (PDR) without macular edema (20 eyes), and (4) diabetic macular edema (DME) (27 eyes) with either NPDR (22 of 27 eyes) or PDR (5 of 27 eyes). A chart review was performed to determine if the eyes in the NPDR and PDR groups had any prior history of macular edema. Details of prior treatment with pan-retinal photocoagulation, focal laser and/or anti-vascular endothelial growth factor (anti-VEGF) agents were also obtained from the charts (Table 1).
Table 1.
Demographic and clinical characteristics of the healthy non-diabetic control subjects, diabetic patients without retinopathy and diabetic patients with different stages of retinopathy that were imaged using vitreous enhanced three-dimensional swept-source optical coherence tomography imaging for analysis of the posterior vitreous and vitreoretinal interface
| Healthy Subjects | No Diabetic Retinopathy | NPDR | PDR | DME | |
|---|---|---|---|---|---|
| Number of patients (eyes) | 11 (22) | 10 (20) | 13 (21) | 14 (20) | 19 (27) |
| Age in years (range) | 54 (48 – 62) | 58 (49 – 66) | 59 (45 – 65) | 56 (44 – 69) | 58 (42 – 71) |
| Mean Myopic Refractive Error (range) | 1.25 (1.00 – 1.50) | 1.00 (0.50 – 1.50) | 1.50 (1.00 – 2.00) | 1.50 (0.75 – 2.25) | 1.50 (0.50 – 2.50) |
| Gender | Males – 4 (36%) Females – 7 (64%) |
Males – 6 (60%) Females – 4 (40%) |
Males – 7 (54%) Females – 6 (46%) |
Males – 7 (50%) Females – 7 (50%) |
Males – 11 (58%) Females – 8 (42%) |
| Best-Corrected Visual Acuity | 20/20 or better | 20/20 | 20/20 – 20/80 | 20/20 – 20/200 | 20/25 – 20/200 |
| Prior Treatment with Focal Laser/PRP (number of eyes) | NA | NA | 2 | 15 | 18 |
| Prior Treatment with anti-VEGF agents (number of eyes) | NA | NA | NA | 6 | 21 |
Abbreviations: NPDR, non-proliferative diabetic retinopathy; PDR, proliferative diabetic retinopathy; DME, diabetic macular edema; PRP, pan-retinal photocoagulation; VEGF, vascular endothelial growth factor
This study was approved by the institutional review boards of Tufts Medical Center and the Massachusetts Institute of Technology and adhered to the Declaration of Helsinki and the Health Insurance Portability and Accountability Act. Signed written informed consent was obtained from all subjects prior to enrollment in the study.
Swept Source Optical Coherence Tomography Imaging & Image Processing
All subjects underwent imaging using a research prototype SS-OCT,22 that employs a light source with a wavelength-sweeping laser centered at 1050nm and yields an axial resolution of ~6μm in tissue, an imaging range of 3.6mm and an imaging speed of 100,000 A-scans/second that is ~4 times faster than standard clinical SD-OCT instruments. This prototype SS-OCT has similar specifications as the Topcon Deep Range Imaging (DRI) OCT-1 Atlantis SS-OCT (Topcon Medical Systems, Oakland, N.J.) that was recently introduced commercially, but has not yet been approved for use in the United States.
A trained operator acquired up to eight orthogonally raster scanned three-dimensional SS-OCT volumes over a 12mm X 12mm (~40°) region of the retina centered between the fovea and the optic nerve head with the focus manually adjusted for acquisition of better vitreous details. Each three-dimensional SS-OCT volume consists of 500 A-scans per B-scan for a total of 500 B-scans that takes less than 3 seconds to acquire. A registration algorithm was applied to at least 2 orthogonally scanned three-dimensional SS-OCT volumes to correct for motion artifacts; this motion-correction algorithm has been described previously.28 Following motion correction, multiple SS-OCT volumes are merged into a single volume with improved signal.28 Arbitrary SS-OCT images from a motion-corrected three-dimensional volume can be viewed in any ortho-plane or enface projection.
Each merged three-dimensional motion-corrected SS-OCT volume was then processed to enhance visualization of the posterior vitreous and vitreoretinal interface using a vitreous windowing method.26 (Figure 1). This method is analogous to computed tomography where tissues of varying physical densities can be visualized in better detail by changing contrast windows, and is performed by adjusting the threshold and contrast of the motion-corrected three-dimensional SS-OCT volume using a commercially available software algorithm (ImageJ; NIH, Bethesda, MD).26
Figure 1. Illustration of the vitreous enhancement method applied to three-dimensional swept-source optical coherence tomography volumes demonstrating improved visualization of features of the posterior vitreous and vitreoretinal interface.
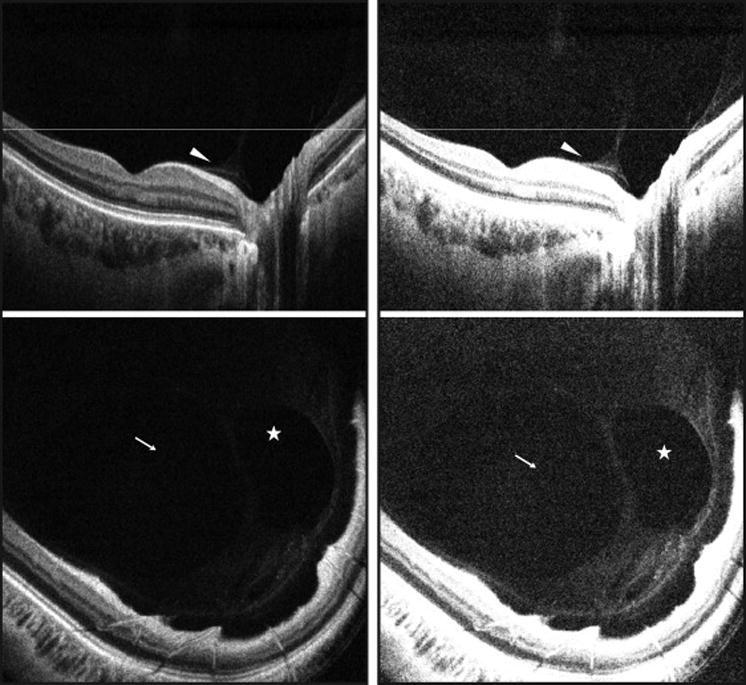
(Left Part) Motion-corrected SS-OCT B-scan image (top) and an enface representation (bottom) of a healthy eye. (Right Part) Motion-corrected SS-OCT B-scan image (top) and an enface representation of the same eye with application of the vitreous windowing method (bottom) that shows an enhancement of the posterior vitreous and vitreoretinal interface. White arrowheads: posterior vitreous cortex (hyaloid) detachment; white arrows: bursa premacularis; white stars: area of Martegiani. White lines: location of the respective enface sections. SS-OCT, swept source optical coherence tomography
Analysis of Features of Posterior Vitreous & Vitreoretinal Interface
Two independent readers experienced in analyzing OCT images assessed the vitreous windowed motion-corrected three-dimensional SS-OCT volumes of each eye for features of the posterior vitreous and vitreoretinal interface. The features analyzed included: (1) bursa premacularis, (2) area of Martegiani, (3) posterior vitreous cortex (hyaloid) detachment, (4) thick posterior hyaloid, (5) vitreoschisis, (6) adhesions (pegs) between the detached posterior hyaloid and inner retinal surface, and (7) vitreous clumping (Table 2). Each grader reviewed all 500 B-scans within the three-dimensional SS-OCT volume independently and noted their respective findings. Any disagreements between the readers were resolved by an open adjudication to make a final decision on the presence or absence of a particular feature in each eye.
Table 2.
Percent visualization of the features of the posterior vitreous and vitreoretinal interface in healthy non-diabetic control eyes, diabetic eyes without retinopathy and diabetic eyes with different stages of retinopathy using vitreous enhanced three-dimensional swept-source optical coherence tomography imaging. n represents the number of eyes. p values represent the results of one-way analysis of variance. Significant p values are in bold.
| FEATURE OBSERVED | % of Healthy Non-Diabetic Eyes with Feature (n=22) | % of Diabetic Eyes without Retinopathy with Feature (n=20) | % of Eyes with NPDR with Feature (n=21) | % of Eyes with PDR with Feature (n=20) | % of Eyes with DME with Feature (n=27) | p value |
|---|---|---|---|---|---|---|
|
| ||||||
| 1. Bursa Premacularis | 17/22, 77% | 15/20, 75% | 14/21, 67% | 13/20, 65% | 17/27, 63% | 0.22 |
| 2. Area of Martegiani | 16/22, 73% | 14/20, 70% | 13/21, 62% | 13/20, 65% | 15/27, 56% | 0.09 |
| 3. Posterior vitreous cortex (hyaloid) detachment | 18/22, 82% | 17/20, 85% | 18/21, 86% | 17/20, 85% | 23/27, 85% | 0.18 |
| 4. Thick posterior hyaloid | NA | 0/20, 0% | 4/21, 19% | 11/20, 55% | 11/27, 41% | p=0.0001 |
| 5. Vitreoschisis | 6/22, 27% | 9/20, 45% | 10/21, 48% | 13/20, 65% | 17/27, 63% | p=0.007 |
| 6. Adhesions (pegs) between the detached posterior hyaloid and inner retinal surface | 0/20, 0% | 0/20, 0% | 1/21, 4% | 11/20, 55% | 11/27, 41% | p=0.0001 |
| 7. Vitreous clumping | 11/22, 50% | 11/20, 55% | 13/21, 62% | 13/20, 65% | 18/27, 67% | 0.10 |
Abbreviations: NPDR, non-proliferative diabetic retinopathy; PDR, proliferative diabetic retinopathy; DME, diabetic macular edema; NA, not applicable
The bursa premacularis and the area of Martegiani were defined as optically clear hypo-reflective spaces overlying the macula and the optic nerve head regions respectively as described previously.23–26 Posterior hyaloid detachment was defined as a single distinct linear hyper-reflective band or a dense homogenous band separated from the inner retinal surface by an optically clear hypo-reflective space. Vitreoschisis was defined as two distinct linear hyper-reflective bands of the posterior hyaloid separated from each other by an optically clear hypo-reflective space. Adhesions (pegs) between the detached posterior hyaloid and the inner retinal surface were defined as diagonal or perpendicular connections traversing the optically clear hypo-reflective space between the detached posterior hyaloid and the inner retinal surface. Vitreous clumping was defined as a collection of hyper-reflective aggregations either within the posterior vitreous, overlying a distinctly detached posterior hyaloid, or overlying the inner retinal surface in association with an indistinct posterior hyaloid detachment.
Quantification of Posterior Hyaloid Thickness
Two readers independently selected a frame (B-scan) within the vitreous windowed motion-corrected three-dimensional SS-OCT volume for each eye where the detached posterior hyaloid appeared thickest in that eye. The measurement was performed where the posterior hyaloid appeared the thickest on the selected B-scan. To be measurable, the posterior hyaloid had to be clearly detached from the inner retina and appear as either a single distinct linear hyper-reflective band or a dense homogenous band separated from the inner retinal surface by an optically clear hypo-reflective space (Figure 2). If the posterior hyaloid was not detached throughout the SS-OCT volume, it was noted as immeasurable. As the vitreous signal is inherently low, measurements of the posterior hyaloid were performed at the lowest visible signal. The vitreous window method employed in the present study helped better visualize the signal boundaries of the posterior hyaloid relative to the noise floor, thereby allowing accurate measurements. The average measurement of the two observers was calculated for each eye to be used for the purpose of analysis. All measurements were performed using Image J (NIH, Bethesda, MD).
Figure 2. Demonstration of the differences in the thickness of the posterior hyaloid in healthy non-diabetic control eyes and eyes with diabetic retinopathy on vitreous enhanced three-dimensional swept-source optical coherence tomography imaging.
(Left Part) SS-OCT depicting a B-scan (top) and enface representation of a healthy eye (bottom) showing a detached posterior vitreous cortex (hyaloid) that appears as a linear hyper-reflective band separated from the inner retinal surface by an optical clear hypo-reflective space. (Center Part) SS-OCT depicting a B-scan (top) and enface representation (bottom) of an eye with moderate NPDR showing a detached posterior hyaloid that appears thicker than in the healthy eye. (Right Part) SS-OCT depicting a B-scan (top) and enface representation (bottom) of an eye with PDR depicting a detached posterior hyaloid that appears thick, homogenous and dense instead of linear as in the healthy eye. White arrowheads: detached posterior hyaloid. White lines lines: location of the respective enface sections. SS-OCT, swept source optical coherence tomography; NPDR, non-proliferative diabetic retinopathy; PDR, proliferative diabetic retinopathy
Statistical Analysis
One-way analysis of variance (ANOVA) was used to determine the difference in the age, refractive error and the presence of features of the posterior vitreous and vitreoretinal interface in the subject groups. One-way ANOVA with Tukey’s multiple comparison was used to determine the difference in the measurements of the thickness of the detached posterior hyaloid amongst the healthy non-diabetic control eyes and diabetic eyes either without retinopathy or with different stages of retinopathy. Intra-class correlation coefficient was used to determine the levels of agreement between the two observers for posterior hyaloid thickness measurements. Pearson correlation was used to assess the association of the posterior hyaloid thickness measurements with age in healthy non-diabetic control eyes and with age and duration of diabetes in diabetic eyes with or without retinopathy. A 95% confidence interval and a 5% level of significance were adopted; therefore, results with a p-value less than or equal to 0.05 were considered significant. All statistics were performed using Graph Pad Prism 5.0 software for Macintosh (GraphPad Software, La Jolla, CA) except intra-class correlation coefficient that was performed using SPSS Statistics (version 19, IBM Corp., Chicago, IL).
RESULTS
The demographic and clinical characteristics of the subjects are depicted in Table 1. There was no significant difference amongst the mean ages and the mean myopic refractive errors of the subjects (p=0.1 and p=0.8). The percent visualization of the various features of the posterior vitreous and vitreoretinal interface in the different subject groups is shown in Table 2.
Figure 1 demonstrates the visualization of the bursa premacularis, area of Martegiani and posterior hyaloid detachment. The mean measurement of the thickest visible part of the posterior hyaloid in healthy non-diabetic control eyes was 22.15μm. The posterior hyaloid was labeled as thick in diabetic eyes if it measured more than two standard deviations above the mean thickness obtained in healthy non-diabetic control eyes. (p=0.0001; Table 3, Figure 2). On sub-group analysis, the healthy non-diabetic control eyes, diabetic eyes without retinopathy and eyes with NPDR each had a thinner posterior hyaloid than eyes with PDR (p<0.05). Similarly, healthy non-diabetic control eyes and diabetic eyes without retinopathy each had a thinner posterior hyaloid than eyes with DME (p<0.05). There was no significant difference in the thickness of the posterior hyaloid between the healthy non-diabetic control eyes and diabetic eyes without retinopathy (p>0.05), healthy non-diabetic control eyes and eyes with NPDR, diabetic eyes without retinopathy and eyes with NPDR (p>0.05), eyes with NPDR and eyes with DME (p>0.05), and eyes with PDR and those with DME (p>0.05). The intra-class correlation coefficient for the two observers for posterior hyaloid thickness measurements was 0.76 (0.68–0.86). Posterior hyaloid thickness had a poor correlation with age both in healthy non-diabetic control eyes and diabetic eyes with or without retinopathy (r=0.20; p=0.56 and r=18; p=0.38 respectively). It also had a poor correlation with the duration of diabetes (r=0.22; p=0.25).
Table 3.
Mean thickness of the detached posterior hyaloid in healthy non-diabetic control eyes, diabetic eyes without retinopathy and diabetic eyes with different stages of retinopathy measured on vitreous enhanced swept-source optical coherence tomography images. n represents the number of eyes. p value represents the results of one-way analysis of variance.
| Healthy Non-Diabetic Eyes (n=22) | Diabetic Eyes without Retinopathy (n=20) | Eyes with NPDR (n=21) | Eyes with PDR (n=20) | Eyes with DME (n=27) | p value | |
|---|---|---|---|---|---|---|
| Mean (μm) | 22.15 | 26.0 | 33.6 | 52.6 | 46.3 | 0.0001 |
| Standard Deviation | 7.72 | 8.7 | 18.2 | 35.5 | 22.7 | NA |
| Range (μm) | 12.58 – 36.30 | 12.92 – 36.88 | 11.88 – 69.74 | 12.88 – 143.0 | 16.00 – 103.3 | NA |
Abbreviations: NPDR, non-proliferative diabetic retinopathy; PDR, proliferative diabetic retinopathy; DME, diabetic macular edema; NA, not applicable
Figures 3–5 demonstrate vitreoschisis, adhesions (pegs) between the detached hyaloid and the inner retinal surface and the presence of vitreous clumping in healthy non-diabetic control eyes and diabetic eyes with different stages of retinopathy.
Figure 3. Demonstration of vitreoschisis in healthy non-diabetic control eyes and eyes with diabetic retinopathy on vitreous enhanced three-dimensional swept-source optical coherence tomography imaging.
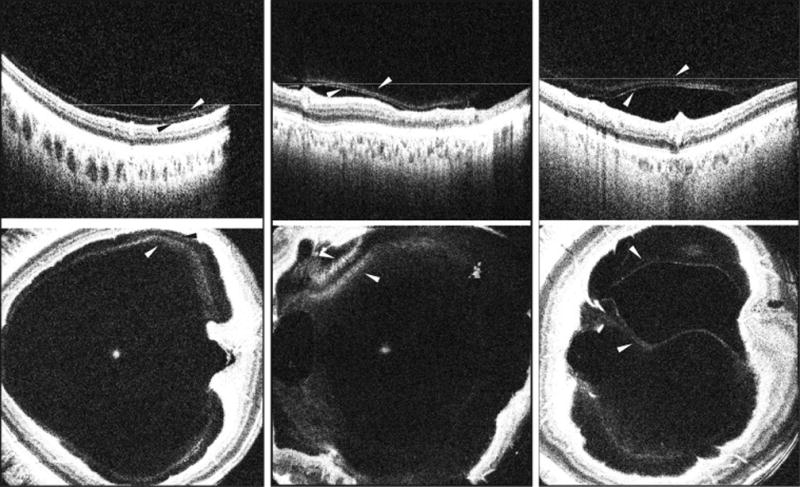
(Left Part) SS-OCT depicting a B-scan (top) and enface representation (bottom) of a healthy eye showing subtle vitreoschisis defined as two distinct linear hyper-reflective bands of the posterior hyaloid separated from each other by an optically clear hypo-reflective space. (Center Part) SS-OCT depicting a B-scan (top) and enface representation (bottom) showing vitreoschisis in an eye with NPDR. (Right Part) SS-OCT depicting a B-scan (top) and enface representation (bottom) showing vitreoschisis in an eye with PDR and DME. White and black arrowheads: splitting of the posterior hyaloid (vitreoschisis). White lines: location of the respective enface sections. SS-OCT, swept source optical coherence tomography; NPDR, non-proliferative diabetic retinopathy; PDR, proliferative diabetic retinopathy; DME, diabetic macular edema
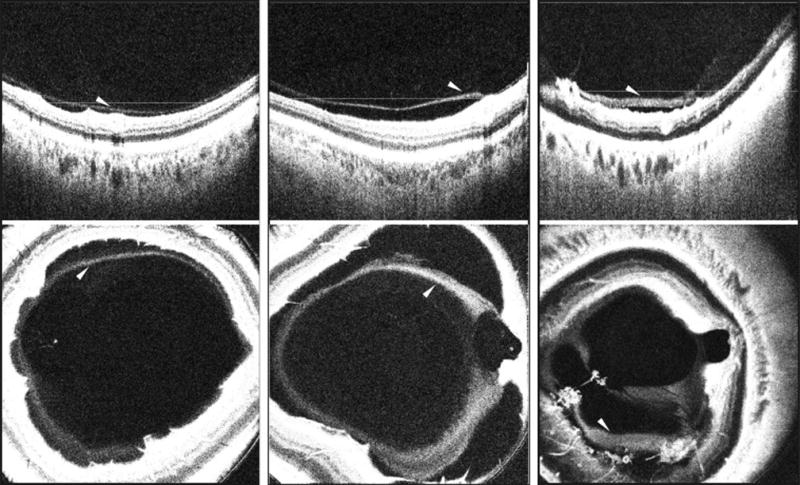
Figure 5. Demonstation of vitreous clumping in healthy non-diabetic control eyes and eyes with diabetic retinopathy on vitreous enhanced three-dimensional swept-source optical coherence tomography imaging.
(Left Part) SS-OCT depicting a B-scan (top) and enface representation (bottom) of a healthy eye showing vitreous clumping as hyper-reflective aggregations in the posterior vitreous. A distinct posterior hyaloid detachment is not visible. (Center Left Part) SS-OCT depicting a B-scan (top) and enface representation (bottom) of an eye with NPDR showing vitreous clumping in the posterior vitreous. A distinct posterior hyaloid detachment is not visible. (Center Right Part) SS-OCT depicting a B-scan (top) and enface representation (bottom) of an eye with DME showing vitreous clumping as hyper-reflective aggregations overlying the inner retinal surface. A distinct posterior hyaloid detachment is not visible except in a small region (black arrowhead). The vitreous clumping depicts a string of pearls appearance overlying the inner retinal surface in this case. (Right Part) SS-OCT depicting a B-scan (top) and enface representation (bottom) of an eye with NPDR showing vitreous clumping overlying a completely detached posterior hyaloid. White arrowheads: vitreous clumping. White lines: location of the respective enface sections. SS-OCT, swept source optical coherence tomography; NPDR, non-proliferative diabetic retinopathy; DME, diabetic macular edema
DISCUSSION
The present study demonstrates an in-vivo analysis of the posterior vitreous and vitreoretinal interface in diabetic eyes either without retinopathy or with retinopathy of different stages using vitreous enhancement on wide-field SS-OCT volumes. The vitreous enhancement method26 employed in this study can also be applied to standard clinical SD-OCT. However, while SD-OCT can have a higher axial imaging resolution than SS-OCT, when visualizing vitreous microstructures, SS-OCT is superior to SD-OCT due to its higher sensitivity, longer imaging range and higher acquisition speed (~4 times higher A-scan density). The faster speed is particularly useful in older patients that have difficulty fixating for longer periods of time and longer wavelength (1050nm) offers better image quality through opaque media. Previous SS-OCT studies have described successful visualization of vitreous features such as the bursa premacularis, area of Martegiani and posterior hyaloid detachment in young healthy eyes.33–36 The present study demonstrates these features in diabetic eyes and age-matched healthy non-diabetic control eyes (Table 2).
Lewis et al9 described a taut and thick posterior hyaloid in eyes with DME that may cause tangential and/or anterioposterior traction on the retina leading to worsening of macular edema. Surgical removal of the vitreous in such cases may be useful in improving visual outcome.9 Hence, thickness of posterior hyaloid may have relevance in surgical planning and decision-making in eyes with diabetic retinopathy, especially those with DME and/or PDR. A number of studies have additionally shown that the benefit of vitrectomy for treatment of DME is greatest when there is evidence of traction on the macula caused by an epiretinal membrane, a taut internal limiting membrane, or vitreomacular traction as observed on OCT.29 The present study demonstrates a thick posterior hyaloid relative to the healthy non-diabetic control eyes (Table 3) in one-fifth of eyes with NPDR, over half the eyes with PDR and over one-third of the eyes with DME. Within the DME group (27 eyes), over three-fourth of eyes that had PDR (4 of 5 eyes), while up to one-third of eyes with NPDR (5 of 22 eyes) demonstrated this feature. The latter were clinically assessed to have moderate to severe NPDR.
Splitting of the posterior hyaloid (vitreoschisis) can be the result of a strong vitreomacular adhesion that causes the posterior hyaloid to split as it attempts to detach from the inner retinal surface such that its outermost layer remains attached to the macula, and the inner layer collapses inwards.30 Vitreoschisis was first described in eyes with PDR using ultrasonography.15 Recently, an SS-OCT study demonstrated vitreoschisis in 4 patients with PDR.27 A growth of abnormal neovascular membranes occurs in eyes with PDR that may adhere to the posterior hyaloid. If the posterior hyaloid collapses the resultant traction on new abnormal vessel complexes may cause vitreous hemorrhage. Similarly, if the collapsing posterior hyaloid causes traction on the retina, retinal detachment may ensue.1,14 The presence of vitreoschisis may complicate PDR by causing additional traction on the new abnormal vessel complexes.1,15 Hence, this finding may be important to recognize where vitrectomy is being considered as vitreoschisis may hinder complete vitreoretinal separation during surgery. The present study demonstrates presence of vitreoschisis in all stages of diabetic retinopathy with over two-thirds of eyes with PDR and DME demonstrating this feature. Within the DME group (27 eyes), over half the eyes that had PDR (3 of 5 eyes), while over two-thirds of eyes that had NPDR (14 of 22 eyes) demonstrated this feature. Notably, vitreoschisis was also observed in up to one-fourth of healthy non-diabetic control eyes in the present study suggesting that vitreoschisis may not always be a pathological finding. Adhesions (pegs) between the detached posterior hyaloid and the inner retinal surface possibly represent abnormal fibrovascular outgrowths from the retina on to the posterior hyaloid. These may potentially bleed during surgical vitrectomy.1,14,31 Hence, they are important to recognize and sever during vitrectomy so as to prevent intraoperative retinal tears and perioperative and postoperative bleeding complications. The present study demonstrates pegs between the detached posterior hyaloid and the inner retinal surface in 1 eye with severe NPDR, over half the eyes with PDR and over one-third of the eyes with DME. Within the DME group (27 eyes), all eyes that had PDR (5 of 5 eyes), while up to one-third of eyes with NPDR (6 of 22 eyes) demonstrated this feature. The latter were clinically assessed to have moderate to severe NPDR.
Liquefaction of the vitreous is a normal aging phenomenon that can be exaggerated in diseased states.32 Progressive vitreous liquefaction in association with weakening of vitreoretinal adhesion results in complete PVD.32 Complete PVD is desired in eyes with advanced diabetic retinopathy as it decreases complications associated with neovascularization and worsening of macular edema due to vitreoretinal traction.7 The present study demonstrates vitreous clumping in half of healthy non-diabetic control eyes and over half of all diabetic eyes. This finding therefore likely represents a normal finding due to liquefaction of the vitreous gel rather than a specific characteristic of diabetic eye disease.
The present study is limited in that it is a cross-sectional analysis. A prospective analysis using these methods of patients followed over time and involving methods to study the quantitative changes in the vitreous configuration including changes in the thickness of the posterior hyaloid may better help understand the role of the vitreous in diabetic retinopathy and its progression to advanced stages of the disease. Another limitation of this study is associated with the acquisition of multiple SS-OCT volumes followed by the use of a motion correction algorithm to improve signal. Since vitreous is a dynamic tissue,33 it is possible that its configuration changes between acquisitions of multiple SS-OCT volumes. When the motion correction algorithm is applied to multiple SS-OCT volumes to improve signal, it is possible that a blurring of certain features of the posterior vitreous and the vitreoretinal interface may occur due to the dynamic nature of the vitreous tissue. Furthermore, the vitreous windowing method for an enhanced vitreous visualization requires processing of motion-corrected SS-OCT volumes. This process can be time consuming. As SS-OCT becomes widely available commercially, software for an automated generation of vitreous windowed SS-OCT volumes can potentially be employed within the system to enhance vitreous details. Also, application of vitreous windowing method enhances the vitreous and vitreoretinal interface details at the cost of decreasing visualization of the retinal layers (Figure 1). Hence, it is not ideal to simultaneously assess retinal features such as microaneurysms and hard exudates that become indiscernible when using this method in eyes with diabetic retinopathy.
In conclusion, this cross-sectional observational analysis demonstrates a detailed three-dimensional description of the posterior vitreous and vitreoretinal interface over a wide field in diabetic eyes with or without retinopathy when compared to healthy non-diabetic control eyes using a long-wavelength high-speed prototype SS-OCT. The features described in this study may be useful in assessing the progression of diabetic retinopathy, preoperative planning of diabetic vitreous surgery and assessing treatment outcomes.
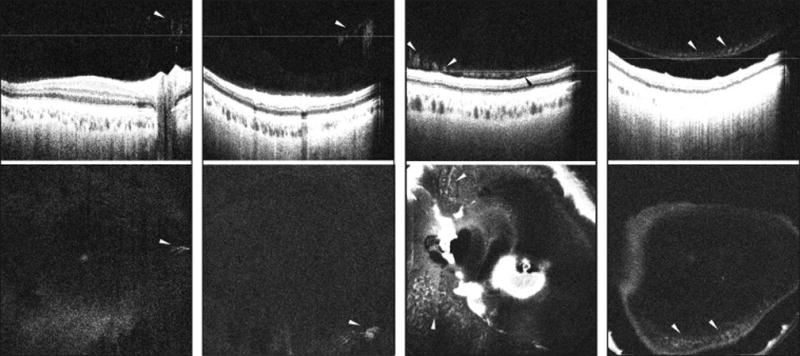
Figure 4. Demonstration of adhesions (pegs) between the detached hyaloid and retina in eyes with diabetic retinopathy on vitreous enhanced three-dimensional swept-source optical coherence tomography imaging.
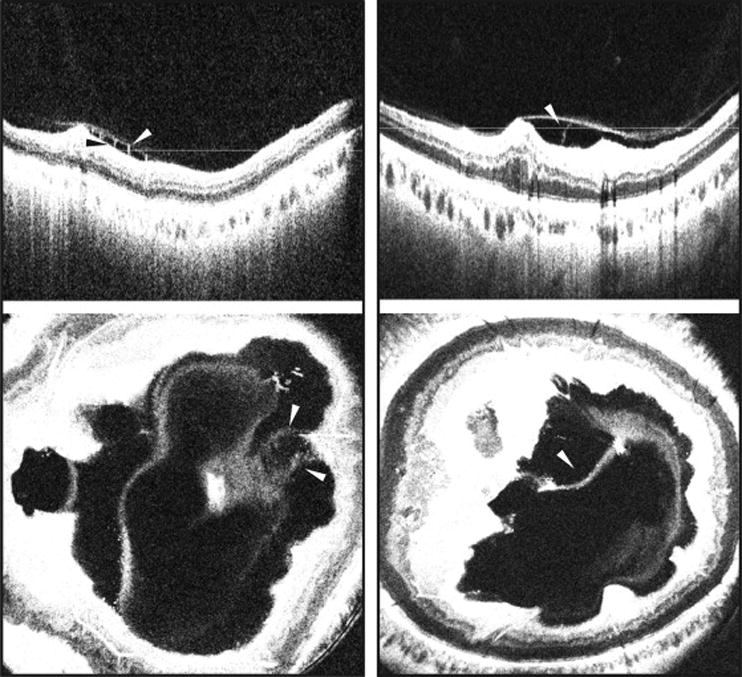
(Left Part) SS-OCT depicting a B-scan (top) and enface representation (bottom) of an eye with DME and severe NPDR showing adhesions (pegs) traversing the optically clear hypo-reflective space between the detached posterior hyaloid and the inner retinal surface. (Right Part) SS-OCT depicting a B-scan (top) and enface representation (bottom) of an eye with PDR showing adhesions (pegs) between the detached posterior hyaloid and retina. White and black arrowheads: Adhesions (pegs) between the detached posterior hyaloid and the inner retinal surface. White lines: location of the respective enface sections. SS-OCT, swept source optical coherence tomography; NPDR, non-proliferative diabetic retinopathy; PDR, proliferative diabetic retinopathy; DME, diabetic macular edema
Acknowledgments
A. Funding/Support: This work was supported in part by a Research to Prevent Blindness Unrestricted grant to the New England Eye Center/Department of Ophthalmology, Tufts University School of Medicine, National Institutes of Health (NIH) contracts R01-EY011289-28, R01-EY013178-12, R01-CA075289-16, Air Force Office of Scientific Research contracts FA9550-10-1-0551 and FA9550-12-1-0499, Deutsche Forschungsgemeinschaft (DFG) contracts DFG-HO-1791/11-1, DFG Training Group 1773, DFG-GSC80-SAOT, and Massachusetts Lions Club.
B. Financial Disclosures: Martin F. Kraus and Joachim Hornegger receive royalties from intellectual property owned by the Massachusetts Institute of Technology and licensed to Optovue Inc., Fremont, California. James G. Fujimoto receives royalties from intellectual property owned by the Massachusetts Institute of Technology and licensed to Carl Zeiss Meditech, Inc., Dublin, California, and Optovue, Inc., Fremont, California and also has stock options in Optovue, Inc., Fremont, California. Jay S. Duker receives research support from Carl Zeiss Meditech, Inc., Dublin, California, and Optovue Inc., Fremont, California.
C. Other Acknowledgements: None.
Biography

Mehreen Adhi MD graduated with high honors from Dow Medical College, Pakistan. She subsequently did a research fellowship in retinal gene therapy at Vision Research Laboratory, Tufts University School of Medicine, Boston, followed by a research fellowship in optical coherence tomography at New England Eye Center, Boston in collaboration with Massachusetts Institute of Technology, when she performed this study. Dr. Adhi’s research interests include imaging of the posterior segment, diabetic retinopathy, age-related macular degeneration and retinal vascular disease.
Footnotes
Publisher's Disclaimer: This is a PDF file of an unedited manuscript that has been accepted for publication. As a service to our customers we are providing this early version of the manuscript. The manuscript will undergo copyediting, typesetting, and review of the resulting proof before it is published in its final citable form. Please note that during the production process errors may be discovered which could affect the content, and all legal disclaimers that apply to the journal pertain.
References
- 1.Sebag J. Anatomy and pathology of the vitreo-retinal interface. Eye. 1992;6(Pt 6):541–52. doi: 10.1038/eye.1992.119. [DOI] [PubMed] [Google Scholar]
- 2.Sebag J. Ageing of the vitreous. Eye. 1987;1(Pt 2):254–62. doi: 10.1038/eye.1987.45. [DOI] [PubMed] [Google Scholar]
- 3.Duker JS, Kaiser PK, Binder S, et al. The International Vitreomacular Traction Study Group classification of vitreomacular adhesion, traction, and macular hole. Ophthalmology. 2013;120(12):2611–9. doi: 10.1016/j.ophtha.2013.07.042. [DOI] [PubMed] [Google Scholar]
- 4.Uchino E, Uemura A, Ohba N. Initial stages of posterior vitreous detachment in healthy eyes of older persons evaluated by optical coherence tomography. Arch Ophthalmol. 2001;119(10):1475–9. doi: 10.1001/archopht.119.10.1475. [DOI] [PubMed] [Google Scholar]
- 5.Johnson MW. Perifoveal vitreous detachment and its macular complications. Trans Am Ophthalmol Soc. 2005;103:537–67. [PMC free article] [PubMed] [Google Scholar]
- 6.Sebag J. Anomalous posterior vitreous detachment: a unifying concept in vitreo-retinal disease. Graefes Arch Clin Exp Ophthalmol. 2004;242(8):690–8. doi: 10.1007/s00417-004-0980-1. [DOI] [PubMed] [Google Scholar]
- 7.Nasrallah FP, Jalkh AE, Van Coppenolle F, et al. The role of the vitreous in diabetic macular edema. Ophthalmology. 1988;95(10):1335–1339. doi: 10.1016/s0161-6420(88)33004-6. [DOI] [PubMed] [Google Scholar]
- 8.Sivaprasad S, Ockrim Z, Massaoutis P, Ikeji F, Hykin PG, Gregor ZJ. Posterior hyaloid changes following intravitreal triamcinolone and macular laser for diffuse diabetic macular edema. Retina. 2008;28(10):1435–1442. doi: 10.1097/IAE.0b013e31817f2dae. [DOI] [PubMed] [Google Scholar]
- 9.Lewis H, Abrams GW, Blumenkranz MS, Campo RV. Vitrectomy for diabetic macular traction and edema associated with posterior hyaloidal traction. Ophthalmology. 1992;99(5):753–759. doi: 10.1016/s0161-6420(92)31901-3. [DOI] [PubMed] [Google Scholar]
- 10.Ophir A, Martinez MR, Mosqueda P, Trevino A. Vitreous traction and epiretinal membranes in diabetic macular oedema using spectral-domain optical coherence tomography. Eye (Lond) 2010;24(10):1545–53. doi: 10.1038/eye.2010.80. [DOI] [PubMed] [Google Scholar]
- 11.Ophir A, Martinez MR. Epiretinal membranes and incomplete posterior vitreous detachment in diabetic macular edema, detected by spectral-domain optical coherence tomography. Invest Ophthalmol Vis Sci. 2011;52(9):6414–20. doi: 10.1167/iovs.10-6781. [DOI] [PubMed] [Google Scholar]
- 12.Zhang X, Saaddine JB, Chou CF, et al. Prevalence of diabetic retinopathy in the United States, 2005–2008. JAMA. 2010;304(6):649–56. doi: 10.1001/jama.2010.1111. [DOI] [PMC free article] [PubMed] [Google Scholar]
- 13.Fong DS, Aiello L, Gardner TW, et al. Retinopathy in diabetes. Diabetes Care. 2004;27(Supp 1):S84–7. doi: 10.2337/diacare.27.2007.s84. [DOI] [PubMed] [Google Scholar]
- 14.Gunduz K, Bakri SJ. Management of proliferative diabetic retinopathy. Compr Ophthalmol Update. 2007;8(5):245–56. [PubMed] [Google Scholar]
- 15.Chu TG, Lopez P, Cano MR, et al. Posterior vitreoschisis: an echographic finding in proliferative diabetic retinopathy. Ophthalmology. 1996;103(2):315–322. doi: 10.1016/s0161-6420(96)30698-2. [DOI] [PubMed] [Google Scholar]
- 16.Gaucher D, Tadayoni R, Erginay A, Haouchine B, Gaudric A, Massin P. Optical coherence tomography assessment of the vitreoretinal relationship in diabetic macular edema. Am J Ophthalmol. 2005;139(5):807–13. doi: 10.1016/j.ajo.2004.12.084. [DOI] [PubMed] [Google Scholar]
- 17.Huang D, Swanson EA, Lin CP, et al. Optical coherence tomography. Science. 1991;254(5035):1178–1181. doi: 10.1126/science.1957169. [DOI] [PMC free article] [PubMed] [Google Scholar]
- 18.Koizumi H, Spaide RF, Fisher YL, Freund KB, Klancnik JM, Jr, Yannuzzi LA. Three dimensional evaluation of vitreomacular traction and epiretinal membrane using spectral-domain optical coherence tomography. Am J Ophthalmol. 2008;145(3):509–517. doi: 10.1016/j.ajo.2007.10.014. [DOI] [PubMed] [Google Scholar]
- 19.Chang LK, Fine HF, Spaide RF, Koizumi H, Grossniklaus HE. Ultrastructural correlation of spectral-domain optical coherence tomographic findings in vitreomacular traction syndrome. Am J Ophthalmol. 2008;146(1):121–127. doi: 10.1016/j.ajo.2008.03.001. [DOI] [PMC free article] [PubMed] [Google Scholar]
- 20.Johnson MW. Posterior vitreous detachment: evolution and complications of its early stages. Am J Ophthalmol. 2010;149(3):371–382. e371. doi: 10.1016/j.ajo.2009.11.022. [DOI] [PubMed] [Google Scholar]
- 21.Barak Y, Ihnen MA, Schaal S. Spectral domain optical coherence tomography in the diagnosis and management of vitreoretinal interface pathologies. J Ophthalmol. 2012;2012:876472. doi: 10.1155/2012/876472. [DOI] [PMC free article] [PubMed] [Google Scholar]
- 22.Potsaid B, Baumann B, Huang D, et al. Ultrahigh speed 1050nm swept source/Fourier domain OCT retinal and anterior segment imaging at 100,000 to 400,000 axial scans per second. Opt Express. 2010;18(19):20029–20048. doi: 10.1364/OE.18.020029. [DOI] [PMC free article] [PubMed] [Google Scholar]
- 23.Itakura H, Kishi S, Li D, Akiyama H. Observation of posterior precortical vitreous pocket using swept-source optical coherence tomography. Invest Ophthalmol Vis Sci. 2013;54(5):3102–3107. doi: 10.1167/iovs.13-11769. [DOI] [PubMed] [Google Scholar]
- 24.Stanga PE, Sala-Puigdollers A, Caputo S, et al. In vivo imaging of cortical vitreous using 1050-nm swept-source deep range imaging optical coherence tomography. Am J Ophthalmol. 2014;157(2):397–404. e2. doi: 10.1016/j.ajo.2013.10.008. [DOI] [PubMed] [Google Scholar]
- 25.Schaal KB, Pang CE, Pozzoni MC, Engelbert M. The Premacular Bursa’s Shape Revealed In Vivo Using Swept Source Optical Coherence Tomography. Ophthalmology. 2014;121(5):1020–8. doi: 10.1016/j.ophtha.2013.11.030. [DOI] [PubMed] [Google Scholar]
- 26.Liu JJ, Witkin AJ, Adhi M, et al. Enhanced Vitreous Imaging in Healthy Eyes Using Swept Source Optical Coherence Tomography. PLoS One. 2014;9(7):e102950. doi: 10.1371/journal.pone.0102950. [DOI] [PMC free article] [PubMed] [Google Scholar]
- 27.Muqit MM, Stanga PE. Swept-source optical coherence tomography imaging of the cortical vitreous and the vitreoretinal interface in proliferative diabetic retinopathy: assessment of vitreoschisis, neovascularisation and the internal limiting membrane. Br J Ophthalmol. 2014;98(7):994–7. doi: 10.1136/bjophthalmol-2013-304452. [DOI] [PubMed] [Google Scholar]
- 28.Kraus MF, Potsaid B, Mayer MA, et al. Motion correction in optical coherence tomography volumes on a per A-scan basis using orthogonal scan patterns. Biomed Opt Express. 2012;3(6):1182–1199. doi: 10.1364/BOE.3.001182. [DOI] [PMC free article] [PubMed] [Google Scholar]
- 29.Simunovic MP, Hunyor AP, Ho IV. Vitrectomy for diabetic macular edema: a systematic review and meta-analysis. Can J Ophthalmol. 2014;49(4):188–95. doi: 10.1016/j.jcjo.2013.11.012. [DOI] [PubMed] [Google Scholar]
- 30.Sebag J. Vitreoschisis. Graefes Arch Clin Exp Ophthalmol. 2008;246(3):329–332. doi: 10.1007/s00417-007-0743-x. [DOI] [PMC free article] [PubMed] [Google Scholar]
- 31.Gupta V, Arevalo JF. Surgical Management of Diabetic Retinopathy. Middle East Afr J Ophthalmol. 2013;20(4):283–292. doi: 10.4103/0974-9233.120003. [DOI] [PMC free article] [PubMed] [Google Scholar]
- 32.Bishop PN, Holmes DF, Kadler KE, McLeod D, Bos KJ. Age-related changes on the surface of vitreous collagen fibrils. Invest Ophthalmol Vis Sci. 2004;45(4):1041–6. doi: 10.1167/iovs.03-1017. [DOI] [PubMed] [Google Scholar]
- 33.Itakura H, Kishi S. Alterations of posterior precortical vitreous pockets with positional changes. Retina. 2013;33(7):1417–20. doi: 10.1097/IAE.0b013e31827d262a. [DOI] [PubMed] [Google Scholar]