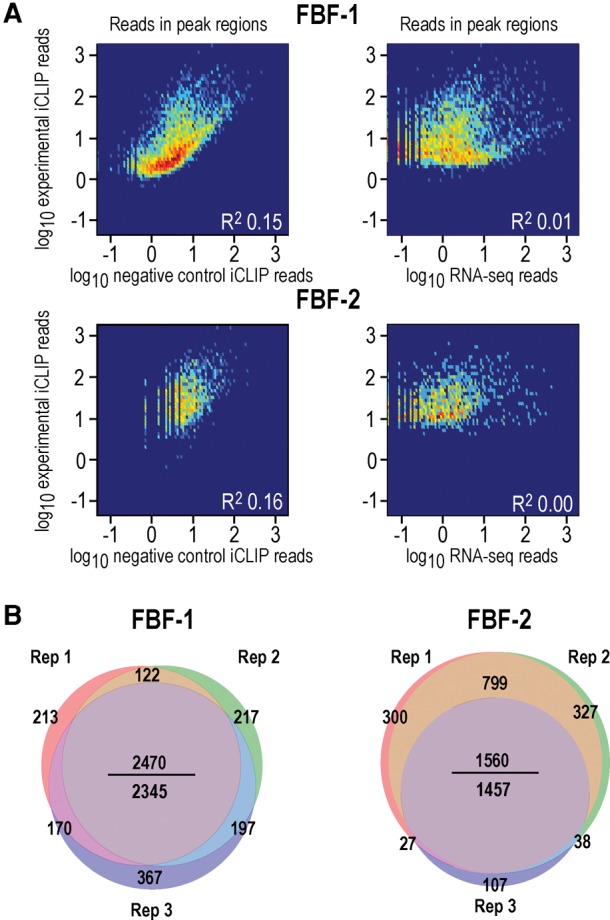
FIGURE 3.

FBF-1 and FBF-2 iCLIP is specific and reproducible. (A, left) Heatmaps of FBF iCLIP peak heights (y-axis) versus negative control iCLIP peak heights in the same regions (x-axis). In these heatmaps, the secondary filter of minimum iCLIP enrichment ratio was not applied, so that the full range of experimental and negative control peaks is visible. Overall, the correlations are low (R2 = 0.15–0.16), indicating that experimental peaks are distinct from background reads. (Right) Heatmaps of FBF iCLIP peak heights (y-axis) versus RNA-seq coverage in the same regions (x-axis). FBF iCLIP captured binding over a large range of RNA expression levels. Some iCLIP peaks were positively correlated to RNA abundance. This could reflect that peak heights are a function of both binding affinity and RNA abundance (Kishore et al. 2011). (B) Venn diagrams depict overlap of targets in three biological replicates of FBF-1 iCLIP (left) and three biological replicates of FBF-2 iCLIP (right). Targets are highly reproducible. In the middle of each Venn, the number above the line is total number of overlapping targets in all three replicates and the number below the line is the more stringent total number of overlapping targets after requiring that the same peak region on a target be identified in all the replicates. Our analysis used the more stringent bottom number.
