

In this study, Wahba et al. investigate how and where DNA–RNA hybrids, which form when an RNA molecule hybridizes to the complementary genomic locus, appear throughout the genome. They present a novel whole-genome method, S1-DRIP-seq, for mapping hybrid-prone regions in S. cerevisiae and identify the first global genomic features that play a causal role in R-loop formation in yeast.
Keywords: DNA:RNA hybrids, R loops, transcription, polyA tracts, RNase H
Abstract
R loops form when transcripts hybridize to homologous DNA on chromosomes, yielding a DNA:RNA hybrid and a displaced DNA single strand. R loops impact the genome of many organisms, regulating chromosome stability, gene expression, and DNA repair. Understanding the parameters dictating R-loop formation in vivo has been hampered by the limited quantitative and spatial resolution of current genomic strategies for mapping R loops. We report a novel whole-genome method, S1-DRIP-seq (S1 nuclease DNA:RNA immunoprecipitation with deep sequencing), for mapping hybrid-prone regions in budding yeast Saccharomyces cerevisiae. Using this methodology, we identified ∼800 hybrid-prone regions covering 8% of the genome. Given the pervasive transcription of the yeast genome, this result suggests that R-loop formation is dictated by characteristics of the DNA, RNA, and/or chromatin. We successfully identified two features highly predictive of hybrid formation: high transcription and long homopolymeric dA:dT tracts. These accounted for >60% of the hybrid regions found in the genome. We demonstrated that these two factors play a causal role in hybrid formation by genetic manipulation. Thus, the hybrid map generated by S1-DRIP-seq led to the identification of the first global genomic features causal for R-loop formation in yeast.
R loops have emerged as prominent genomic feature in many organisms, from bacteria to humans (Santos-Pereira and Aguilera 2015). R loops form when an RNA molecule anneals to a homologous DNA sequence in the genome, generating a region of DNA:RNA hybrid and a displaced ssDNA. R loops can act as precursors to genomic instability, modulators of gene expression, and regulators of chromatin epigenetic marks (Huertas and Aguilera 2003; Li and Manley 2005; Nakama et al. 2012; Castellano-Pozo et al. 2013; Sun et al. 2013; Wahba et al. 2013). Given the centrality of R loops in many genomic functions, the precise mapping of where they form and understanding why they form are important biological questions.
The ability to map R loops was made feasible by the discovery of the S9.6 monoclonal antibody, which specifically recognizes DNA:RNA hybrids (Boguslawski et al. 1986; Hu et al. 2006). This antibody has been used in three different genome-wide studies to map R loops. The first, by Chédin and colleagues (Ginno et al. 2012, 2013), used S9.6 to precipitate DNA:RNA hybrids from mammalian genomic DNA fractions digested with restriction endonucleases. These studies revealed that R loops are highly correlated with unmethylated CpG island promoters exhibiting a strong strand asymmetry in the distribution of guanines and cytosines (GC skew). Their work provided an excellent paradigm for use of the S9.6 antibody to probe for hybrids genome-wide, thereby revealing a potential new biological function of R loops. However, the limited spatial resolution associated with the methodology may have precluded the discovery of additional hybrid-forming features.
The other two studies mapped hybrids in the genome of the budding yeast Saccharomyces cerevisiae, a particularly powerful model used to identify and characterize factors that modulate R-loop formation (Luna et al. 2005; Mischo et al. 2011; Wahba et al. 2011; Stirling et al. 2012). Hybrids were isolated by immunoprecipitation from cross-linked and sonicated whole-cell extracts followed by high-throughput sequencing (ChIP [chromatin immunoprecipitation] sequencing [ChIP-seq]) or hybridization to tiling arrays (DRIP [DNA:RNA immunoprecipitation]-chip) (Chan et al. 2014; El Hage et al. 2014). These two genomic methods corroborated previous results from quantitative PCR (qPCR)-based studies that hybrids formed preferentially at ribosomal DNA (rDNA) and telomeres (El Hage et al. 2010; Balk et al. 2013). However, marked differences between the two genome-wide studies and previous work on R loops in yeast were observed. For example, the DRIP-chip study inferred that a large portion of the nuclear genome (around one-third) is prone to hybrid formation, while the ChIP-seq study suggested that a small fraction of loci could form hybrids; notably, transfer RNAs (tRNAs), rDNA, and a few highly expressed genes. Furthermore, both studies failed to detect major differences between wild-type and RNase H-defective cells. RNase H1 and RNase H2 are highly conserved through evolution and have the unique ability to dismantle R loops through degradation of the RNA in hybrids (Arudchandran et al. 2000). Cytological data of rnh1Δrnh201Δ cells pointed to widespread elevation of DNA:RNA hybrids in the nuclear genome relative to wild-type cells (Wahba et al. 2011; Chan et al. 2014). However, in the ChIP-seq and DRIP-chip studies, the total number and level of hybrid regions in wild type were comparable with those in RNase H mutants. With the exception of tRNA genes, hybrid regions appeared refractory to the presence of RNase H. The discrepancies between the two genomic studies as well as previous data likely resulted from inherent limitations in the methodologies that caused low hybrid signal to background noise. These limitations also precluded these studies from identifying factors dictating hybrid formation.
Here we present a new S1-DRIP-seq (S1 nuclease DRIP with deep sequencing) method for mapping hybrids in budding yeast that dramatically improves the signal to noise ratio at hybrid regions. This method allows for quantitative recovery of R loops and precise mapping of hybrid locations, allowing us to elucidate the parameters and sequence features that predispose parts of the genome to R-loop formation in vivo. We identified ∼800 hybrid-prone regions in addition to rDNA, Ty retrotransposons, and telomeres. We assessed their correlation with various aspects such as RNA function (messenger RNA [mRNA], tRNA, and noncoding RNA [ncRNA]), transcription levels, base composition, base skew, and DNA sequence. Using these correlative studies, we discovered and, through genetic manipulations, validated two features—high expression levels and polyA tracts—as causal determinants for hybrid formation that account for a large fraction of hybrids in the yeast genome.
Results
Development of S1-DRIP methodology
Our modified DRIP method, called S1-DRIP, allows for the quantitative recovery of R loops while maintaining the high-resolution mapping capability of standard ChIP-seq (Fig. 1A). Using a rapid dot blot R-loop assay (Supplemental Fig. S1.1A; Powell et al. 2013; Wahba et al. 2013), we monitored R-loop levels during standard ChIP-seq methods. We discovered that sonication via acoustic shearing of yeast genomic DNA led to loss of ∼80% of genomic R loops (Fig. 1B; Supplemental Fig. S1.1B). The use of cross-linking agents or an alternative fragmentation protocol with nonspecific nucleases did not abrogate this loss (data not shown). We speculated that the energy introduced by sonication promoted branch migration, causing the displacement of the RNA and reannealing of the ssDNA molecules. If so, S1 nuclease digestion of R loops’ displaced ssDNA strand (Vogt 1973) might stabilize the DNA:RNA hybrids through the sonication process. We used the dot blot assay to determine the amount of S1 nuclease that would sufficiently preserve DNA:RNA hybrids during sonication without impinging on initial hybrid levels. Treatment with optimized levels of S1 nuclease allowed the majority of DNA:RNA hybrids to survive through sonication (Fig. 1B; Supplemental Fig. S1.1B,C).
Figure 1.
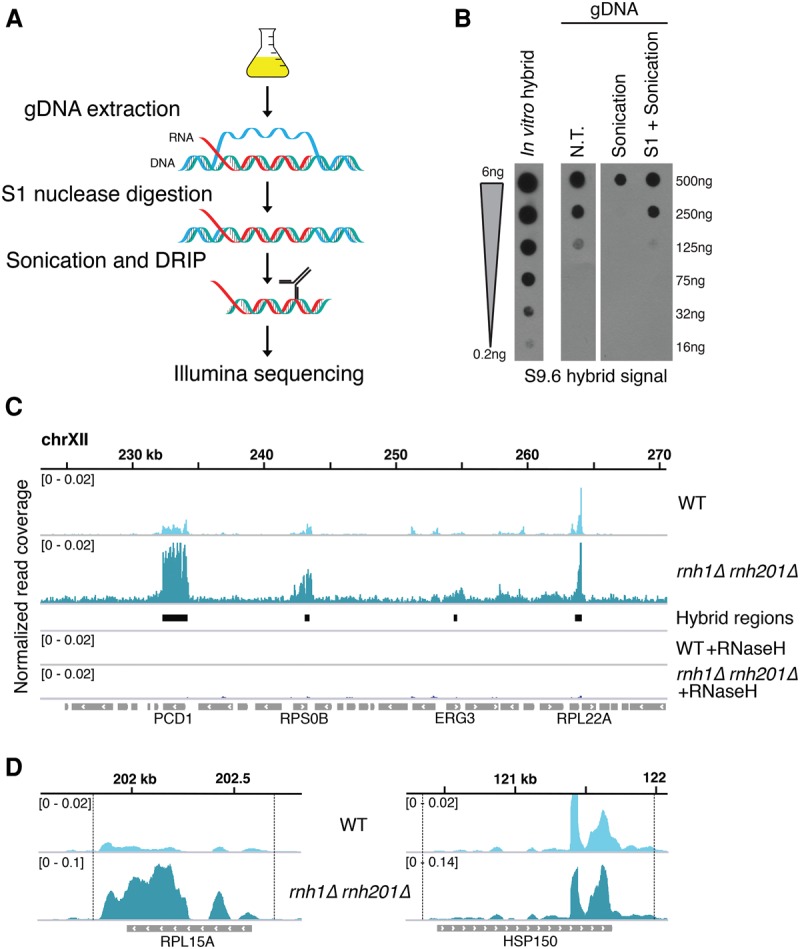
S1-DRIP-seq allows quantitative recovery and high-resolution mapping of R loops. (A) Overview of S1-DRIP-seq workflow. Genomic DNA (gDNA) was prepared from log phase cells. Hybrids were stabilized by treatment with S1 nuclease, which preferentially degraded single-stranded nucleic acids prior to sonication. Hybrids were then immunoprecipitated with S9.6 α-DNA:RNA hybrid antibody, and sequencing libraries were prepared. (B) Dot blot showing the effect of S1 treatment on genomic R loops. The first lane shows serial dilutions of an in vitro synthesized DNA:RNA hybrid. Yeast genomic DNA was either not treated (N.T.), sonicated (sonication), or treated with S1 nuclease prior to sonication (S1+Sonication), and serial dilutions were spotted and probed with the S9.6 antibody. (C) Snapshot of S1-DRIP-seq reads on chromosome XII (223,000–271,000). Normalized read coverage from wild type and rnh1Δ rnh201Δ are shown in the first and second rows, respectively, with the model-based analysis of ChIP-seq (MACS2)-identified hybrid regions denoted below. The forth and fifth rows show reads from wild-type (WT) and rnh1Δrnh201Δ genomic DNA treated with RNase H in vitro prior to immunoprecipitation. The sixth row shows features annotated in the Saccharomyces Genome Database, with features overlapping with hybrid regions indicated below. (D) Snapshots of two hybrid-associated features—RPL15A (left panel) and HSP150 (right panel)—from wild type and rnh1Δ rnh201Δ. Note the change in axes done to allow a better display of peak shapes in both wild type and rnh1Δrnh201Δ.
To test whether the structure of S1-treated R loops would affect sequencing results, we devised a synthetic spike-in mimicking the structure (Supplemental Fig. S1.2A). Immunoprecipitation of the spike-in using the S9.6 antibody followed by ligation of barcoded Illumina adaptors and sequencing led to a 40%–60% distribution of reads on the plus and minus strand (Supplemental Fig. S1.2B), comparable with standard results (Landt et al. 2012). Successful capture of both strands indicated that the plus strand was extended during end repair to form a more canonical dsDNA substrate for sequencing (Supplemental Fig. S1.2A,B,C). We conclude that DNA fragments resulting from S1-DRIP are efficient substrates for sequencing and show little sequencing bias stemming from their nonstandard structure.
We applied our optimized S1-DRIP methodology to wild-type and rnh1Δrnh201Δ cells and then subjected it to deep sequencing to survey hybrid formation genome-wide (S1-DRIP-seq). S1-DRIP-seq was done in quadruplicate for each genotype and, to ensure target specificity, was also done in parallel on genomic DNA treated in vitro with RNase H as control (Fig. 1C; Supplemental Fig. S1.3A,B). Reads were aligned to the reference genome using the Bowtie2 algorithm; hybrid-prone regions were identified in uniquely mapped reads using the model-based analysis of ChIP-seq (MACS2) peak-calling algorithm. Sequenced reads were normalized to the genome-wide mean across all nonpeak regions, and regions reported here as hybrid-prone and used in our analyses were identified in at least three of the four biological replicates. The distribution of sequence reads observed at genomic hybrid regions was as predicted based on the spike-in sequencing results (Supplemental Fig. S1.4).
Overall, the sequence read densities of peak regions identified by S1-DRIP-seq were significantly enriched over immunoprecipitation background, which enabled detection of distinct sites of R-loop formation at high base-pair resolution in the nuclear genome (Fig. 1C,D; Supplemental Fig. S1.5A). The pattern and relative strength of a subset of peaks were validated by S1-DRIP followed by qPCR analysis (DRIP-qPCR) (Supplemental Fig. S1.6A,B). To eliminate the possibility of methodology-based artifacts, several hybrid regions were also verified throughout this work using a second DRIP methodology relying on restriction enzyme fragmentation (RE-DRIP-qPCR) in place of S1 treatment and sonication. The high signal to noise ratio in the S1-DRIP-seq data was a significant improvement on the data obtained by ChIP-seq and DRIP-chip experiments that had likely led to the underestimation and overestimation of the number of hybrid-prone sites, respectively (Supplemental Fig. S1.5A). The signal from hybrid-forming regions was sensitive to RNase H treatment (Fig. 1C), and quantitative increases in level of hybrids were detected at many loci in the nuclear genome of rnh1Δrnh201Δ relative to wild type (Fig. 1C; Supplemental Fig. S1.5A,B). Improvement of both the spatial and quantitative mapping of hybrids provided by our S1-DRIP-seq methodology demonstrated its utility for identifying features linked to hybrid formation genome-wide.
Genomic distribution of DNA:RNA hybrids
We next examined the overall distribution of hybrids in wild-type and rnh1Δrnh201Δ cells. With our S1-DRIP-seq data set, MACS2 identified 781 hybrid-prone regions in rnh1Δrnh201Δ cells, all of which overlapped with hybrid regions in wild type (Supplemental Tables 1, 2). These common hybrid regions had a significance of enrichment >0.05, and almost all were associated with annotated features (Supplemental Fig. S2.1A; Supplemental Table 3). Overall, 8% of the yeast genome was susceptible to significant hybrid formation (Fig. 2A). Taken together with the increased hybrid levels in rnh1Δrnh201Δ cells compared with wild-type cells, these results suggest that hybrids form at many loci in wild-type cells, but their levels are kept in check by RNase H.
Figure 2.

Genomic distribution of hybrid-prone regions. (A) The percentage of base pairs in the genome prone to hybrid formation in rnh1Δrnh201Δ and the breakdown relative to repetitive (rDNA and Ty/Delta) and nonrepetitive (unique) regions. (B) Hybrid-prone features. The proportion of major genome features identified as hybrid-prone. The dotted line indicates the proportion of all features identified as hybrid-prone (9.6%). P-values were generated by a one-tailed Fisher's test. (**) P < 0.001. (C) Snapshots of representative hybrid-enriched features from rnh1Δ rnh201Δ. From left to right and top to bottom: rDNA (RDN37-1, chromosome XII, 450,000–460,000), Ty element (YDRCTy1-1, chromosome IV, 645,000–652,000), telomere (TEL01L-TR, chromosome I, 0–400), small nucleolar RNA (snoRNA) (SNR128 and SNR190, chromosome X, 139,000–140,500), tRNA [tA(AGC)F, chromosome VI, 204,500–205,5000], and protein-coding ORF (TPI1, chromosome IV, 555,000–557,000).
The regions identified represent the strongest occurrences of hybrids in the genome, and it is possible that weaker or more transient hybrids occurred elsewhere but were missed by our analyses. Indeed, MACS2 identified additional weak hybrid regions (less than twofold enriched over background) in wild-type cells but not in rnh1Δrnh201Δ cells, which were associated with an additional 211 features (Supplemental Table 4). These weak hybrid sites may reflect regions that are present only in wild-type cells or regions that are underrepresented in the S1-DRIP-seq analysis of rnh1Δrnh201Δ cells due to insufficient sequence depth. Even including these weak hybrid regions, the portion of the genome covered by hybrids increased to only 12%. Thus, even with this relaxed stringency, most transcripts failed to lead to detectable hybrid formation. Due to our uncertainty in the additional weak hybrid regions, we focused our analyses on only those ∼800 strongest hybrid regions shared between wild-type and rnh1Δrnh201Δ cells.
We next sought to investigate the pattern of hybrid formation at various representative hybrid-prone regions in the genome. The majority of hybrid-prone regions occurred at repetitive DNA elements: Ty1 retrotransposon elements and the rDNA cluster (Fig. 2A). In rnh1Δrnh201Δ cells, the highest hybrid signals were detected at full-length Ty1 and Delta elements (Fig. 2C; Supplemental Fig. S2.2A). On average, the signal observed within Ty1 elements and Deltas with S1-DRIP-seq was 100–200 times over mean background; similar results were obtained with S1-DRIP-qPCR (Supplemental Fig. S2.3A). The signal from Ty1 elements was RNase H-sensitive and four to eight times lower in the wild-type cells relative to rnh1Δrnh201Δ cells (Supplemental Fig. S2.3A). Notably, Ty1 retrotransposons replicate through reverse transcription of a Ty1 mRNA into a cDNA, a process that produces an obligate mRNA:cDNA hybrid intermediate. To assess whether hybrids occurred at genomic Ty1 loci or whether the signals came in part or wholly from Ty1 mRNA:cDNA hybrid molecules, we performed S1-DRIP-qPCR with primer sets spanning unique genomic DNA (Supplemental Fig. S2.3B). All seven Ty repeats tested revealed a significant level of hybrids in rnh1Δrnh201Δ cells. Furthermore, hybrids were detected at these genomic Ty repeats with RE-DRIP-qPCR (Supplemental Fig. S2.4A,B). Taken together, our results demonstrated that hybrids form at Ty elements in the genome of wild-type cells, but their levels are kept low by RNase H.
Hybrid regions were also strongly enriched for genes encoding structural RNAs. Hybrids at the rDNA locus accumulated over the polymerase I transcribed 35S rRNA and the polymerase III 5S rRNA transcript (Fig. 2C; Supplemental Fig. S2.5). At the 35S rRNA locus, a long primary transcript is rapidly processed into three mature rRNA transcripts through the elimination of transcribed spacer regions (Henras et al. 2015). We found similar hybrid levels accumulated at the regions coding for mature transcripts and the transcribed spacers, an indication that these hybrids were not likely to have formed artifactually after lysis with processed rRNA transcripts (Supplemental Fig. S2.2B). Note that the normalized read coverage value over the rDNA is amplified because of the tandem repeat nature of the locus and that the hybrid signal at each rDNA repeat in the absence of RNase H is actually similar to that at other hybrid-prone features in the genome (Fig. 2C).
Of the 781 hybrids mapping to unique regions that were identified with MACS2, 120 overlapped with tRNAs, five overlapped with ncRNAs, 55 overlapped with small nuclear/small nucleolar RNAs (sn/snoRNAs), and 18 overlapped with telomeres (Supplemental Table 3). The frequent presence of hybrids in these classes of structural RNAs represented a significant enrichment and confirmed a propensity for hybrid formation in these genomic features (Fig. 2B). At tRNAs and sn/snoRNAs, the pattern of R-loop formation is tightly associated with the transcribed region (Fig. 2C; Supplemental Fig. S2.6). Finally, extensive R-loop formation was also detected in the mitochondrial genome (Supplemental Fig. S2.7). The fact that RNAs transcribed by RNA polymerases I, II, and III and that mitochondrial RNA polymerases exhibit R loops demonstrates that hybrid formation is not a unique property of a specific RNA polymerase. While the different structural and mitochondrial RNAs might have different characteristics predisposing them to hybrid formation, they all share a common attribute, which is high levels of transcription.
High gene expression as a determinant of DNA:RNA hybrid formation
To address the potential role of the expression level in hybrid formation, we analyzed the 477 hybrid-prone ORFs identified in S1-DRIP-seq. These ORFs spanned a wide range of gene expression levels. The previously published DRIP-chip study reported that ORFs with hybrids tended to have higher transcription frequency (Chan et al. 2014). While informative, this correlation did not address whether high gene expression was critical to initiate hybrid formation. To further investigate the link between hybrid formation and gene expression, we rank-ordered the expression level of all yeast ORFs based on transcript abundance, divided them into 20 expression categories, and cross-compared them with hybrid-forming regions (van Dijk et al. 2011). Forty-two percent of the ORF-associated hybrid regions were in ORFs in the two highest expression categories, an approximately four times enrichment over expected if hybrid formation was independent of transcription levels (Fig. 3A). Each of the remaining 18 expression categories contained ∼3% of the hybrid regions. Thus, hybrid-forming regions were much more likely to occur in ORFs in the two highest expression categories.
Figure 3.

High gene expression drives DNA:RNA hybrid formation. (A) The percentage of ORFs prone to hybrid formation in each expression category. Yeast ORFs were divided into 20 categories based on their expression (FPKM [fragments per kilobase per million mapped fragments]), and each bar indicates the percentage of all hybrid-prone ORFs found in each expression category. The dotted line at 5% indicates the value expected if the hybrid-containing ORFs were uniformly distributed. P-values were generated by a one-tailed Fisher's test. (B) The percentage of ORFs in each expression category that overlaps a hybrid. The dotted line is positioned at the expected value (7.4%). P-values were generated by a one-tailed Fisher's test. (C) Hybrid signal measured by DRIP-qPCR at ectopic highly expressed genes. Two different hybrid-forming regions—a Ty1 retrotransposon and HSP150 gene—cloned onto a yeast artificial chromosome (YAC) still form hybrids. “A” and “B” represent the amplicons in the flanking regions of the gene integration locus, while “C” is a control amplicon further downstream. (D) Hybrid signal measured by DRIP-qPCR upon gene overexpression. Induction of expression with galactose (Gal; hatched bars) promotes hybrid formation at the endogenous GAL7 gene and at the ectopic SMC3 locus when under the control of the Gal promoter. “B” represents a control amplicon showing background signal.
As a second assessment, we determined the percentage of ORFs in each expression category that formed hybrids (Fig. 3B). Nearly 46% of ORFs in the highest expression category and 17% of the second highest category formed hybrids. In contrast, ≤6% of ORFs in each of the remaining expression categories formed hybrids. This striking correlation was strengthened when we relaxed the stringency for calling hybrid-prone regions to include those identified in two out of four biological replicates and also accounted for hybrids present in duplicated genes that had previously fallen into the repetitive DNA category. Under these conditions, hybrid regions were detected in 82% and 42% of ORFs in the highest and second highest expression categories, respectively (Supplemental Table 5). In contrast, few additional hybrid-prone ORFs were identified in the other expression categories. Taken together, these analyses revealed that the two highest expression categories are highly predictive of whether ORFs form hybrids. ORFs in the 18 remaining expression categories span over three orders of magnitude of expression level, yet there is no correlation with hybrid formation. We conclude that when gene expression levels exceed a certain threshold, transcription itself becomes a determinant of hybrid formation. For genes transcribed below that threshold, additional factors other than transcription level must be involved in hybrid formation.
To test whether high expression alone is sufficient to drive hybrid formation, we introduced two highly expressed hybrid regions—a Ty element and HSP150—onto a yeast artificial chromosome (YAC). To specifically measure hybrid formation at these ectopic YAC locations, we digested the genomic DNA with restriction enzymes prior to conducting DRIP-qPCR with primers unique to the YAC sequences flanking the gene integration site (Fig. 3C). The level of hybrids increased dramatically on the YAC containing the ectopic genes as compared with the YAC alone. These results are consistent with high levels of gene transcription driving hybrid formation independently of genomic context.
The robust correlation between high transcription levels and hybrid formation implied a causal relationship between them. To directly assess potential causality, we tested whether low-expressed genes with no detectable hybrids would form hybrids when expression levels were increased using an inducible gene expression system. Two genes were assayed independently: the native galactose (Gal)-inducible GAL7 gene and an ectopic SMC3 gene driven by the Gal-inducible GAL1-10 promoter. Under repressed conditions in which Gal-inducible genes are poorly expressed (Cloutier et al. 2013), both GAL7 and SMC3 failed to generate hybrids (Fig. 3D). However, when levels of expression were pushed above the hybrid-associated threshold by growth in Gal, hybrids were detected in both GAL7 and SMC3 but not at a control locus (Fig. 3D; Supplemental Fig. S3). These results corroborated that high transcription levels are causative in hybrid formation and are likely a major determinant of hybrid formation in the yeast genome, as highly transcribed ORFs account for nearly 25% of all hybrid regions.
Asymmetric distribution of hybrid regions on transcription units
Metagene analysis of all 477 hybrid-prone ORFs indicated that hybrids were distributed along the length of transcription units, with a slight peak in signal at the 5′ end and a distinctly higher density of reads occurring at the 3′ end of genes (Fig. 4A; Supplemental Fig. S4.1A). Positional biases in hybrid distribution were also apparent when we observed individual hybrid patterns in the heat map: Genes in the top third of the heat map had hybrid regions extended over entire transcripts, while, in the bottom third of the heat map, hybrid regions appeared to be limited to either the 5′ or 3′ end. This was consistent with our observation that ∼70% of the regions prone to hybrid formation span ≤500 base pairs (bp) and overlap less than half of an ORF (Supplemental Fig. S4.1B–D).
Figure 4.

The distribution of hybrids at ORFs. (A) The distribution of hybrid signal at hybrid-prone genes in rnh1Δrnh201Δ. ORFs are aligned from transcription start site (TSS) to transcription end site (TES) and plotted ±1 kb. The metagene plot displays the median read counts over all hybrid-prone ORFs and reveals the accumulation of hybrids over the transcription unit, with a slightly higher signal near the 3′ end. The heat map displays the hybrid signal along individual ORFs, sorted according to total signal strength. (B) Hybrid-prone ORFs with asymmetric hybrid signals. Genes with asymmetric hybrid formation have a signal greater than twofold over gene average in the 5′-most or 3′-most 10% of the gene. Metagene plots and heat maps show the global median read count and the hybrid signal, respectively, at individual genes with 5′ and 3′ of ORF hybrids. The right panel shows the remaining hybrids that did not meet the criteria for the 5′ or 3′ of ORF category. (C) Asymmetric hybrid formation. Snapshots of representative ORFs with asymmetric hybrid signals 5′ of ORF (top panel) and 3′ of ORF (bottom panel) from rnh1Δ rnh201Δ. (D) The proportion of each asymmetric category and the remaining genes that is in either the highest two expression categories (high, FPKM of 1000–150) or all the remaining lower expressed categories (medium–low, FPKM of 150–0.1). P-values were generated by a χ2 test relative to the distribution for all hybrid-prone genes.
To quantitatively assess the potential asymmetric distribution of hybrids, we looked for biases in the density of reads along the lengths of hybrid-prone ORFs. Each transcription unit was divided into 10 equal bins, and ORFs with a read density in the 5′-most or 3′-most terminal bin twofold greater than the average number of reads over the remaining bins were designated 5′ of ORF and 3′ of ORF, respectively. Twenty-five percent (102) of the hybrid regions were in either the 5′ category or the 3′ category (Fig. 4B). Representative examples of 5′ of ORF and 3′ of ORF hybrid regions are shown in Figure 4C. In the remainder category that did not meet our stringent definition, ∼19% of hybrid regions extended over the entire ORF transcription unit (Supplemental Fig. S4.1B). Other hybrid regions showed asymmetry that extended beyond the most terminal bins or was internal to the ORF and sufficiently varied that it was not possible to define any additional specific categories. Overlay of the hybrid location analysis with expression levels revealed that ORFs with 5′ and 3′ hybrids were mostly in the medium–low expression level, encompassing the bottom 18 expression categories (Fig. 4D). Heat maps of the hybrid-prone ORFs categorized by expression level corroborated this, as ORFs in the two highest expression categories appeared to have more uniformly distributed hybrid regions (Supplemental Fig. S4.2). Therefore, hybrids in highly expressed regions above the threshold needed for expression levels to trigger hybrid formation were significantly underrepresented in the 5′ and 3′ categories. This anti-correlation suggested that features that caused the 5′ and 3′ asymmetry were distinct from high level of expression and might contribute to hybrid propensity in lowly expressed genes.
Sequence features of hybrid-prone regions
The propensity for DNA:RNA hybrids to form and persist in vitro is influenced by pyrimidine/purine content and distribution (Shaw et al. 2008). In human cells, genomic regions with GC skew are prone to hybrid formation (Ginno et al. 2012). With these studies in mind, we investigated the base content and distribution in the ORF-associated hybrid regions identified by our S1-DRIP-seq. We began by comparing the GC content of hybrid-prone ORFs in the different expression categories with their nonhybrid counterparts. No significant differences were observed except in the highest expression category, where the median GC content for hybrid-prone ORFs was slightly higher than that of nonhybrid ORFs (Supplemental Fig. S5.1A). Thus, GC content along with expression level might have contributed to hybrid formation in a subset of highly expressed genes but was unlikely to be an important determinant for most of the hybrid-prone regions. With the exception of hybrids in telomeric regions, which occurred largely over the terminal TG1–3 repeats, no evidence of a significant GC skew pattern was found at hybrid-prone regions (Supplemental Fig. S5.1B,C), as expected given the overall low GC skew observed in yeast genes (McLean and Tirosh 2011).
Next, we looked for the presence of AT skew in hybrid-prone regions. We found that regions associated with medium–low expression categories had a positive AT skew, leading to an enrichment of A bases in the coding strand (Fig. 5A). While it is known that most fungal species have considerable positive AT skew across the lengths of genes (McLean and Tirosh 2011), particularly in lower expression categories (Supplemental Fig. S5.2), the positive AT skew of hybrid-prone ORFs was still greater than expected (Supplemental Fig. S5.3). Moreover, within each ORF, the hybrid-forming regions tended to have significantly more positive AT skew than the non-hybrid-forming portions in the medium–low expression ORFs (Supplemental Fig. S5.4). These findings indicate that, at lower-expressed genes, positive AT skew resulting in an A-rich RNA strand and T-rich DNA template strand may confer a propensity for R loops to form or stabilize in the genome.
Figure 5.
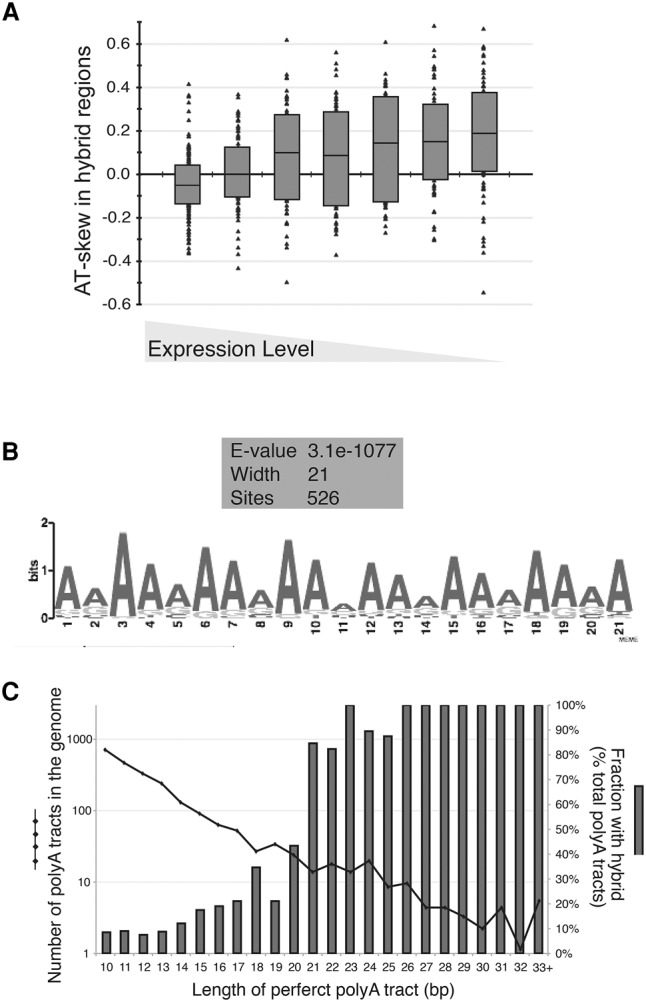
Positive AT skew and polyA tracts contribute to hybrid formation. (A) AT skew of ORF-associated hybrid regions. AT skew was calculated as (A − T)/(A + T) in each hybrid-prone region and was binned in the expression category of its associated ORF (expression categories were divided as 1, 2, 3–4, 5–8, 9–12, 13–16, and 17–20). Individual values are plotted along with the box plot showing the first quartile, median, and third quartile value for each expression category. (B) A common motif in hybrid-prone regions. The 779 identified hybrid-prone regions were analyzed by MEME for the presence of overrepresented motifs. MEME identified a 21-bp adenine-rich motif present in 526 of the 779 regions. (C) The occurrence of perfect polyA tracts and hybrids genome-wide. The length of the polyA tract is indicated on the X-axis. The number of polyAs of a given length present in the genome is represented by the black dotted line (left Y-axis), and the fraction overlapping a hybrid region is represented by the dark-gray bars (right Y-axis).
To expand our analyses beyond base composition/distribution to base sequence, we analyzed all 779 hybrid-prone regions in the nuclear genome for shared sequence motifs using MEME. This analysis identified a signature 21-bp A-rich tract (Fig. 5B) shared by 526 of the hybrid-prone regions; 352 of those tracts fell into ORF-associated hybrid-prone regions (Supplemental Table 6). The motif identified by MEME indicated that homopolymeric and near-homopolymeric dA:dT tracts were characteristic of hybrid regions. In budding yeast, homopolymeric dA:dT tracts (referred to here as polyA tracts) of ≥10 bp occur in the genome well above what is expected based on random chance (Fig. 5C; Dechering et al. 1998). Analyzing the association that polyA tracts of incremental length have with hybrid formation, we noted a sharp transition to near-perfect overlap for polyAs of ≥21 bp (Fig. 5C). In total, 102 perfect polyA tracts ≥21 bp were found in unique regions of the genome, and 94 of those fell within a hybrid-prone region (Supplemental Table 7). The propensity for R-loop occurrence at imperfect polyA tracts was also length-dependent (Supplemental Fig. S5.5A,B). We conclude that dA:dT tracts in the genome are strongly associated with R-loop occurrence, and perfect polyA tracts in particular are predictive of R-loop formation. Unexpectedly, we found that hybrid-prone regions with polyA tracts ≥21 bp tended to have lower AT skew over the total hybrid region as compared with those without (Supplemental Fig. S5.5C). This indicated that AT skew and polyA tracts may reflect two related but distinct modalities of R-loop formation in the genome.
PolyA tracts in DNA:RNA hybrid formation
The hybrid regions associated with polyA tracts revealed a consistent pattern in the distribution of the hybrid signal (Supplemental Fig. S6.1A). While the lengths of polyA-containing hybrid regions were similar to those of hybrid-prone regions lacking polyA tracts (Supplemental Fig. S6.1B), we noted a specific distribution of reads in the polyA regions. Relative to the direction of transcription, the frequency of polyA to polyT tracts occurring on the coding strand was 42%–58%, respectively. Regardless of strand orientation, the highest density of reads occurred 3′ of the adenine stretch (Fig. 6A; Supplemental Fig. S6.1A), and the distribution of reads suggested that R loops formed most strongly near rather than within the polyA sequence (Supplemental Fig. S6.1A). These data excluded the possibility that the hybrids were formed due to polyadenylated mRNAs annealing nonspecifically onto the homopolymeric dA:dT genomic region.
Figure 6.
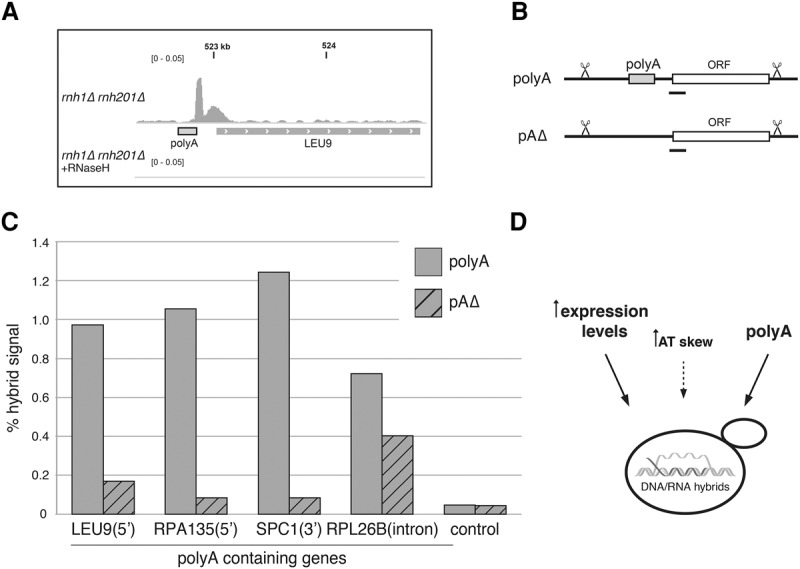
PolyA tracts directly affect hybrid formation. (A) PolyA-associated hybrid region. Snapshot of a representative polyA-associated hybrid 5′ of LEU9 showing the hybrid signal from rnh1Δ rnh201Δ (top) and rnh1Δrnh201Δ treated with RNase H in vitro (bottom). (B) Schematic of a locus containing a polyA tract (polyA) and a locus with a polyA tract seamlessly deleted (pAΔ). The locations of DRIP-qPCR amplicons are indicated with black bars. (C) Hybrid signal measured by DRIP-qPCR at polyA-containing genes. Hybrid signal was determined in rnh1Δrnh201Δ strains containing polyA tracts (solid bars) and deleted for the polyA (hatched bars) at the indicated genes. (D) Model of hybrid-promoting sequence features in yeast.
The near-perfect correlation of polyA tracts ≥21 bp with hybrid formation prompted us to directly test a potential causal role. To do this, we quantified the effect of deleting polyA tracts on hybrid levels from a subset of hybrid-prone regions. Note that 63 of the 94 polyA tracts ≥21 bp found in hybrid regions occurred in ORF-associated hybrids (Supplemental Table 7). Of those, we picked four genes encompassing different locations of the polyA tract in genes (intronic, 5′ untranslated region [UTR], or 3′ UTR) and various levels of expression. A representative polyA-containing hybrid is shown in Figure 6A. Hybrid levels were quantified in polyA-containing (polyA) and polyA-deleted (pAΔ) strains by RE-DRIP-qPCR (Fig. 6B; Supplemental Fig. S6.2A). Hybrid signals observed in polyA genes dropped to background levels in three of the four pAΔ strains (Fig. 6C; Supplemental Fig. S6.2B). In the ribosomal gene RPL26B, the signal only partially decreased. The residual hybrid formation was likely due to the fact that this gene was also among the highest-expressed genes, and, consequently, the high rate of transcription provided an additional mechanism for hybrid formation. Importantly, we detected no significant decrease in levels of expression by RT–PCR for the four genes after polyA deletion (Supplemental Fig. S6.2C). Thus, the polyA deletion impaired hybrid formation by mechanisms other than altering the mRNA expression of the associated gene. These data corroborate that polyA tracts directly contribute to the occurrence of hybrids and define them as a novel sequence feature causative for hybrid formation in the yeast genome.
Discussion
Here we presented S1-DRIP-seq, an improved methodology for mapping R loops genome-wide that facilitated the identification of features contributing to hybrid formation. S1-DRIP-seq allowed for quantitative recovery of R loops and improved the signal to noise ratio from previously published protocols (Chan et al. 2014; El Hage et al. 2014). With it, we identified nearly 800 distinct hybrid-prone regions. A subset of these hybrid-prone regions corroborated a number of findings from previous DRIP-chip and/or ChIP-seq studies, including the occurrence of hybrids at the mitochondria, rDNA locus, telomeres, Ty elements, and tRNA genes. Importantly, we also found significant differences from these methods in both the positions of hybrids and the amount of hybrids between strains. All hybrid-prone loci were detectable in wild-type cells, and their levels increased in the absence of RNase H. Our results reconcile the differences within previous genome-wide studies and their discordance with the cytological and cell biological data. Finally, we identified features that contribute to hybrid formation.
The detection of a large number of R loops in the genome posits an important question regarding their biological relevance. A growing body of evidence points to the functional importance of at least a subset of genomic R loops (Santos-Pereira and Aguilera 2015). Consistent with that, we found that R-loop formation in ORFs peaked at the 3′ end, near transcript termination sites. We also identified 102 R loops that occur exclusively at just the 3′ and 5′ of ORFs. In select yeast and human genes, R loops occurring near the 3′ and 5′ ends have been implicated in regulating transcription termination and transcriptional activation, respectively (Mischo et al. 2011; Skourti-Stathaki et al. 2011, 2014; Ginno et al. 2012; Boque-Sastre et al. 2015). Likewise, R loops identified in this study have the potential to impact transcription termination, gene activation, or gene repression. More detailed analysis of these hybrid-prone regions and the consequences of abrogating hybrid formation will be informative for determining additional functions for R loops in the control of gene expression.
Given the nearly global transcription of the yeast genome (David et al. 2006), the restriction of hybrid hot spots to just 8% of it indicates that hybrid formation is not a consequence of transcription alone but is helped by unique features in the RNA, DNA, and/or chromatin. What makes these regions particularly hybrid-prone? The extremely robust enrichment of hybrids in highly expressed loci implies that, for most, expression level is the major driver. Of hybrids associated with ORFs, 42% occurred in the 10% most highly expressed genes. Hybrids also occurred in the polymerase II-driven sn/snoRNAs, ncRNAs, and Ty1 elements; polymerase I-driven rDNA; polymerase III-driven tRNA and other genes; and, as previously noted by El Hage et al. (2014), the mitochondrial genome—all of which are highly expressed (Curcio et al. 1990; French et al. 2003; Pelechano et al. 2010; Turk et al. 2013; Jordán-Pla et al. 2015). High expression alone is sufficient for R-loop formation regardless of genomic context, as both the transposition of highly expressed genes to an artificial chromosome and overexpression of low transcribed ORFs caused R loops. These results can potentially explain why highly transcribed loci are hot spots for genomic rearrangements and mutation in cancer cells (Chiarle et al. 2011; Kim and Jinks-Robertson 2012): High levels of transcription result in hybrid accumulation, which makes those loci more susceptible to mutations and breaks.
We speculate that the propensity for hybrids to form at highly expressed regions is facilitated by two factors:
The availability of RNA molecules. The abundance of RNA may drive its bimolecular reaction with DNA, potentially facilitated by strand exchange factors (Wahba et al. 2013). An RNA concentration-dependent effect on hybrid formation has been documented in in vitro reactions with RecA-assembled R loops (Zaitsev and Kowalczykowski 2000).
The higher polymerase densities found at these genes, allowing for a more open chromatin conformation (Koerber et al. 2009). The nucleosome-depleted DNA would allow for the pairing of RNA with the DNA, which, once formed, is likely to be thermodynamically as stable as, or more stable than, the corresponding DNA duplex (Shaw et al. 2008). An obvious exception to this model occurs at low-expressed genes and, even more strikingly, telomeric regions at which hybrids form despite low RNA abundance and low polymerase II occupancy. In these regions, other factors may be promoting the formation or stabilization of the R loops.
In addition to high transcription rates favoring DNA:RNA hybrids, our S1-DRIP-seq analyses identified hybrid regions at polyA tracts ≥21 bp. PolyA tract-associated R loops were confirmed by S1-DRIP-qPCR and RE-DRIP-qPCR, eliminating the possibility that they are artifacts of the sequencing and/or methodology. Furthermore, a direct role was demonstrated by the successful abolishment of specific R loops upon deletion of their associated polyA tracts. This study revealed the first sequence-specific driver of R-loop formation in any organism.
Why do long polyA tracts cause R loops? PolyA tracts disfavor nucleosomes over them and the surrounding 100–150 bp due to their naturally rigid structure and through active recruitment of chromatin remodelers (Yuan 2005; Field et al. 2008; Wu and Li 2010; Chang et al. 2012; Lorch et al. 2014). Why polyA tracts of 21 bp, but not 19 bp, sharply stimulate hybrid formation is unclear; however, genome-wide analyses have established that the magnitude of nucleosome depletion is directly correlated with both the length and perfection of the polyA tract (Segal and Widom 2009). PolyA tracts can also act as ubiquitous promoter elements in a length-dependent manner (Struhl 1985; Iyer and Struhl 1995). Therefore, it is possible that polyA tracts ≥21 bp create an open DNA structure with sufficient transcription that leads to hybrid formation. Determining the specific RNA component driving hybrids in polyA-containing regions should shed light on the causes of polyA-dependent hybrids.
Deciphering a potential role for hybrids at polyA tracts is currently hindered by the long-standing mystery surrounding the role that long polyA tracts play in genome biology. The enrichment of long polyA tracts is a general feature of eukaryotic genomes (Dechering et al. 1998), but, despite their apparent conservation, the precise biological importance of polyA tracts in transcriptional control and/or overall chromatin organization remains an open question. In fact, we saw no significant reduction in gene expression upon deletion of polyA tracts at the individual loci tested in our study. Nevertheless, in vivo work has provided stronger evidence of a role for polyA tracts in fine-tuning nucleosome position, particularly at promoters, as a strategy for global transcriptional control (Kubik et al. 2015). Interestingly, hybrids formed at Gal-induced genes in yeast control expression by stimulating rapid transcription kinetics despite no effect on the genes’ final mRNA levels (Cloutier et al. 2016). Therefore, we can envision that hybrids formed at polyA tracts help tune gene responses, ensuring rapid adaptation to changing environments.
The genome-wide map of hybrids using S1-DRIP-seq identified high transcription levels and long polyA tracts as two causative features of hybrid formation that account for ∼60% of hybrid regions in the yeast genome. However, additional causative features and factors need to be identified. The correlation of a subset of hybrid regions with high positive AT skew may lead to one of those missing features. The high spatial and quantitative resolution of R loops obtained by S1-DRIP-seq will also be an invaluable tool in assessing the contributions of many factors to R-loop biology. For example, these maps will be fundamental in identifying the loci responsible for hybrid-driven genomic instability and consequently help decipher mechanisms underlying the conversion of R loops to breaks.
Materials and methods
Yeast strains, media, and reagents
The yeast strains and primers used are listed in Supplemental Table S8. Unless otherwise noted, yeast strains were constructed using classic yeast genetics techniques and grown in YEP supplemented with 2% glucose. For the Gal induction experiments, cells were grown overnight in YEP medium with 2% lactic acid and 3% glycerol and collected 3 h after addition of Gal at a final 2% concentration.
Dot blotting with S9.6 antibody
Dot blots were done as previously described (Wahba et al. 2013). The in vitro hybrid control was made by doing first strand cDNA synthesis using SuperScript III and random hexamers (Thermofisher) of total RNA isolated with the RNeasy minikit (Qiagen). The control hybrids were quantified using PicoGreen reagent (Thermo Scientific).
Genome-wide hybrid mapping with S1-DRIP-seq
For a detailed protocol of S1-DRIP, see the Supplemental Material. Immunoprecipitated or input DNA (60–100 ng) was used for each library prepared with the llumina Tru-Seq library kit according to Teytelman et al. (2013). Fifty-base-pair single-end read sequencing was performed by the Vincent J. Coates Genomics Sequencing Laboratory.
Bioinformatic analyses
Read alignment, peak calling, and normalization
Reads were aligned to the S. cerevisiae sacCer3 genome with Bowtie version 1.0.1 using default settings. Nonunique reads were randomly assigned to one location or, for the purposes of peak calling, disregarded. We used MACS2 to identify peaks in individual replicates, using the input DNA as control. Regions designated as hybrid-prone were sites common to at least three of the four biological replicates for each genotype. To compensate for differences between samples, reads were normalized to the geometric mean across nonpeak regions with DEseq (Anders and Huber 2010). For visualization, the aligned reads files (BAM) were converted to normalized coverage files (bigWig). Spearman correlation coefficients between replicates were calculated by bamCorrelate version 1.5.9.1 from deepTools using 1-kb bins.
Gene expression and annotations
Gene expression levels were quantitated using Cufflinks version 2.0.2 on publicly available RNA sequencing (RNA-seq) data (SRR122107). All corresponding gene annotations were obtained from the Saccharomyces Genome Database.
Metagene profiles and heat maps
Metagene plots and heat maps were generated with heatmapper from deepTools. Metagene plots represent the median read coverage over chosen features of interest, and heat maps feature all genes/features considered scaled to one size and sorted by total read coverage. All transcription start site and transcription end site coordinates were based on Saccharomyces Genome Database annotations and correspond to ORF coordinates for genes and mapped full-length transcripts for tRNAs and sn/snoRNAs.
S1-DRIP and RE-DRIP-qPCR
Genomic DNA was treated as in the S1-DRIP protocol, or, instead of S1 treatment and sonication, the genomic DNA was fragmented with a cocktail of restriction enzymes: BsrGI, EcoRI, EcoRV, NcoI, NdeI, PsiI, and XbaI for the Ty experiment (Supplemental Fig. S2.3) and AccI, EcoRV, NcoI, HeaIII, and BsrGI for all other RE-DRIP experiments. Digestions were done overnight at 37°C, and the percentage hybrid signal was quantified using qPCRs on DNA from immunoprecipitation and total input with the DyNAmo HS SYBR Green qPCR kit (Thermo Scientific). All qPCR experiments were done on at least two biological replicates; average results are reported, and error bars represent standard deviation.
Accession numbers
The data generated are available at the Sequence Read Archive under accession number SRP071346.
Supplementary Material
Acknowledgments
We thank Vincent Guacci, Chen-ming Fan, Andrew Fire, and Martin Kupiec for comments on the manuscript; Jeremy Amon for comments and proofreading of the manuscript; and Andrew Fire for critical technical advice during the development of S1-DRIP-seq. This work was supported by National Institutes of Health grant R01 GM107583 to D.K., and a Swiss National Science Foundation Advanced Postdoc.Mobility Fellowship to L.C., and in part by a Helen Hay Whitney Post-doctoral Fellowship to L.W.
Footnotes
Supplemental material is available for this article.
Article is online at http://www.genesdev.org/cgi/doi/10.1101/gad.280834.116.
References
- Anders S, Huber W. 2010. Differential expression analysis for sequence count data. Genome Biol 11: R106. [DOI] [PMC free article] [PubMed] [Google Scholar]
- Arudchandran A, Cerritelli S, Narimatsu S, Itaya M, Shin DY, Shimada Y, Crouch RJ. 2000. The absence of ribonuclease H1 or H2 alters the sensitivity of Saccharomyces cerevisiae to hydroxyurea, caffeine and ethyl methanesulphonate: implications for roles of RNases H in DNA replication and repair. Genes Cells 5: 789–802. [DOI] [PubMed] [Google Scholar]
- Balk B, Maicher A, Dees M, Klermund J, Luke-Glaser S, Bender K, Luke B. 2013. Telomeric RNA–DNA hybrids affect telomere-length dynamics and senescence. Nat Struct Mol Biol 20: 1199–1205. [DOI] [PubMed] [Google Scholar]
- Boguslawski SJ, Smith DE, Michalak MA, Mickelson KE, Yehle CO, Patterson WL, Carrico RJ. 1986. Characterization of monoclonal antibody to DNA.RNA and its application to immunodetection of hybrids. J Immunol Methods 89: 123–130. [DOI] [PubMed] [Google Scholar]
- Boque-Sastre R, Soler M, Oliveira-Mateos C, Portela A, Moutinho C, Sayols S, Villanueva A, Esteller M, Guil S. 2015. Head-to-head antisense transcription and R-loop formation promotes transcriptional activation. Proc Natl Acad Sci 112: 5785–5790. [DOI] [PMC free article] [PubMed] [Google Scholar]
- Castellano-Pozo M, Santos-Pereira JM, Rondón AG, Barroso S, Andújar E, Pérez-Alegre M, García-Muse T, Aguilera A. 2013. R loops are linked to histone H3 S10 phosphorylation and chromatin condensation. Mol Cell 52: 583–590. [DOI] [PubMed] [Google Scholar]
- Chan YA, Aristizabal MJ, Lu PYT, Luo Z, Hamza A, Kobor MS, Stirling PC, Hieter P. 2014. Genome-wide profiling of yeast DNA:RNA hybrid prone sites with DRIP-chip. PLoS Genet 10: e1004288. [DOI] [PMC free article] [PubMed] [Google Scholar]
- Chang GS, Noegel AA, Mavrich TN, Müller R, Tomsho L, Ward E, Felder M, Jiang C, Eichinger L, Glöckner G, et al. 2012. Unusual combinatorial involvement of poly-A/T tracts in organizing genes and chromatin in Dictyostelium. Genome Res 22: 1098–1106. [DOI] [PMC free article] [PubMed] [Google Scholar]
- Chiarle R, Zhang Y, Frock RL, Lewis SM, Molinie B, Ho Y-J, Myers DR, Choi VW, Compagno M, Malkin DJ, et al. 2011. Genome-wide translocation sequencing reveals mechanisms of chromosome breaks and rearrangements in B cells. Cell 147: 107–119. [DOI] [PMC free article] [PubMed] [Google Scholar]
- Cloutier SC, Wang S, Ma WK, Petell CJ, Tran EJ. 2013. Long noncoding RNAs promote transcriptional poising of inducible genes. PLoS Biol 11: e1001715. [DOI] [PMC free article] [PubMed] [Google Scholar]
- Cloutier SC, Wang S, Ma WK, Husini Al N, Dhoondia Z, Ansari A, Pascuzzi PE, Tran EJ. 2016. Regulated formation of lncRNA–DNA hybrids enables faster transcriptional induction and environmental adaptation. Mol Cell 61: 393–404. [DOI] [PMC free article] [PubMed] [Google Scholar]
- Curcio MJ, Hedge AM, Boeke JD. 1990. Ty RNA levels determine the spectrum of retrotransposition events that activate gene expression in Saccharomyces cerevisiae. Mol Gen Genetics 220: 213–221. [DOI] [PubMed] [Google Scholar]
- David L, Huber W, Granovskaia M, Toedling J, Palm CJ, Bofkin L, Jones T, Davis RW, Steinmetz LM. 2006. A high-resolution map of transcription in the yeast genome. Proc Natl Acad Sci 103: 5320–5325. [DOI] [PMC free article] [PubMed] [Google Scholar]
- Dechering KJ, Cuelenaere K, Konings RN, Leunissen JA. 1998. Distinct frequency-distributions of homopolymeric DNA tracts in different genomes. Nucleic Acids Res 26: 4056–4062. [DOI] [PMC free article] [PubMed] [Google Scholar]
- El Hage A, French SL, Beyer AL, Tollervey D. 2010. Loss of Topoisomerase I leads to R-loop-mediated transcriptional blocks during ribosomal RNA synthesis. Genes Dev 24: 1546–1558. [DOI] [PMC free article] [PubMed] [Google Scholar]
- El Hage A, Webb S, Kerr A, Tollervey D. 2014. Genome-wide distribution of RNA–DNA hybrids identifies RNase H targets in tRNA genes, retrotransposons and mitochondria. PLoS Genet 10: e1004716. [DOI] [PMC free article] [PubMed] [Google Scholar]
- Field Y, Kaplan N, Fondufe-Mittendorf Y, Moore IK, Sharon E, Lubling Y, Widom J, Segal E. 2008. Distinct modes of regulation by chromatin encoded through nucleosome positioning signals. PLoS Comput Biol 4: e1000216. [DOI] [PMC free article] [PubMed] [Google Scholar]
- French SL, Osheim YN, Cioci F, Nomura M, Beyer AL. 2003. In exponentially growing Saccharomyces cerevisiae cells, rRNA synthesis is determined by the summed RNA polymerase I loading rate rather than by the number of active genes. Mol Cell Biol 23: 1558–1568. [DOI] [PMC free article] [PubMed] [Google Scholar]
- Ginno PA, Lott PL, Christensen HC, Korf I, Chédin F. 2012. R-loop formation is a distinctive characteristic of unmethylated human CpG island promoters. Mol Cell 45: 814–825. [DOI] [PMC free article] [PubMed] [Google Scholar]
- Ginno PA, Lim YW, Lott PL, Korf I, Chédin F. 2013. GC skew at the 5′ and 3′ ends of human genes links R-loop formation to epigenetic regulation and transcription termination. Genome Res 23: 1590–1600. [DOI] [PMC free article] [PubMed] [Google Scholar]
- Henras AK, Plisson-Chastang C, O'Donohue M, Chakraborty A, Gleizes P. 2015. An overview of pre-ribosomal RNA processing in eukaryotes. Wiley Interdiscip Rev RNA 6: 225–242. [DOI] [PMC free article] [PubMed] [Google Scholar]
- Hu Z, Zhang A, Storz G, Gottesman S, Leppla SH. 2006. An antibody-based microarray assay for small RNA detection. Nucleic Acids Res 34: e52. [DOI] [PMC free article] [PubMed] [Google Scholar]
- Huertas P, Aguilera A. 2003. Cotranscriptionally formed DNA:RNA hybrids mediate transcription elongation impairment and transcription-associated recombination. Mol Cell 12: 711–721. [DOI] [PubMed] [Google Scholar]
- Iyer V, Struhl K. 1995. Poly(dA:dT), a ubiquitous promoter element that stimulates transcription via its intrinsic DNA structure. EMBO J 14: 2570–2579. [DOI] [PMC free article] [PubMed] [Google Scholar]
- Jordán-Pla A, Gupta I, de Miguel-Jiménez L, Steinmetz LM, Chávez S, Pelechano V, Pérez-Ortín JE. 2015. Chromatin-dependent regulation of RNA polymerases II and III activity throughout the transcription cycle. Nucleic Acids Res 43: 787–802. [DOI] [PMC free article] [PubMed] [Google Scholar]
- Kim N, Jinks-Robertson S. 2012. Transcription as a source of genome instability. Nat Rev Genet 13: 204–214. [DOI] [PMC free article] [PubMed] [Google Scholar]
- Koerber RT, Rhee HS, Jiang C, Pugh BF. 2009. Interaction of transcriptional regulators with specific nucleosomes across the Saccharomyces genome. Mol Cell 35: 889–902. [DOI] [PMC free article] [PubMed] [Google Scholar]
- Kubik S, Bruzzone MJ, Jacquet P, Falcone J-L, Rougemont J, Shore D. 2015. Nucleosome stability distinguishes two different promoter types at all protein-coding genes in yeast. Mol Cell 60: 422–434. [DOI] [PubMed] [Google Scholar]
- Landt SG, Marinov GK, Kundaje A, Kheradpour P, Pauli F, Batzoglou S, Bernstein BE, Bickel P, Brown JB, Cayting P, et al. 2012. ChIP-seq guidelines and practices of the ENCODE and modENCODE consortia. Genome Res 22: 1813–1831. [DOI] [PMC free article] [PubMed] [Google Scholar]
- Li X, Manley JL. 2005. Inactivation of the SR protein splicing factor ASF/SF2 results in genomic instability. Cell 122: 365–378. [DOI] [PubMed] [Google Scholar]
- Lorch Y, Maier-Davis B, Kornberg RD. 2014. Role of DNA sequence in chromatin remodeling and the formation of nucleosome-free regions. Genes Dev 28: 2492–2497. [DOI] [PMC free article] [PubMed] [Google Scholar]
- Luna R, Jimeno S, Marín M, Huertas P, García-Rubio M, Aguilera A. 2005. Interdependence between transcription and mRNP processing and export, and its impact on genetic stability. Mol Cell 18: 711–722. [DOI] [PubMed] [Google Scholar]
- McLean MA, Tirosh I. 2011. Opposite GC skews at the 5′ and 3′ ends of genes in unicellular fungi. BMC Genomics 12: 638. [DOI] [PMC free article] [PubMed] [Google Scholar]
- Mischo HE, Gómez-González B, Grzechnik P, Rondón AG, Wei W, Steinmetz L, Aguilera A, Proudfoot NJ. 2011. Yeast Sen1 helicase protects the genome from transcription-associated instability. Mol Cell 41: 21–32. [DOI] [PMC free article] [PubMed] [Google Scholar]
- Nakama M, Kawakami K, Kajitani T, Urano T, Murakami Y. 2012. DNA–RNA hybrid formation mediates RNAi-directed heterochromatin formation. Genes Cells 17: 218–233. [DOI] [PubMed] [Google Scholar]
- Pelechano V, Chávez S, Pérez-Ortín JE. 2010. A complete set of nascent transcription rates for yeast genes. PLoS One 5: e15442. [DOI] [PMC free article] [PubMed] [Google Scholar]
- Powell WT, Yamada NA, Yasui DH, Chédin F. 2013. R-loop formation at Snord116 mediates topotecan inhibition of Ube3a-antisense and allele-specific chromatin decondensation. Proc Natl Acad Sci 110: 13938–13943. [DOI] [PMC free article] [PubMed] [Google Scholar]
- Santos-Pereira JM, Aguilera A. 2015. R loops: new modulators of genome dynamics and function. Nat Rev Genet 16: 583–597. [DOI] [PubMed] [Google Scholar]
- Segal E, Widom J. 2009. Poly(dA:dT) tracts: major determinants of nucleosome organization. Curr Opin Struct Biol 19: 65–71. [DOI] [PMC free article] [PubMed] [Google Scholar]
- Shaw NN, Xi H, Arya DP. 2008. Molecular recognition of a DNA:RNA hybrid: sub-nanomolar binding by a neomycin-methidium conjugate. Bioorg Med Chem Lett 18: 4142–4145. [DOI] [PubMed] [Google Scholar]
- Skourti-Stathaki K, Proudfoot NJ, Gromak N. 2011. Human senataxin resolves RNA/DNA hybrids formed at transcriptional pause sites to promote Xrn2-dependent termination. Mol Cell 42: 794–805. [DOI] [PMC free article] [PubMed] [Google Scholar]
- Skourti-Stathaki K, Kamieniarz-Gdula K, Proudfoot NJ. 2014. R-loops induce repressive chromatin marks over mammalian gene terminators. Nature 516: 436–439. [DOI] [PMC free article] [PubMed] [Google Scholar]
- Stirling PC, Chan YA, Minaker SW, Aristizabal MJ, Barrett I, Sipahimalani P, Kobor MS, Hieter P. 2012. R-loop-mediated genome instability in mRNA cleavage and polyadenylation mutants. Genes Dev 26: 163–175. [DOI] [PMC free article] [PubMed] [Google Scholar]
- Struhl K. 1985. Naturally occurring poly(dA–dT) sequences are upstream promoter elements for constitutive transcription in yeast. Proc Natl Acad Sci 82: 8419–8423. [DOI] [PMC free article] [PubMed] [Google Scholar]
- Sun Q, Csorba T, Skourti-Stathaki K, Proudfoot NJ, Dean C. 2013. R-loop stabilization represses antisense transcription at the Arabidopsis FLC locus. Science 340: 619–621. [DOI] [PMC free article] [PubMed] [Google Scholar]
- Teytelman L, Thurtle DM, Rine J, van Oudenaarden A. 2013. Highly expressed loci are vulnerable to misleading ChIP localization of multiple unrelated proteins. Proc Natl Acad Sci 110: 18602–18607. [DOI] [PMC free article] [PubMed] [Google Scholar]
- Turk EM, Das V, Seibert RD, Andrulis ED. 2013. The mitochondrial RNA landscape of Saccharomyces cerevisiae. PLoS One 8: e78105. [DOI] [PMC free article] [PubMed] [Google Scholar]
- van Dijk EL, Chen CL, d'Aubenton-Carafa Y, Gourvennec S, Kwapisz M, Roche V, Bertrand C, Silvain M, Legoix-Né P, Loeillet S, et al. 2011. XUTs are a class of Xrn1-sensitive antisense regulatory non-coding RNA in yeast. Nature 475: 114–117. [DOI] [PubMed] [Google Scholar]
- Vogt VM. 1973. Purification and further properties of single-strand-specific nuclease from Aspergillus oryzae. Eur J Biochem 33: 192–200. [DOI] [PubMed] [Google Scholar]
- Wahba L, Amon JD, Koshland D, Vuica-Ross M. 2011. RNase H and multiple RNA biogenesis factors cooperate to prevent RNA:DNA hybrids from generating genome instability. Mol Cell 44: 978–988. [DOI] [PMC free article] [PubMed] [Google Scholar]
- Wahba L, Gore SK, Koshland D. 2013. The homologous recombination machinery modulates the formation of RNA-DNA hybrids and associated chromosome instability. Elife 2: e00505. [DOI] [PMC free article] [PubMed] [Google Scholar]
- Wu R, Li H. 2010. Positioned and G/C-capped poly(dA:dT) tracts associate with the centers of nucleosome-free regions in yeast promoters. Genome Res 20: 473–484. [DOI] [PMC free article] [PubMed] [Google Scholar]
- Yuan GC. 2005. Genome-scale identification of nucleosome positions in S. cerevisiae. Science 309: 626–630. [DOI] [PubMed] [Google Scholar]
- Zaitsev EN, Kowalczykowski SC. 2000. A novel pairing process promoted by Escherichia coli RecA protein: inverse DNA and RNA strand exchange. Genes Dev 14: 740–749. [PMC free article] [PubMed] [Google Scholar]
Associated Data
This section collects any data citations, data availability statements, or supplementary materials included in this article.