

Abstract
The authors evaluated neuron-specific enolase (NSE), S100 calcium-binding protein B (S100B), and heat shock protein 70 (HSP 70) levels and their relationships with in-hospital mortality, Glasgow Coma Scale (GCS) scores, and National Institute of Health Stroke Scale (NIHSS) scores.
In total, 35 patients older than 18 years were presented to our emergency department and were diagnosed with non-traumatic intracranial hemorrhage (ICH) and 32 healthy controls were included. Blood samples were drawn on days 0 and 5.
S100 calcium-binding protein B and HSP levels were significantly higher in patients than in controls on days 0 and 5. Neuron-specific enolase levels were higher in patients than in controls on day 0, but there was no significant difference on day 5.
S100 calcium-binding protein B was negatively correlated with GCS, whereas it was positively correlated with NIHSS and bleeding volume. There was also a negative correlation between NSE and GCS, but it was not statistically significant. In addition, no significant correlation was found in terms of bleeding volume or NIHSS. Heat shock protein 70 was negatively correlated with GCS and positively correlated with bleeding volume and NIHSS, but these results were not statistically significant. S100 calcium-binding protein B and HSP 70 levels were significantly higher in those who died compared with survivors. The areas under the curve of S100 B, NSE, and HSP 70 for mortality were 0.635, 0.477, and 0.770, respectively.
Neuron-specific enolase, S100B, and HSP 70 levels are simple, inexpensive, and objective measures in cases of ICH. These tests can be used to support an assessment for screening ICH patients with clinical scoring systems, such as GCS and NIHSS.
INTRODUCTION
In recent years, many investigations have been conducted regarding predicting reversible and irreversible brain injury after stroke. After a brain injury, identifying the extent of injury and making an early determination of the patient's prognosis are major challenges for clinicians. No marker, however, has yet been identified that definitely indicates the extent of brain injury.1 Neuroradiologic imaging techniques, such as ultrasound, magnetic resonance imaging, computed tomography (CT), and positron emission tomography can help in identifying the localization and volume of hemorrhagic and ischemic stroke; in addition, they enable early treatment.2 Investigators’, however, attempt to discover markers specific to the brain to make diagnoses and predict the prognoses of cerebrovascular diseases, such as by daily repetition of imaging, are impractical.
Similar to troponin T or creatine kinase (CK)-MB, indicating myocardial injury, several biochemical substances have been evaluated to find a marker specific to brain injuries. To date, aspartate aminotransferase, adenylate kinase, lactate dehydrogenase, creatine kinase, and brain type (CK-BB), have been evaluated as markers for brain injury,3 but sufficient specificity has not been achieved. In recent studies, neurobiochemical markers have shown marked improvement in their ability to identify stroke patients with poor neurologic outcomes. Neuron-specific enolase and S100B protein have been proposed as specific neurobiochemical markers of brain injury following stroke, head trauma, and cardiac surgery.4
In this study, correlations between serum NSE, S100B, and HSP70 levels and the extent of lesions, prognosis, early clinical neurologic status, and mortality were investigated in patients with intracranial hemorrhage (ICH).
MATERIALS AND METHODS
Patients and Controls
This study was approved by the Institutional Ethics Committee. In total, 35 patients older than 18 years (16 men, 19 women) who presented to the Emergency Department of Firat University Medical School within 24hour after onset of a nontraumatic ICH were included. Detailed histories and vital signs were obtained from and neurologic examinations conducted on all patients; GCS and NIHSS were calculated at the emergency department. National Institute of Health Stroke Scale scores of 16 to 21 were considered to indicate moderate-to-severe stroke, and those over 22 were considered to indicate severe stroke.5 All patients underwent CT scans, and the volume of the ICH was estimated. The CT slice with the largest area of hemorrhage was identified. The largest diameter (A) of the hemorrhage in this slice was measured. The largest diameter 90° to A on the same slice was measured next (B). Finally, the approximate number of 10-mm slices on which the ICH was seen was determined (C). C was calculated by a comparison of each CT slice with hemorrhage to the CT slice with the largest hemorrhage on that scan.6 Patients undergoing intracranial procedures, those using anticoagulant agents, and those with malignancy, uremia, liver cirrhosis, subarachnoid hemorrhage, and trauma were excluded.
The patients were compared with 32 healthy individuals. Similar to the patients, the inclusion criteria were age and sex. The exclusion criteria were the same as for the patients.
Laboratory Evaluations
Blood samples (5 cc) were drawn from all patients via the antecubital vein into gel and clot activator tubes on days 0 and 5. Blood samples were also drawn from the 32 healthy controls in the same manner. After waiting 10 to 15 min for coagulation, samples were centrifuged (1000 rpm, 10 min) to obtain serum. The serum obtained was divided into 2 microcentrifuge tubes and stored at 70 °C until analyzed.
Serum NSE levels were determined using a Human NSE ELISA kit (DiaMetra S.r.l., cat. #: DKO073, Z.I. Paciana, Italy). Serum S100B levels were determined using a Human S100B ELISA kit (DiaMetra S.r.l., cat. #: DKO073), and serum HSP 70 levels were determined using a Human HSP 70 ELISA kit (Adipo Bioscience, cat. #: SK00712–01, Santa Clara, CA) according to the manufacturers’ protocols.
Statistical Analyses
All statistical analyses were performed using the SPSS software (ver. 20.0 for Windows; SPSS, Inc., Chicago, IL). Continuous data are presented as means ± standard deviations or medians (minimum–maximum), as appropriate. Before making comparisons between groups, we checked whether the data distribution was normal. A parametric test (independent-samples t-test) was conducted on data with a normal distribution, and the nonparametric Mann–Whitney U test was used for non-normally distributed data. A one-way analysis of variance was used for intergroup comparisons. Pearson correlation test was used to analyze the relationships of the parameters among groups. Different predictive models were compared by receiver operating characteristic-area under curve (AUC) statistics. Significance was set at P < 0.05.
RESULTS
In total, 67 subjects were included: 35 patients with a diagnosis of ICH in the patient group and 32 healthy individuals in the control group. Of the patients with hemorrhage, 16 (45.7%) were men and 19 (54.2%) were women. Of the controls, 19 (59.3%) were men and 13 (40.6%) women. The mean age was 60.54 ± 12.28 years in the patient group and 58.03 ± 8.42 years in the control group. The mean time to presentation was 2.71 ± 1.38 hour. Mean GCS and NIHSS scores were 12.42 ± 3.36 and 11.54 ± 1.90, respectively. On CT scans, the mean bleeding volume was estimated as 25.34 ± 5.06. Of the patients, 29 (82.9%) were admitted to the neurology and neurosurgery departments, whereas 6 (17.1%) were admitted to the intensive care unit. Of the 35 patients, 9 (25.7%) died in the department where they were admitted.
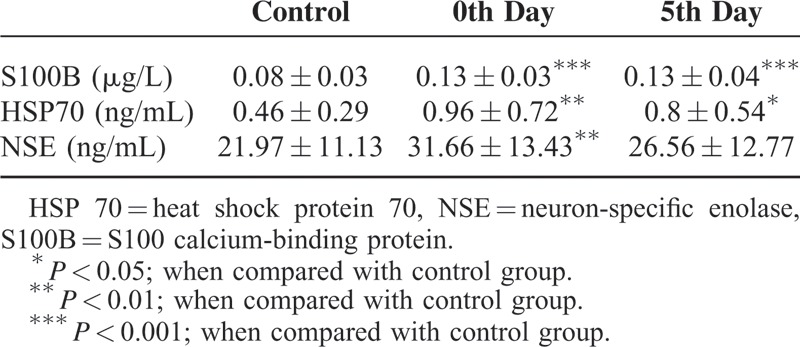
In the patient group, S100B, HSP70, and NSE levels measured on days 0 and 5 were 0.13 ± 0.03 and 0.13 ± 0.04, 0.96 ± 0.54 and 0.80 ± 0.54, and 31.66 ± 13.43 and 26.56 ± 11.77, respectively. S100 calcium-binding protein B, HSP70, and NSE levels were 0.08 ± 0.03, 0.46 ± 0.29, and 21.97 ± 11.13, respectively, in the control group. S100B and HSP 70 levels on days 0 and 5 were significantly higher in the patient group than in the control group (P < 0.001), as were NSE levels on day 0 (P < 0.01). Neuron-specific enolase levels on day 5, however, were higher in the patients than in the controls, but this difference was not statistically significant (P > 0.05; Table 1).
TABLE 1.
Biochemical Parameters of Groups
S100 calcium-binding protein B levels in the patient group on day 0 were negatively correlated with GCS values (r = 0.467; P < 0.01) and positively correlated with bleeding volume (r = 0.564; P < 0.001) and NIHSS scores (r = 0.397; P < 0.05; Figure 1A-C). Heat shock protein 70 levels in the patient group on day 0 were negatively correlated with GCS values (r = 0.152; P > 0.05) and positively correlated with bleeding volume (r = 0.109; P > 0.05) and NIHSS scores (r = 0.233; P > 0.05; Figure 2A-C), but these associations were not statistically significant. Neuron-specific enolase levels in the patient group on day 0 were negatively correlated with GCS values (r = 0.155; P > 0.05; Figure 2D), but this difference was not statistically significant. No correlation, however, was detected regarding bleeding volume and NIHSS. In the patient group, a negative correlation was found between bleeding volume and GCS values (r = 0.659; P < 0.001), whereas a positive correlation between bleeding volume and NIHSS was observed (r = 0.558; P < 0.001).
FIGURE 1.
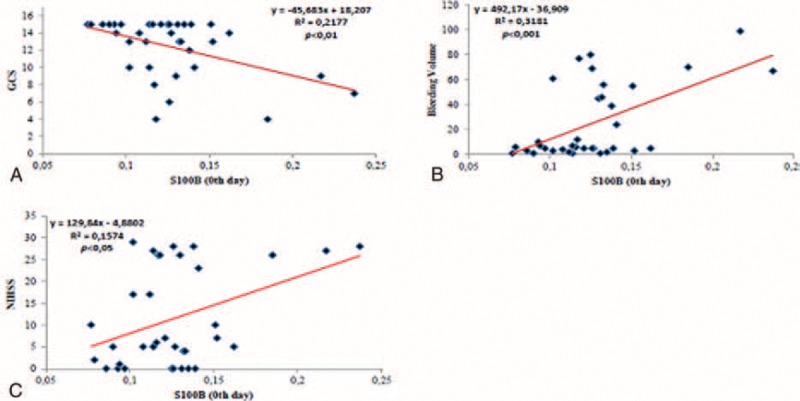
A, The correlation between Glasgow Coma Scale and S100B in the patient group. B, The correlation between bleeding volume and S100B in the patient group. C, The correlation between NIHSS and S100B in the patient group. S100B = S100 calcium-binding protein.
FIGURE 2.
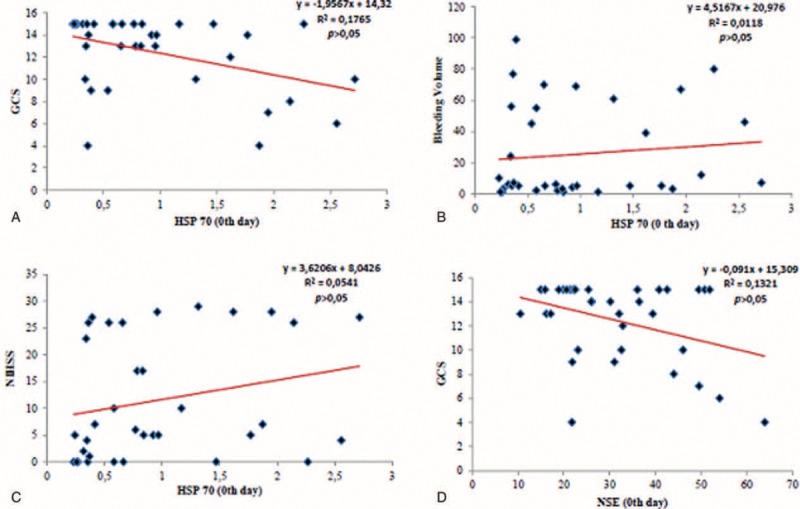
A, The correlation between Glasgow Coma Scale and HSP 70 in patient the group. B, The correlation between bleeding volume and HSP 70 in patient the group. C, The correlation between National Institute of Health Stroke Scale and HSP 70 in patient the group. D, The correlation between Glasgow Coma Scale and neuron-specific enolase in patient the group. HSP 70 = heat shock protein 70.
When the relationship between these parameters and mortality was evaluated, it was seen that S100B and HSP 70 levels were significantly higher in patients with an outcome of in-hospital mortality than in those who survived. In addition, NSE levels were significantly lower in patients with an outcome of in-hospital mortality than in those who survived, but this difference was not statistically significant (Table 2). The AUCs of S100 B and NSE were lower than that of HSP 70 for mortality (AUCs for S100 B, NSE, and HSP 70 were 0.635, 0.477, and 0.770, respectively; Figure. 3).
TABLE 2.
Biochemical Parameters in Patients Who Did or Did Not Survive
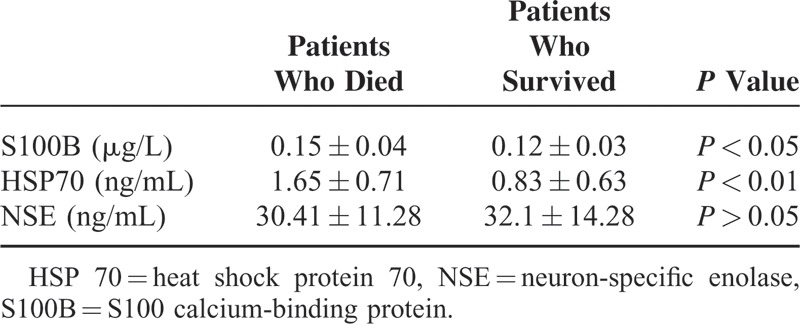
FIGURE 3.
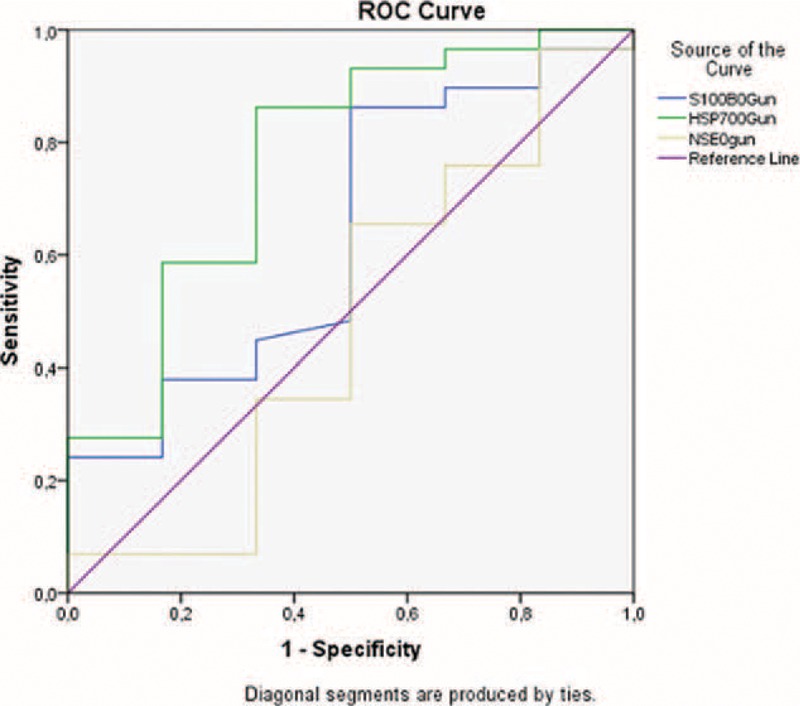
The areas under the receiver operating characteristic curves for mortality and S100 calcium-binding protein B, neuron-specific enolase, and heat shock protein 70 upon admission to the emergency room.
DISCUSSION
We found that S100B, HSP 70, and NSE levels were significantly higher in the patient than in the control group. Moreover, S100B and HSP 70 levels were significantly higher in patients with an outcome of in-hospital mortality than in those who survived.
S100 calcium-binding protein B is a calcium-binding protein, which is primarily released from astrocytes.7 It has been proposed that S100B, which has 2 subunits (α and β subunits), regulates several processes, such as intracellular signaling, growth, cell structure, and energy metabolism.8 Recently, S100B has also been considered a neurotrophic cytokine. S100 calcium-binding protein B protein was found to be related to glial proliferation, axonal growth, and Ca2+ hemostasis.9 It causes neuronal death via an inflammatory pathway by increasing proinflammatory cytokines, such as interleukin (IL)-1β, IL-6, and tumor necrosis factor (TNF)-α and inflammatory stress-related enzymes, such as iNOS, and by upregulating the nuclear factor-κB pathway.7,9 When compared with CK-BB, lactate dehydrogenase, and NSE, S100B protein shows higher specificity for brain tissue and is better at meeting the requirements for being a serum marker of brain injury. Its sensitivity is very high in terms of indicating cellular injury in the brain after head trauma. For example, after minor trauma, serum S100B levels are elevated, even in the presence of an apparently normal CT scan. In many clinical trials, it has been found that increased S100B is associated with the extent of primary injury, the presence of secondary brain injury, and a poor prognosis.10 S100 calcium-binding protein B is a biomarker that indicates the severity of brain injury after ICH and is a marker of poor prognosis. In our study, we found S100B levels on day 0 were negatively correlated with GCS values and positively correlated with bleeding volume and NIHSS in the patient group. Previous studies found that S100B levels were significantly higher in patients with ICH than in controls.7,11 When S100B elevation in the acute phase was compared with other parameters predicting prognosis, a negative correlation was found with GCS values, whereas there was a positive correlation with bleeding volume.7,11 No significant correlations between S100B levels after day 3 and GCS values or bleeding volume, however, were found.7 We think that S100B is an important marker for predicting prognosis because of the relationship between S100 and prognostic indicators, such as GCS, NIHSS, and bleeding volume in patients with ICH found in our study and other reports and because of the significant elevation in cases with an outcome of in-hospital mortality.
Neuron-specific enolase is a glycolytic enzyme 12 and a marker of acute neuronal injury,13 which is localized in the cytoplasm of neuroendocrine cells and neurons. Its level in cerebrospinal fluid increases in case of Alzheimer disease, epileptic seizures, multiple sclerosis, head trauma, and stroke.14 It was found that NSE is correlated with the severity of brain injury and clinical status.15 Recent studies have supported the suggestion that elevated NSE levels in both serum and cerebrospinal fluid are a sensitive and quantitative marker for parenchymal brain injury in cases of ICH, ischemic stroke, and brain injury.16 In our patient group, a negative correlation was found between NSE levels on day 0 and GCS values, but it was not statistically significant. In addition, no correlation was found regarding bleeding volume or NIHSS. A study conducted by Yuan et al17 that evaluated NSE levels evaluated in patients with acute ICH found that these levels were significantly higher in patients than in controls, which is consistent with our findings. In contrast, they also found a significant positive correlation between NSE and intracranial volume, whereas no such correlation was found in our study. This discrepancy may be attributable to the differences in the numbers of cases in the studies. Brea et al18 evaluated NSE and S100B levels in patients with hemorrhagic or ischemic stroke. Similar to our results, significantly elevated NSE and S100B levels were detected at admission. It was shown that both parameters had significantly positive correlations with NIHSS.
Heat shock proteins are found in the endoplasmic reticulum, mitochondria, nucleus, and cytosol in low levels in response to daily stress.19 Following thermal injury, apoptosis is inhibited by the synthesis of HSP that aids in the recovery of damaged cells by limiting injury.20 It is a major stress protein that can be induced in pathologic conditions in the brain, such as seizures and cerebral ischemia.21 Also it stimulates TNF-α and IL-8 secretion by binding CD91 receptors of macrophages and monocytes. These proinflammatory cytokines are released into circulation immediately after the onset of disease, which makes these cytokines good markers of early outcomes at the onset of disease.9,22 It was found that increased HSP 70 production has a neuroprotective effect in cell culture and stroke models.23 In stroke, protein accumulation occurs as a result of acidosis and oxidative stress. Heat-shock proteins, such as HSP 70, recognize toxic proteins increase stress, prevent the accumulation of these proteins, and help correct the misfolding of proteins.24 In our patient group, HSP 70 levels on day 0 were negatively correlated with GCS values and positively correlated with bleeding volume and NIHSS. These correlations, however, were not statistically significant. Manaenko et al25 observed that geldamycin reduced brain edema and inflammation by increasing HSP levels in patients; thus, it accelerated the recovery process. A study conducted by O'Sullivan et al26 found that HSP levels were increased in patients receiving diazoxide. Thus, it was found that diazoxide-reduced cerebral ischemia and hemorrhagic shock by increasing HSP levels. In a study by Matz et al27 HSP 70 was detected in glial cells and neurons surrounding the hematoma after drug-induced intracerebral hemorrhage in rats. It was observed that HPS 70 increased because of stress in the brain. In a study by Fang et al,22 IL-18, TNF-α, and HSP 70 levels were evaluated in patients with ICH, and it was found that the earliest elevation in these 3 markers was detected in HSP 70. Heat shock protein 70 mRNA secretions began 4 hours after hemorrhage. Its’ levels were found to be significantly higher in patients who did not survive than in those who did. It was concluded that HSP 70 could be considered as a marker for the severity of brain injury on the first day after hemorrhage as well as a predictor of mortality in patients with spontaneous ICH. In our study, HSP 70 levels were significantly higher in patients with an outcome of in-hospital death than in those who survived.
In conclusion, serum S100B, HSP 70, and NSE levels are simple, inexpensive, and objective measures that can be used to support the screening of ICH patients with clinical scoring systems, such as GCS and NIHSS. They provide valuable information for predicting the prognosis and identifying the extent of injury, the treatment strategy, the differential diagnosis, and the therapeutic efficacy.
Footnotes
Abbreviations: AUCs = The areas under the curve, CK-BB = Creatine kinase, brain type, CT = Computed tomography, GCS = Glasgow Coma Scale, HSP 70 = Heat shock protein 70, ICH = Intracranial hemorrhage, NIHSS = National Institute of Health Stroke Scale, NSE = Neuron-specific enolase.
This study was published as a poster at the 9th National Congress of Emergency Medicine in Turkey (23–26 May 2013, Antalya, Turkey). We received support from Firat University research funding for this study (number: TF.11.75).
REFERENCES
- 1.Hommel M, Besson G, Le Bas JF, et al. Prospective study of lacunar infarction using magnetic resonance imaging. Stroke 1990; 21:546–550. [DOI] [PubMed] [Google Scholar]
- 2.Caplan LR. Intracerebral haemorrhage. Lancet 1992; 339:656–658. [DOI] [PubMed] [Google Scholar]
- 3.Raabe A, Grolms C, Keller M, et al. Correlation of computed tomography findings and serum brain damage markers following severe head injury. Acta Neurochir 1998; 140:787–792. [DOI] [PubMed] [Google Scholar]
- 4.Herrmann M, Curio N, Jost S, et al. Protein S-100B and neuron specific enolase as early neurobiochemical markers of the severity of traumatic brain injury. Restor Neurol Neurosci 1999; 14:109–114. [PubMed] [Google Scholar]
- 5.Kartz BS, McMullan JT, Sucharew H, et al. Design and validation of a prehospital scale to predict stroke severity: Cincinnati Prehospital Stroke Severity Scale. Stroke 2015; 46:1508–1512. [DOI] [PMC free article] [PubMed] [Google Scholar]
- 6.Broderick J, Brott T, Tomsick T, et al. The risk of subarachnoid and intracerebral hemorrhages in blacks as compared with whites. N Engl J Med 1992; 326:733–736. [DOI] [PubMed] [Google Scholar]
- 7.Hu YY, Dong XQ, Yu WH, et al. Change in plasma S100B level after acute spontaneous basal ganglia hemorrhage. Shock 2010; 33:134–140. [DOI] [PubMed] [Google Scholar]
- 8.Zimmer DB, Cornwall EH, Landar A, et al. The S100 protein family: history, function, and expression. Brain Res Bull 1995; 37:417–429. [DOI] [PubMed] [Google Scholar]
- 9.Brunswick AS, Hywang BY, Appelboom G, et al. Serum biomarkers of spontaneous intracerebral hemorrhage induced secondary brain injury. J Neurol Sci 2012; 321:1–10. [DOI] [PubMed] [Google Scholar]
- 10.Raabe A, Kopetsch O, Woszczyk A, et al. Serum S-100B protein as a molecular marker in severe traumatic brain injury. Restor Neurol Neurosci 2003. 159–169. [PubMed] [Google Scholar]
- 11.Delgado P, Alvarez Sabin J, Santamarina E, et al. Plasma S100B level after acute spontaneous intracerebral hemorrhage. Stroke 2006; 37:2837–2839. [DOI] [PubMed] [Google Scholar]
- 12.Zubay G. Biochemistry. 3rd ed.Boston, MA:Addison-Wesley; 1983. 323–345. [Google Scholar]
- 13.Meric E, Gunduz A, Turedi S, et al. The prognostic value of neuron-specific enolase in head trauma patients. J Emerg Med 2010; 38:297–301. [DOI] [PubMed] [Google Scholar]
- 14.Janice AR, Gaelwyn BDJ, Norman AL. Enolase isoenzymes in the cerebrospinal fluid of patients with diseases of the nervous system. J Neurol Neurosurg Psychiatry 1983; 46:1031–1036. [DOI] [PMC free article] [PubMed] [Google Scholar]
- 15.Schoerkhuber W, Kittler H, Sterz F. Time course of serum neuron-specific enolase. A predictor of neurological outcome in patients resuscitated from cardiac arrest. Stroke 1999; 30:1598–1603. [DOI] [PubMed] [Google Scholar]
- 16.Herrmann M, Ebert AD, Tober D. A contrastive analysis of release patterns of biochemical markers of brain damage after coronary artery bypass grafting and valve replacement and their association with the neurobehavioral outcome after cardiac surgery. Eur J Cardiothorac Surg 1999; 16:513–518. [DOI] [PubMed] [Google Scholar]
- 17.Yuan X, Xiao Bo, Hu J. Changes and clinic research of neuron-specific enolase in acute cerebral hemorrhage. J Apoplexy Nerv Dis 2004; 2: in press. [Google Scholar]
- 18.Brea D, Sobrino T, Blanco M, et al. Temporal profile and clinical significance of serum neuron-specific enolase and S100 in ischemic and hemorrhagic stroke. Clin Chem Lab Med 2009; 47:1513–1518. [DOI] [PubMed] [Google Scholar]
- 19.Rylander MN, Feng Y, Bass J, et al. Thermally induced injury heat-shock protein expression in cells and tissues. Ann N Y Acad Sci 2005; 1066:222–242. [DOI] [PubMed] [Google Scholar]
- 20.Nikfarjam M, Muralidharan V, Su K. Patterns of heat shock protein (HSP 70) expression and Kupffer cell activity following thermal ablation of liver and colorectal liver metastases. Int J Hyperthermia 2005; 21:319–332. [DOI] [PubMed] [Google Scholar]
- 21.Massa SM, Swanson RA, Sharp FR. The stress gene in brain. Cerebrovasc Brain Metab Rev 1996; 8:95–158. [PubMed] [Google Scholar]
- 22.Fang HY, Ko WJ, Lin CY. Inducible heat shock protein 70, interleukin-18, and tumor necrosis factor alpha correlate with outcomes in spontaneous intracerebral hemorrhage. J Clin Neurosci 2007; 14:435–441. [DOI] [PubMed] [Google Scholar]
- 23.Kelly S, Yenari MA. Neuroprotection: heat shock proteins. Curr Med Res Opin 2002; 18:55–60. [PubMed] [Google Scholar]
- 24.Hu BR, Janelidze S, Ginsberg MD, et al. Protein aggregation after focal brain ischemia and reperfusion. J Cereb Blood Flow Metab 2001; 21:865–875. [DOI] [PubMed] [Google Scholar]
- 25.Manaenko A, Fathali N, Chen H, et al. Heat shock protein 70 upregulation by geldanamycin reduces brain injury in a mouse model of intracerebral hemorrhage. Neurochem Int 2010; 57:844–850. [DOI] [PMC free article] [PubMed] [Google Scholar]
- 26.O'Sullivan JC, Yao XL, Alam H, et al. Diazoxide, as a postconditioning and delayed preconditioning trigger, increases HSP25 and HSP70 in the central nervous system following combined cerebral stroke and hemorrhagic shock. J Neurotrauma 2007; 24:532–546. [DOI] [PubMed] [Google Scholar]
- 27.Matz P, Weinstein P, States B, et al. Subarachnoid injections of lysed blood induce the hsp70 stress gene and produce DNA fragmentation in focal areas of the rat brain. Stroke 1996; 27:504–512. [DOI] [PubMed] [Google Scholar]