

Abstract
Visual area V4 is a midtier cortical area in the ventral visual pathway. It is crucial for visual object recognition and has been a focus of many studies on visual attention. However, there is no unifying view of V4’s role in visual processing. Neither is there an understanding of how its role in feature processing interfaces with its role in visual attention. This review captures our current knowledge of V4, largely derived from electrophysiological and imaging studies in the macaque monkey. Based on recent discovery of functionally specific domains in V4, we propose that the unifying function of V4 circuitry is to enable selective extraction of specific functional domain-based networks, whether it be by bottom-up specification of object features or by top-down attentionally driven selection.
Area V4 is a midtier visual cortical area in the ventral visual pathway. Although believed to be important in object recognition, V4’s functional role remains elusive. This is in part due to the complexity of V4. V4 comprises cells that exhibit diverse receptive field preferences related to surface properties (color, brightness, texture), shape (orientation, curvature), motion and motion contrast, and depth. V4 has also been a focus of studies on visual attention. It is widely acknowledged that visual attention enhances neuronal firing to relevant stimuli in V4 and suppresses responses to distractor stimuli. However, the relationship between V4’s contribution to attentional processes and its role in object recognition processing is unclear. What is the unifying role of V4 across these multiple feature response dimensions? What ties feature and attention together in V4? This review attempts to bring the reader to our current understanding of V4. We propose that a primary role of V4 is to facilitate figure-ground segmentation of the visual scene. We further propose that the same network which mediates figure-ground computation also enables attentional filtering. We suggest that the unifying function of V4 circuitry is to enable “selective extraction,” whether it be by bottom-up feature-specified shape or by attentionally driven spatial or feature-defined selection. As the bulk of knowledge regarding V4 derives from electrophysiological and functional magnetic resonance imaging (fMRI) studies in the macaque monkey, the emphasis of this review will be on monkey studies. However, where appropriate, reference to human studies is made.
I. Brief Background
In the macaque monkey, V4 is located on the prelunate gyrus and in the depths of the lunate and superior temporal sulci and extends to the surface of the temporal-occipital gyrus (Figure 1A). V4 contains representations of both superior (ventral V4) and inferior visual field (dorsal V4) representations (Gattass et al., 1988). Recent retinotopic mapping (Figure 1B) of this region using fMRI has provided evidence that it is bounded posteriorly by V3 and anteriorly by dorsal and ventral V4A. While gross retinotopy in V4 is well understood, some important aspects of its organization are still debated. These issues include the location of V4 borders (see Stepniewska et al., 2005 for review), whether it is one area or more, and whether it is comprised of multiple functional maps. Physiologically guided injections of tracer into central and peripheral locations in V4 reveal that only central V4 receives direct input from V1 (Zeki, 1969; Nakamura et al., 1993; Yukie and Iwai, 1985). Central V4 also exhibits strong connections with temporal areas such as TE and TEO, suggesting that it plays an important role in object recognition. Peripheral V4 shows strong connections with dorsal stream areas such as DP, VIP LIP, PIP, and MST (Baizer et al., 1991; Ungerleider et al., 2008), suggesting that V4 plays a role in spatial vision and spatial attention.
Figure 1. V4 in Macaque Monkey.

(A) Ventral and dorsal pathways are indicated by red and blue arrows, respectively. V4 (shaded green) is a midtier area in the ventral pathway. Sulci: lunate, STS (superior temporal sulcus). +, −: superior, inferior fields. Adapted from Parker (2007).
(B) fMRI visual field mapping of early visual areas reveal dorsal and ventral V4 and V4A (Janssen and W.V., unpublished data).
Neurons in V4 have diverse response preferences. Originally V4 was characterized as a color area by Zeki (1973, 1983) based on the predominance of color selective receptive fields recorded. However, subsequent studies also found prominent orientation selectivity among V4 cells, suggesting its role in processing of shape information (Van Essen and Zeki, 1978; Schein et al., 1982; Mountcastle et al., 1987). As will be seen in the next section, the diversity of response properties (which include selectivity for color, orientation, depth, and motion) has led to competing notions of the function of V4. It is our hope that this review will offer insights that help make these differing views of V4 compatible.
Lesions of V4 lead to specific deficits in pattern recognition. Monkeys with V4 lesions are moderately impaired in a variety of simple 2D-shape detection and discrimination tasks. However, the V4 lesion literature is somewhat mixed on this issue, perhaps due to differences in the mediolateral extent of the lesions (Heywood and Cowey, 1987; Walsh et al., 1992; Merigan, 2000; Walsh et al., 2000; Girard et al., 2002; Schiller, 1993). In contrast, V4 lesions produce striking deficits in more complex perceptual tasks. For example, V4 lesions lead to loss of ability to discriminate images of 3D objects (Merigan and Pham, 1998), loss of color constancy (Walsh et al., 1993), and deficits in the ability to select relatively less salient objects from an array, or to generalize across different stimulus configurations (Schiller, 1993; De Weerd et al., 1996, 1999).
A very large number of neurophysiological experiments on V4 have focused on attention. In fact it would not be an exaggeration to say that much of our understanding of the neural mechanisms mediating attention has been informed by neurophysiological studies in monkey V4. Note that, while under natural behavioral conditions primates foveate objects of attention, most neurophysiological studies have been conducted in extrafoveal regions of V4 in monkeys performing covert attention tasks (e.g., attending to nonfoveal stimuli while maintaining fixation on a central location).
Comparison between Monkey and Human V4
Development of fMRI over the past 15 years has dramatically advanced our understanding of human V4 and indicates that, to a large extent, human V4 is organizationally and functionally analogous to macaque V4. The retinotopic organization of area V4 and nearby visual areas appears similar in humans (Sereno et al., 1995; Hansen et al., 2007) and macaques (Fize et al., 2003; Gattass et al., 1988). That is, humans appear to possess an inferior field representation of V4 dorsally and a superior field representation ventrally (Hansen et al., 2007). However, some others report a complete hemifield representation within ventral human V4 and conclude that no dorsal V4 exists in humans (Wade et al., 2002; Winawer et al., 2010; Goddard et al., 2011). Beyond retinotopy, many fMRI studies of V4 are broadly consistent with what would be expected based on neurophysiological studies in monkey V4. However, this comparison is difficult to make because interpretation of fMRI results in terms of the underlying neural mechanisms is problematic (Buxton et al., 2004; Logothetis and Wandell, 2004). In any case, from a comparative evolutionary viewpoint, it is likely that many commonalities exist between monkey V4 and human V4, but there may also be specializations in the human that are not present in the monkey.
II. Complex Functional Organization in V4
There have long been suggestions that V4 contains functional compartments. The original evidence for this idea comes from anatomical studies in which retrograde tracer injections in V4 labeled either predominantly thin stripes (associated with color) or pale stripes (associated with form) in area V2 and did not label thick stripes (associated with depth) (DeYoe et al., 1994). Furthermore, tracer injections in inferotemporal areas (PITv and PITd) result in interdigitated segregated label in V4 (DeYoe et al., 1994), indicating some degree of continued functional streaming in the ventral pathway. Intrinsic connections within V4 also have a patchy appearance, with clusters that measure 200–300 μm in size (Yoshioka et al., 1992). Electrophysiological studies have also reported functional clustering of color-selective neurons in V4 (Zeki, 1973; Conway et al., 2007; Conway and Tsao, 2009; Harada et al., 2009). However, in contrast to classic electrophysiological studies in V1 (Hubel and Wiesel, 1977), V2 (Hubel and Livingstone, 1987; Roe and Ts’o, 1995), and MT (DeAngelis and Newsome, 1999), efforts to map V4 with dense grids of electrophysiological penetrations have failed to reveal clear functional organization (cf. Youakim et al., 2001).
Recent advances in fMRI and optical imaging methods have provided new information about functional organization of V4. These studies show that V4 in monkeys is not a homogenous visual area. fMRI studies in alert macaque monkeys reveal color-selective functional domains in several regions of the temporal lobe (including V4, posterior inferior temporal (PIT) cortex, and TE) (Figure 2A, Conway et al., 2007; Conway and Tsao, 2006; Harada et al., 2009). To draw analogy with the color blobs of V1, these regions have been dubbed “globs” (Figures 2B and 2C) and the nonglob regions as “interglobs.” The imaging results are supported by single-unit recordings showing that glob cells are spatially clustered by color preference and may be arranged in “chromotopic” maps (Figure 2D, Conway and Tsao, 2009). Glob cells are narrowly tuned for hue, tolerant to changes in luminance, and less orientation-selective than are interglob cells (Conway et al., 2007). The identification of such globs suggests that V4 is not a homogeneous area and may comprise a collection of modules. It also highlights the need to further investigate the functional organization of V4 and the adjoining brain regions, and to elucidate their relationship with retinotopic definitions of V4, PIT, and TEO.
Figure 2. Color Regions in Macaque.

(A–C) Gray patches (A): several color globs identifed with fMRI seen in coronal (B) and sagittal (C) views. Color voxels: better activated by equiluminant color than black and white gratings. Electrode is seen targeting a color glob.
(D) Shift in color preference of neurons along length of an electrode penetration through a glob (Conway and Tsao, 2009; Conway et al., 2010). Scale bar: 1 cm. D: dorsal, A; anterior.
The first optical imaging study of V4 in anesthetized monkeys revealed orientation-selective domains which were a few hundred microns in size (Ghose and Ts’o, 1997). More recent studies using isoluminant color and achromatic gratings revealed clear functional domains with preference for surface properties (color and luminance, Figures 3B and 3D) and for shape (contour orientation; Figures 3C and 3E) in foveal regions of V4 (Tanigawa et al., 2010). These feature preference domains are segregated within V4 (Figure 3F, pixels in B and D coded pink, pixels in C and E coded green) and measure ~500 μm or less. Within color preference domains are maps for hue (Tanigawa et al., 2010), akin to the hue maps found in V2 (Xiao et al., 2003). No direct comparison between the optical imaging and fMRI studies has yet been made. However, it seems possible that the color/luminance and orientation regions identified with optical imaging correspond to some of the globs and interglobs found in V4 with fMRI. The findings that V4 contains functional domains reconciles a long-standing debate concerning the color-coding properties of V4: studies claiming that all of V4 was a color area were likely biased toward microelectrode recordings from color modules, while those reporting clear shape selectivity were likely biased toward recordings from noncolor modules (Conway and Tsao, 2006; Tanigawa et al., 2010).
Figure 3. Functional Organization in V4.

Optical window over foveal V1, V2, and V4 (A). V4 fields of view in upper (B and C) and lower (D and E) white rectangles. Color/luminance (B and D) and orientation (D and F) maps. Composite map (F) illustrates segregation of color/lum (pixels in B and D coded pink) and orientation (pixels in C and E coded green) preference bands. Scale bar: 1 mm (Tanigawa et al., 2010).
How does the presence of segregated functional domains impact topography? Topographic representation in V4 appears to employ the same strategy present in other areas where there are segregated functional domains. In V1, where there are segregated left and right eye ocular dominance columns, the visual map is repeated, once for the left eye and once for the right eye (Hubel and Wiesel, 1977). In V2, where there are three functional stripe types (thin, pale, and thick, Hubel and Livingstone, 1987), the visual field is represented three times, once each for representation of color, form, and depth (Roe and Ts’o, 1995; Shipp and Zeki, 2002a, 2002b). This type of repeated representation results in an interdigitation of different feature maps. A complete visual field representation in one feature modality is achieved by a collection of discontinuous functional domains (e.g., a complete right eye visual field is achieved by coalescing all right eye ocular dominance columns in V1; a complete color visual field is achieved by coalescing all thin stripes in V2). Topographic representation within V4 is similar (Tanigawa et al., 2010; Conway et al., 2007). In the iso-eccentric axis, color maps and orientation maps are interdigitated within V4, and continuity of feature-specific representation is achieved across bands of similar functional preference (Figure 4A). Iso-polar representations map in the orthogonal axis along the color and orientation bands (Figure 4B). In sum, it appears that, at least in foveal regions of V4, the mapping strategy parallels that observed in earlier visual areas.
Figure 4. Topography in V4 Color and Orientation Bands.

(A) Representation of iso-eccentricity across color (blue arrows) and orientation (red arrows) bands.
(B) Representation of iso-polarity within each set of color and orientation bands. (Based on Tanigawa et al., 2010.)
III. V4 Is a Midtier Feature Representation Area: Computation of Figure/Ground
In this section, we summarize the current knowledge about object feature selectivities in V4. In doing so, we hope to underscore certain aspects of V4 processing that may guide our understanding of what makes V4, V4. That is, we ask, given the diversity of response types in V4, what common transformation(s) underlies these various computations that make them part of this singular area? This line of questioning has been successfully used to examine transformations that occur in other visual areas. For example, by identifying transformations across different submodalities of color (thin stripes), contour (thick/pale), depth (thick), and motion (thick), the functional transformations unique to V2 were characterized (Roe, 2003; Roe et al., 2009; Lu et al., 2010). An important viewpoint that emerged is that functional organization matters. That is, specific clustering of neurons provides insight into the functional computations that are emphasized (or more readily made) in a particular cortical area. Indeed, it is possible that such functional organizational signatures which are unique to each area, if sufficiently understood, may be used to characterize the fundamental computations performed by each cortical area. We will return to this notion at the end of this review.
Color and Brightness Representation in V4
Color Inputs to V4
Color vision begins with the L, M, and S cones in the retina. The cone names derive from their peak wavelength (at 562 nm, 535 nm, 440 nm, respectively). The cone classes do not correspond to our perception of “red” “green” and “blue”; rather, our perception of color requires multiple stages of L, M, S input integration (Chatterjee and Callaway, 2003; Gegenfurtner and Kiper, 2003; Solomon and Lennie, 2007; Conway et al., 2010). An important early stage is the generation of color-opponency: red-green neurons detect differences in L and M cone inputs, blue-yellow neurons compare S and L+M inputs, and light-dark neurons sum L and M cone inputs. These comparisons form the two cardinal color axes and orthogonal luminance axis, and are represented by discrete classes of neurons in the lateral geniculate nucleus (Derrington et al., 1984). Within V1, color opponency is further elaborated and is dominated by cells with responsiveness along the blue-yellow and red-green axes (Dow and Gouras, 1973; Livingstone and Hubel, 1984; Ts’o and Gilbert, 1988; Lennie et al., 1990; Hanazawa et al., 2000; Conway, 2001; Conway and Livingstone, 2006; Xiao et al., 2007). While V1 plays an important role in generating color, it does not contain a representation corresponding to perception (e.g., perception of hues, color constancy, Brouwer and Heeger, 2009; Parkes et al., 2009). It is not until V2 that the first evidence for hue maps (i.e., red, orange, yellow, green, blue, purple, etc.) arises; these hue maps are found in V2 thin stripes (Xiao et al., 2003). An important open question concerns the mechanisms that transform the cone signals into neurons that code hue, and whether the color-tuned neurons in V4 inherit their color preferences or compute them within V4 (Conway, 2009).
Brightness
Both color and achromatic brightness (light-dark) are important stimulus features that define object surfaces. Brightness perception is subject to many of the same types of contextual influences as color perception (e.g., filling in, Krauskopf, 1963; contextual effects such as lightness constancy and color constancy effects, MacEvoy and Paradiso, 2001; edge-induced percepts such as Cornsweet brightness illusion, Roe et al., 2005, and water color illusion, Pinna et al., 2001). As shown by human functional imaging (Engel and Furmanski, 2001) and electrophysiological studies in monkeys (Livingstone and Hubel, 1984; Roe and Ts’o, 1995), at the level of V1, evidence suggests that color and brightness are largely encoded independently. Little is known about brightness representation in V4.
Is V4 a Color Area?
In his early studies, Zeki reported that the bulk of recorded cells in macaque V4 were color selective and that cells with similar color preferences were clustered in columnar fashion. Subsequent studies have also found a significant clustering of color cells in V4: some clusters contain neurons with similar color preferences and others with diverse color preferences (Kotake et al., 2009). This is consistent with the color domains revealed by functional imaging and may suggest further diversity of color domains. Earlier studies reported that V4 neurons were in fact no more selective for color than were neurons in other visual areas and that they were also selective for other stimulus dimensions (Schein et al., 1982; Tanaka et al., 1986) (although there may be a greater degree of multipeaked chromatic tuning curves than in V1 or V2) (Hanazawa et al., 2000). However, note that differences may only emerge under stimulus conditions that elicit differences (e.g., color constancy, see below). Despite the diversity of response types in V4, the association of V4 with color processing remains and is even used as a strong criterion for identifying V4 response in human studies.
Color Constancy
An important aspect of V4 is its role in color constancy. Color constancy refers to the perception that objects maintain a constant color despite the fact that under different illumination conditions the wavelength composition of light reflected from the object changes significantly. In other words, a red apple remains red whether it is in shadow or under sunlight. Although some aspects of color and brightness constancy (Figure 5A) may arise as early as V1 or V2 (MacEvoy and Paradiso, 2001; Conway, 2001; Moutoussis and Zeki, 2002; Shapley and Hawken, 2002), the effects become quite prominent in V4 (Zeki, 1983). Using Mondrian-type stimuli (see Figure 5A, left), Kusunoki and colleagues (2006) found that changing the illumination of the background shifted the tuning of V4 neurons; cells shifted their color-tuning function in the direction of the chromatic change of the illuminant, matching the psychophysical percept (also Schein and Desimone, 1990). In contrast, colored surrounds do not change the chromatic tuning of cells in V1 or V2 (Solomon et al., 2004). Consistent with this finding, lesions of V4 leave color discrimination intact but lead to loss of color constancy perception (in monkeys: Heywood et al., 1992; Walsh et al., 1993; in man: Vaina, 1994). These findings give rise to the speculation that the color domains identified in V4 by functional imaging could be color-constant domains and not hue-selective domains per se, something which remains to be examined. Another open question concerns the degree to which the color modules within V4 are functionally independent of other feature domains. Psychophysically color constancy is dependent on scene segmentation; that is, color constancy is maintained within a depth plane but less so across depth planes (Werner, 2006). This suggests the presence of significant interactions between representations of different feature modalities (e.g., color and depth) in V4.
Figure 5. Examples of Transformations in V4.

(A) Color: color constancy (left) and lightness constancy (right).
(B) Shape: curvature, sparse coding of curvature.
(C) Depth: binocular correspondence, size constancy.
(D) Motion: motion contrast-defined shape.
Color Contrast-Defined Form
A recent finding points to the distinction between objects defined by high-contrast achromatic borders and equiluminant color-contrast borders. Bushnell et al. (2011b) report roughly a quarter of cells in V4 exhibit greatest response when shapes are presented at equiluminance to the background and decreasing response with increasing figure-ground luminance contrast. This response type, which has not been observed in either V1 or V2, suggests that chromatically defined boundaries and shapes are a defining feature of V4 and further strengthens the role of V4 in color processing. It also introduces the concept that there may be two distinct form pathways, one for high-contrast-defined form and another for color-defined form.
Is V4 a Color Area in Humans?
There is evidence from humans which favors the existence of an extrastriate “color area.” Stroke patients with particular circumscribed lesions of the ventral cortex acquire a deficit of color vision (achromatopsia) yet retain the ability to perceive shape, motion and depth. Imaging studies of healthy human brains show localization of extrastriate color responses to a region on the ventral surface of the brain (although whether this area is within V4 proper or is an area anterior to V4 remains debated) (Barbur and Spang, 2008; Bartels and Zeki, 2000; Hadjikhani et al., 1998; Mullen et al., 2007; Wade et al., 2008). Note that the correspondence of monkey V4 and proposed human “color area” and human cerebral achromatopsia remains in question (cf. Cowey and Heywood, 1997). Importantly, pattern analysis of fMRI responses to colored gratings in humans has shown that the spatial distribution of responses within this region covaries with perceived color, a result that is not found for other visual areas such as V1 (Brouwer and Heeger, 2009). Moreover, microstimulation of this region in humans elicits a color percept (Murphey et al., 2008). To the extent that color is considered a surface property, activation in V4 also appears to correlate with surface perception (Bouvier et al., 2008).
Thus, in the larger debate of whether there is a cortical area(s) specialized for processing color information, the weight of the evidence is suggestive that V4 does perform a transformation that is unique and is central to color perception. Such an important stage is also distinct from higher areas in inferotemporal cortex where functions such as color categorization occur (Koida and Komatsu, 2007) and where color and other object features are combined to generate recognition of objects.
Shape Representation in Area V4
A number of studies have demonstrated that V4 neurons are at least as selective for shape as they are for color. Similar to earlier processing stages, V4 cells are tuned for orientation and spatial frequency of edges and linear sinusoidal gratings (Desimone and Schein, 1987). However, V4 neurons are also sensitive to more complex shape properties (Kobatake and Tanaka, 1994).
Curvature
One advanced shape property represented in V4 is curvature. Curvature, which can be considered an integration of oriented line segments, is a prominent feature of object boundaries. V4 cells (receptive fields typically 2–10 deg in size) can be strongly selective for curvature of contours (Pasupathy and Connor, 1999, 2001) as well as curved (i.e., non-Cartesian) gratings (Gallant et al., 1993, 1996). Interestingly, a similar curvature-based coding strategy appears to be used at intermediate levels of the somatosensory system (Yau et al., 2009). One proposal suggests that curvature tuning in V4 helps provide an efficient way to encode shape. In fact, recordings from V4 neurons reveal that not all curvatures are equally represented: there is a stronger representation of acute curvatures across the neural population (Carlson et al., 2011) (Figure 5B, right). In visual scenes, acute curvatures are statistically relatively rare but highly diagnostic, so, quite distinct from V1 where all local contour segments are faithfully represented, the V4 bias can be characterized as a sparse, discriminative representation of object shape (Carlson et al., 2011).
Encoding of Object-Based Coordinates
Another important aspect of shape coding that emerges in V4 is the transition from retinotopic coordinates to object-centered coordinates. Several lines of evidence suggest that V4 cells are very sensitive to the relative position of texture and contour features within the receptive field, rather than the absolute position of those features. For example, the relative responses of a V4 neuron to a variety of non-Cartesian grating patterns remains constant as those patterns are shifted across the receptive field (Gallant et al., 1996). V4 cells are extremely sensitive to the position of contour fragments within objects. For example, a given V4 cell may respond to convex contour fragments near the top of a shape but not near the bottom (Pasupathy and Connor, 2001). This invariance to relative position may be related to the observation that V4 neurons encode information about the position of stimuli relative to the center of attention (Connor et al., 1996, 1997). Tuning for relative position appears to extend across larger regions of retinotopic space at subsequent stages of processing in inferotemporal cortex (Brincat and Connor, 2004; Yamane et al., 2008). Representation of relative position is critical for any structural shape coding scheme, and current evidence suggests that V4 cells carry sufficient contour shape and relative position information for reconstruction of moderately complex shape boundaries at the population level (Pasupathy and Connor, 2002).
Shape and Human V4
Until relatively recently most of the work on area V4 came from studies using animal models, particularly the macaque monkey. Human studies relied on the rare observation of neurological patients with circumscribed lesions to V4 (Rizzo et al., 1992; Gallant et al., 2000; Merigan et al., 1997). These lesion studies showed that lesions to human V4 have effects similar to V4 lesions in nonhuman primates (De Weerd et al., 1996, 2003; Merigan, 1996, 2000; Merigan and Pham, 1998; Schiller, 1995) and that human V4 lesions affect curvature discrimination (Gallant et al., 2000). More recent fMRI studies suggest that area V4 in humans is activated preferentially by concentric and radial gratings (Wilkinson et al., 2000) and textures (Dumoulin and Hess, 2007).
Computational Models
Computational models have been used to predict object shape from activity of neuronal populations in V4. Responses of V4 have been defined in stimulus subspace, such as contour curvature. The aim is, using V4 responses to one specific subset of (basis) curves, to read out contour curvatures from a population of V4 neuronal responses (Pasupathy and Connor, 2002). Unfortunately, no current neuronal model of V4 provides good predictions of responses to natural images (David et al., 2006). Voxel-based models of V4 developed using fMRI also provide poor predictions of responses to natural scenes, though they perform as well as neuronal models in both earlier and later areas (Naselaris et al., 2009).
There are several possible reasons why current computational models of V4 perform poorly. It could be that V4 represents complex aspects of shape that cannot be captured by the second-order nonlinearities assumed in current models (David et al., 2006). Preliminary reports suggest that this may be true for at least a subset of V4 neurons (J.L.G. and C.E.C., unpublished data). Another possibility is that V4 represents aspects of shape that are more complex than current mathematical models allow. For example, if V4 neurons represent the three-dimensional structure of occluded surfaces then there would be no way to represent this aspect of selectivity using current computational models (Lee et al., 2001).
Depth Representation in V4
Binocular Disparity Inputs to V4
We perceive depth in visual scenes by detecting small positional differences between corresponding visual features in the left eye and right eye images. This difference is called binocular disparity and permits binocular depth perception, or stereopsis. Disparity-selective response is initially established in V1 (Poggio and Fischer, 1977), where single neurons exhibit sensitivity to a narrow range of depths (measured by the width of disparity tuning curves). In V2, disparity selective neurons are found throughout the thin, pale, and thick stripes, but are most prevalent in the thick stripes (Livingstone and Hubel, 1988; Peterhans and von der Heydt, 1993; Roe and Ts’o, 1995; Ts’o et al., 2001). The association with thick stripes in V2 is reinforced by the presence of functional maps for near-to-far depth in thick stripes (Chen et al., 2008). Since V2 provides inputs both to dorsal (via thick stripes, DeYoe and Van Essen, 1985; Shipp and Zeki, 1985, 1989; Nascimento-Silva et al., 2003) and ventral (via thin and pale stripes, DeYoe and Van Essen, 1985; Nakamura et al., 1993; Nascimento-Silva et al., 2003) pathways, it raises the issue of how these disparity are differentially used in the two pathways.
Role of Disparity Selective Responses in V4 in Fine Depth Perception
Although binocular disparity has traditionally been considered a dorsal pathway function (e.g., Livingstone and Hubel, 1988; Sakata et al., 1997; Gonzalez and Perez, 1998), recent physiological studies are overturning this long-standing belief. Indeed, V4 cells exhibit selectivity for binocular disparity (Hinkle and Connor, 2001, 2005; Watanabe et al., 2002; Tanabe et al., 2004, 2005; Hegdé and Van Essen, 2005a), disparity-defined shape in random-dot stereograms (Hegdé and Van Essen, 2005b), and 3-D orientation of bars (Hinkle and Connor, 2002). As shown by studies in both monkeys and humans, these response characteristics are consistent with the use of disparity cues in the ventral pathway for object recognition (fine stereopsis involving higher spatial frequencies, retinal disparities < 0.5 deg, stationary or slowly moving objects), and are distinct from those in the dorsal pathway for vision related to motion, self-motion, and visually guided behavior (coarse steropsis involving lower spatial frequencies, larger retinal disparities between 0.5–10 deg, and moving targets) (Neri et al., 2004; Parker, 2007; Preston et al., 2008). Further confirming V4’s role in fine depth perception, microstimulation in V4 biases behavioral judgment of fine depth (Shiozaki et al., 2012), whereas microstimulation of MT biases behavioral judgment of coarse but not fine depth (Uka and DeAngelis, 2006). Consistent with these results, V4 and IT neurons show trial-by-trial response variation correlated with fine depth judgment (Uka et al., 2005; Shiozaki et al., 2012), while MT neuron responses correlate with coarse depth judgment (Uka and DeAngelis, 2004).
Binocular Matching
To calculate binocular disparity, how does the visual system find the appropriate matching between left and right eye images? A very useful tool for investigating this “binocular correspondence problem” is the random dot stereogram (RDS, Figure 5C, left), a stimulus in which 3D structure is perceived only with appropriate matching of dots in left and right eyes (Julesz, 1972). The degree of spatial shift of dots between the left and right eyes determines the depth plane perceived. To probe what stage in the visual system binocular correspondence is computed, a control (anticorrelated RDS, aRDS) was designed in which the matching dots were reversed in contrast (e.g., black in left eye to white in right eye, called “false matches”); this contrast reversal prevents binocular correspondence and results in lack of surface-in-depth percept (Julesz, 1972; Tanabe et al., 2008; Doi et al., 2011). Neurophysiological studies revealed that cells in V1 exhibit similar responsiveness to RDS and aRDS stimuli (Ohzawa et al., 1990; Qian and Zhu, 1997; Cumming and Parker, 1997). In contrast, V4 cells substantially reduce their selectivity to disparities in aRDSs, suggesting that the false matching responses elicited in V1 are largely rejected by the stage of V4 (Tanabe et al., 2004; Kumano et al., 2008). Although there is no evidence from single unit studies of any difference in binocular correspondence between V1 and V2 (Okazaki and I.F., unpublished data), Chen et al. (2008) reported that in V2 thick stripes, near-to-far maps are imaged in response to RDSs, but not aRDSs, suggesting that V2 also plays an important role in rejecting false matches.
Conversion of Absolute Disparity to Relative Disparity
Disparity cues can be used to calculate absolute distance from the observer. However, a more important function is the determination of distance relative to a background or another object (Westheimer, 1979; Erkelens and Collewijn, 1985; Regan et al., 1986). This requires calculation of relative disparity. Whereas cells in V1 encode local absolute disparity within their receptive field (Cumming and Parker, 2000), the computation of relative disparity begins in V2 (Cumming and Parker, 1999; Thomas et al., 2002). Some cells in V2 exhibit shifts in disparity tuning with shifts in plane of the background, thereby signaling depth relative to the background depth plane (Thomas et al., 2002). In V4, a much higher proportion of cells display such shifts in disparity tuning, and, furthermore, the magnitudes of these shifts are greater than those for V2 (Umeda et al., 2007). Thus, V4 is a stage central to the calculation of relative disparity between spatially adjacent visual planes, a function highly important for fine depth perception and figure-ground segregation.
Roles in Size Constancy
Size constancy refers to our ability to perceive the size of an object despite different viewing distances (Figure 5C, right). To achieve this, information regarding the differences in retinal image size at different viewing distances must be incorporated with information about object distance. Where and how does this computation occur? The first electrophysiological study to address this question found that neurons in V4 vary their responses relative to size and distance of the viewing plane (Dobbins et al., 1998). More recently, Fujita and Tanaka hypothesized that V4 compensates for change in retinal image size by using visual cues for depth, and then calibrates for the perceived size. In the majority of V4 neurons studied, when stimuli were presented with larger crossed disparities (nearer), the size tuning curves of these cells shifted toward larger size preferences. Thus, V4 neurons may contribute to size constancy by systematically changing theirsize tuning depending on the viewing distance from objects. Consistent with these findings, lesions of V4 (prestriate cortex) (Ungerleider et al., 1977), but not parietal cortex (Humphrey and Weiskrantz, 1969), result in loss of size constancy.
3D Shape
While most neurophysiological research has focused on 2D shape representation, recent work has demonstrated strong representation of 3D shape information in V4 and elsewhere in the ventral pathway. Many V4 neurons are robustly tuned for 3D surface/edge orientation, in a depth-invariant manner (Hinkle and Connor, 2002). V4 neurons are also sensitive to more complex 3D surface shaped based on binocular disparity and shading cues (Hegdé and Van Essen, 2005b; Arcizet et al., 2009). Explicit coding of 3D surface shape in IT (Janssen et al., 1999; Yamane et al., 2008) is likely supported by inputs from such V4 neurons.
Motion Representation in V4
Some Neurons in V4 Are Direction Selective
Due to the strong association of motion with the dorsal pathway, the role of V4 in motion processing has long been neglected. This has been true despite the number of studies that have shown considerable direction selectivity in V4 (Mountcastle et al., 1987; Desimone and Schein, 1987; Ferrera et al., 1994; Tolias et al., 2005). Depending on the directional criterion used, up to a third of V4 neurons have been characterized as direction selective. Estimates range from about 5% if assessed within the globs (Conway et al., 2007) or 13% overall (preferred: null direction criterion of 10:3, Desimone and Schein, 1987) to about 33% (preferred: null criterion 2:1, Ferrera et al., 1994) (see also Tolias et al., 2005). Although the proportion of direction-selective neurons in V4 is much less than in MT where roughly 90% of neurons exhibit direction selectivity (Albright et al., 1984), it is not dissimilar from that in V1 (20%–30%, e.g., Orban et al., 1986) or V2 (~15%, e.g., Levitt et al., 1994).
Presence of Direction-Selective Domains in V4
In monkey early visual cortex, clustering of direction selective neurons was observed in V2 thick/pale stripes, but not in V1 (Lu et al., 2010). Recent optical imaging studies in anesthetized monkeys (H.L., Chen, and A.W.R., unpublished data) reported clustering of direction-selective response in foveal regions of V4. The presence of directional domains suggests that motion information plays a significant role in V4 processing and that directionality is not merely a residual signal inherited from earlier visual areas.
Motion Contrast-Defined Shape
If there is such significant presence of directional response in V4, what role does it play in the ventral processing stream? One possibility is that motion information in V4 is used for figure-ground discrimination during object motion (Figure 5D). As elegantly put forth by Braddick (1993), a moving object contains a velocity map that separates itself from its background. Based on this velocity map, two types of information are extracted: one for determining the direction and speed of the moving object, one for identifying the object from its background. To determine the global direction and speed of an object, a motion integration process is required because early direction neurons only detect local motion (i.e., the “aperture problem”). On the other hand, to distinguish an object from its background, a differential process is required (cf. Zhou et al., 2000). As previously hypothesized, these two motion functions may be subserved by two different motion pathways, a motion integration process in the dorsal stream (V1→MT→MST) and a motion differentiation process in the ventral stream (V1→V2→V4) (Braddick, 1993).
There is some evidence to support this hypothesis. Ventral and dorsal stream motion signals are anatomically distinguishable from the initial stages of cortical processing. As early as V1, two classes of directional cells can be distinguished in different sublayers of layer 4B (Nassi and Callaway, 2007). MT-projecting V1 cells, which are large cells in lower layer 4B underlying blobs, mediate fast transmission of magnocellular-drive input. V1 neurons projecting to the ventral stream are smaller, slower, and positioned to integrate magnocellular and parvocellular derived inputs. At the next stage in the ventral pathway, in V2, neurons in the thick stripes are known to be sensitive to coherent-motion-defined lines (Peterhans and von der Heydt, 1993) and exhibit orientation selectivity for both differential motion-defined borders and luminance contrast-defined borders (Marcar et al., 2000). Consistent with these electrophysiological findings, optical imaging studies demonstrate that orientation domains in thick/pale stripes are invariant for luminance borders and motion contrast-defined borders (H.L. et al. unpublished data), suggesting a common functional organization for contour processing in V2 thick stripes.
This cue-invariant border recognition process is also found in V4. Mysore et al. (2006) examined V4 responses to motion contours (borders between two patches of random dots drifting in different directions). They found that a significant proportion of V4 neurons showed selectivity to the orientation of such second-order contours and similar orientation selectivity to first- and second-order contours. Imaging studies have also revealed motion-contour orientation maps in V4 similar to conventional orientation maps (H.L. et al. unpublished data). Thus, the nature of motion signals described thus far is consistent with the role of V4 in detecting differential motion. Such a “motion differentiation process” may play a central role in figure-ground segregation.
Role in Figure-Ground Segregation
The summaries presented here suggest that V4 plays a role in the representation of a complex array of visual stimulus features. These include: surface features such as color, luminance, shading, texture (Arcizet et al., 2008, 2009); color constancy and lightness constancy (Figure 5A); contour features such as orientation and curvature (Figure 5B); depth cues that contribute to binocular correspondence, relative disparity, and size constancy (Figure 5C); and motion cues that are used for motion contrast border identification (Figure 5D). However, the functional role of V4 in visual processing is not yet clear. Is there a common functional transformation that V4 performs across these multiple feature modalities? A better understanding of V4 function may come from studies that directly compare responses to multiple featural spaces, akin to those that have been conducted in V2 (e.g., Roe et al., 2009 for review) and in inferotemporal areas (e.g., Vinberg and Grill-Spector, 2008).
Although we as yet lack a unifying hypothesis of V4 function, several lines of evidence point to V4’s role in figure-ground segregation. Such a role would require at minimum the following computations (depicted in Figure 6):
Figure 6. Transformations in V4 for Figure-Ground Segregation.

(A) Differentiation of In versus Out.
(B) Surface-border integration (e.g., border assigned surface color in watercolor effect, Pinna et al., 2001).
(C) Figural integration (e.g., integration of contour, and inference behind occluders).
(D) Invariance of shape across multiple cues.
(E) Context-dependency (e.g., face-vase).
In versus Out (Figure 6A)
As early as V1, neurons exhibit enhanced activity when their receptive fields lie in figure regions compared to ground regions (Lamme, 1995; cf. Knierim and van Essen, 1992; Kastner et al., 1999), consistent with placing greater emphasis on figure over ground.
Featural Integration (Figure 6B)
In V2, studies suggest associations are first created between borders and surfaces. By measuring responses to Cornsweet stimuli (a stimulus in which a luminance contrast at an edge induces an illusory surface brightness contrast across the edge), studies using both imaging (Roe et al., 2005) and neuronal cross correlation (Hung et al., 2007) showed that edges “capture” surfaces, and thereby lead to integration of border and surface. These Cornsweet responses were found in thin stripes of V2, a well known source of inputs to V4. Such surface capture has also been described with disparity cues for V2 cells (Bakin et al., 2000). In this case, Kaniza-induced illusory edges perceived in depth due to disparity cues “capture” texture elements on the surface despite the fact that those elements lack any disparity cues. Border-surface association has also been demonstrated by von der Heydt and colleagues. In what they call “border ownership” response, they find that responses in V2 and V4 depend on the side on which a luminance-defined figure belongs (Zhou et al., 2000). Such surface capture is also associated with stereoscopic depth, as near disparity response at edges tends to be associated with the figure-side of displays (described for V2 cells in Qiu and von der Heydt, 2005). Thus, using different feature cues, V4 enhances “figureness” by differential neuronal response to the figure versus the ground side of the border.
Figural Integration (Figure 6C)
Featural integration has been examined in studies of colinearity (e.g., Li et al., 2006) and contour completion. The existence, in early visual pathway, of neural response underlying contour completion across gaps is well described (e.g., in V1, Sugita, 1999; in V2, Peterhans and von der Heydt, 1989; Bakin et al., 2000). There are to date few studies of the role of V4 in figural completion behind occluders. However, one recent study compared responses of V4 neurons to real and “accidental” contours (contours produced by the occluder which do not provide information about the true shape of the object) (Bushnell et al., 2011a). This study found that responses to accidental contours were suppressed relative to real object contours, a suppression that disappeared with introduction of small gaps between the occluder and occluded objects. This suggests that V4 is an important stage in image segmentation.
Cue Invariant Shapes (Figure 6D)
As objects typically can be defined by multiple features (e.g., color, motion, depth, contour), another important step in figure-ground segregation involves border-surface associations across multiple cues. As shown in Figure 6D, a square shape can be defined by luminance contrast, color, depth, or motion contrast cues. Whether such invariance at mid-level processing stages is established by integration across multiple feature-specific input maps from V2 or via intra-V4 circuitry is unknown. Although the number of studies examining invariance in V4 is still limited, recent reports do support cue invariant shape coding in V4. Mysore et al. (2008) have described invariant V4 responses to shapes defined by either static or moving cues. In a study by Handa et al. (2010), monkeys were trained on a cue dependent shape discrimination task (dependent on either a motion cue or luminance cue). About a third of the neurons in V4 responded selectively to a shape under both the motion and the luminance cue conditions. Further studies are needed to support V4’s role in cue invariant shape recognition.
Context Dependency (Figure 6E)
Central to the task of figure-ground segregation is the ability to modify what is perceived as figure and ground depending on situational cues such as stimulus context and attention. Indeed, there are numerous demonstrations of the ability of the visual system to modify the interpretation of what is figure and what is ground (e.g., the classic vase/face example where the figure is perceived as either a vase or as a pair of face profiles). That neuronal response in V4 is highly adaptable and modifiable will become particularly evident in the following section on attentional modulation. In particular, the role of top-down and bottom-up attentional influences on V4 activity has been a topic of intense investigation in the last two decades. However, only recently has the relationship between object representation and attention come into sharper focus.
IV. V4 Is an Area of Attentional and Contextual Modulation
In the sections above, we have summarized studies on V4’s role in processing object features. There is also a vast literature on attentional effects in V4 (for reviews, Desimone and Duncan, 1995; Chelazzi et al., 2011). Our purpose here is to try and draw ties between these two disparate bodies of literature. In some sense, these two bodies of investigation—object feature encoding and attentional effects—could be classified as studies on “bottom-up” and “top-down” influences in V4, respectively. Both interface in V4 and both selectively shape networks in V4 (cf. Reynolds and Desimone, 2003; Qiu et al., 2007). (Note that for the purposes of this review, although object “salience” may influence attention, we consider this part of the bottom-up process. Here, we use the term “attention” to refer to internally generated, top-down influences.)
We frame our conception of V4 function in terms of “selection”. The visual attention literature commonly uses the term “select” to indicate either a region of space that is selected (spatial attention) or specific object features that are selected (feature attention). In the same vein, objects in the visual scene “select” the neuronal networks in V4 that encode their features. We propose that these two “selection” processes share a common framework. More specifically, we propose that the functional architecture in V4 is the substrate through which both sets of influences are mediated and that, at the neural level, selective modulation of networks in V4 may be fundamentally the same, albeit directed from different sources.
Neuronal Enhancement of Visual Representation in V4
Our perceptual system is continuously confronted with much more information than it can actively deal with. One way to reduce processing load is to select a fraction of the incoming visual information for scrutinized processing. Visual attention achieves this by focusing on a particular location in space (spatial attention) or on certain features of objects (feature attention). The ability to attend appropriately can be negatively affected by having other competing objects (distractors) in the visual field. In the biased competition model of visual attention (Bundesen, 1990; Desimone and Duncan, 1995; Grossberg, 1980), attentional selection is achieved via a competition for neural resources; this competition can be biased in several ways. One source of this bias comes from involuntary, sensory-driven bottom-up mechanisms (e.g., salient attention-attracting stimuli). Another biasing mechanism is voluntary attentional top-down feedback (e.g., internally generated goal-directed attention), which presumably originates in areas outside the visual cortex. The biased competition model states that only those stimuli that win the competition against surrounding distractor stimuli will have further access to higher order neural mechanisms linking percepts to mechanisms sustaining goal-directed actions including systems involved in memory, decision-making and generating motor plans (Desimone and Duncan, 1995; Luck et al., 1997; Moran and Desimone, 1985). One goal of this review is to consider this integrative bottom-up and top-down view in the context of functional organization in V4.
Spatial Attention
Spatial attention has often been characterized as a “spotlight” on a region in space where visual processes appear heightened (e.g., Posner, 1980). At the neural level, attention to a location in space boosts the neural activity of neurons with receptive fields within that attended locale. Such effects have been observed both in dorsal and ventral pathways. It is reported that the levels of enhancement are low in V1 and V2 (typically < 5%) and more robust in areas such as V4 and IT (15%–20% with single stimuli) (e.g., Moran and Desimone, 1985; Desimone and Duncan, 1995; Treue and Maunsell, 1996; Reynolds et al., 1999, 2000; Kastner and Ungerleider, 2000; McAdams and Maunsell, 2000; Chelazzi et al., 2001; Mitchell et al., 2003; Reynolds and Chelazzi, 2004; Cohen and Newsome, 2004). Usually the presence of distractors leads to a reduction of neural response to the stimulus in the receptive field. However, attention can significantly enhance neural response in the presence of distractors (or to low contrast stimuli). This boost in neural activity by spatial attention has been equated with increased sensitivity to stimuli (e.g., to contrast levels), thereby, in a sense, boosting the apparent visibility of an object (e.g., Reynolds et al., 2000; Carrasco et al., 2004).
Although the relationship of neuronal response and BOLD response is still not well understood, boosting of response by attention is also observed in imaging studies. When human subjects attend to cued locations in the visual field, regions of visual cortex that are topographically mapped to these locations exhibit elevated BOLD response (Tootell et al., 1998; Brefczynski and DeYoe, 1999; see also Sasaki et al., 2001; Buracas and Boynton, 2007). In macaque monkeys, optical imaging of V4 in monkeys performing spatial attention tasks also exhibit topographically appropriate elevated hemodynamic signals (Tanigawa and A.W.R., unpublished data). With respect to functional organization in V4, this spatial attention enhances activity of all functional domains falling topographically within the attended locale. Thus, although there are many questions surrounding the relationship between neuronal spiking activity and hemodynamic response, both measures indicate enhancement of response by spatial attention.
Feature-Based Attention
The term “feature attention” has been used to refer to both feature value (e.g., red, green, blue) and feature dimension (e.g., color). Thus the oft-used phrase “feature-based attention” can be understood as both “feature selection” and “dimension selection”. These are two sets of perceptual phenomena with distinct underlying neural mechanisms; both involve specific modulations of V4 neuronal activity. At the neural level, when multiple stimuli are simultaneously presented within the neuron’s RF (e.g., a red vertical bar and a green horizontal bar), attention to the item matching the cell’s preferred stimulus enhances the neuronal response beyond that to the items presented alone.
Feature-Based Attention for Object Selection
One form of feature-based attention uses feature values to identify relevant items in the scene (e.g., the red item; Motter, 1994; Bichot et al., 2005; Chelazzi et al., 1998, 2001). In contrast to spatial attention, behavioral evidence in humans indicates that feature-based attention can affect processing throughout the entire visual field, in a parallel fashion (Sàenz et al., 2003; Maunsell and Treue, 2006). Consistent with this, single-unit recordings from area V4 of macaque conducting feature-based search tasks have revealed that neuronal responses to elements that share the target-defining features are enhanced during the search process, even before the animal locates the designated target. Motter (1994) demonstrated that V4 neurons are differentially activated depending on a match or nonmatch between an instructional cue and the receptive field stimulus. In other words, regardless of spatial geometry, this form of feature-based attention is able to “highlight” all the objects in the visual array that are potentially relevant for the task at hand (Motter, 1994; Chelazzi et al., 1998, 2001; Bichot et al., 2005). Essentially, the mechanism allows privileged processing of these objects, while other objects are effectively filtered out in parallel across the visual array.
Dynamic Feature-Directed Grouping
An important aspect of V4 function is its dynamic and context-dependent response to the visual scene. Here we supply three examples.
Dynamic Shifts in Orientation and Spatial Frequency Tuning
Evidence from a recent study (David et al., 2008) showed that feature-based attention can alter spatial tuning properties of neurons in area V4. Neuronal responses were recorded while animals were deploying both spatial and feature-based attention within the context of a modified match-to-sample task or a free-viewing visual search task. It was found that orientation and spatial frequency tuning of many V4 neurons tended to shift in the direction of the orientation and spatial frequency content of the sought target. The data appeared to be consistent with a matched filter mechanism in which neurons shift tuning to increase the neural representation of relevant features, at the cost of representation of irrelevant features. Thus, feature “highlighting” can occur not only by response enhancement but also by biasing the sensitivity of the neuronal population toward attended features.
Dynamic Tagging of Feature-Associated Objects
Enhancing activity of neurons that encode attended features allows the system to also enhance the representation of whole (or bound) objects containing that feature. For instance, feature-based attention of this sort can aid selection of a designated target element on the basis of color information, e.g., the red item, which then translates into selective processing and discrimination of another feature of the same item, e.g., its shape (e.g., Sohn et al., 2004).
Dynamic Tuning Based on Motor Output
A second form of feature-based attention involves identifying a specific object feature while at the same time ignoring other features of the same object (Fanini et al., 2006; Nobre et al., 2006; Mirabella et al., 2007; Wegener et al., 2008). In contrast to feature tagging of objects, sorting or classifying of objects on the basis of one elemental feature dimension (e.g., color of fruit or shape of fruit, Figure 7A) requires that the unity of perceptual objects be broken down. This type of feature attention was directly examined in a study in which the activity of V4 neurons was recorded while an animal was attending to either the color or the orientation feature dimension of colored oriented bars (four possible colors and four possible orientations) (Mirabella et al., 2007). Monkeys were trained to turn a response lever to the left in response to two of the four colors (red and blue) and two of the four orientations (0° and 45°), and to the right in response to the other two colors (yellow and green) and two orientations (90° and 135°). Monkeys responded (left or right) to color-orientation pairings. To perform the task correctly, the monkeys had to selectively attend to the feature dimension that was cued, while ignoring the other feature dimension. The study reported that responses of V4 neurons to otherwise identical stimuli are modulated depending on the task cue (Figure 7B); remarkably, the selected task-relevant features were “selected” into one of two behaviorally relevant response categories (left versus right). This type of task-dependent neuronal response grouping provides the first evidence that network associations in V4 can be directed, not only by sensory-defined features, but also by top-down motor output categories.
Figure 7. Feature-Dependent Sorting.

(A) Apples and peppers can be sorted based on color while disregarding shape (top-left, bottom-right), or based on shape while disregarding color (top-right and bottom-left). One feature is attended and the other must be ignored. (Courtesy of G. Bertini and M. Veronese.)
(B) A single V4 neuron showing modulation of responses to colored oriented stimuli. Monkeys were trained to respond Left to some color-orient pairings and to respond Right to other pairings. The neuronal firing rate shifts depending on instruction to attend to color or to orientation (modified from Mirabella et al., 2007). See text for further details.
Role of Synchrony
Neuronal firing rate may not be the only means by which attentional signals are mediated. Recent findings suggest that feature-based attention may also act by increasing synchronization among the neurons selective for the relevant features, particularly in the gamma-band (35–70 hz) frequency range (Bichot et al., 2005; Taylor et al., 2005; Womelsdorf and Fries, 2007). In a visual search task that contained an array of objects defined by both color and shape, Bichot et al. (2005) showed that gamma band oscillations occurred more frequently when attended targets fell in the receptive field (both initially and prior to eye movements), suggesting a role for synchrony in feature-guided serial and parallel search. Such enhancements in gamma band oscillation have also been reported to occur during spatial attention tasks (Fries et al., 2001). Furthermore, other studies report that attentional modulation leads to decreased firing rate synchronization in V4, and proposed this as a way to reduce correlated noise and thus enhance signal-to-noise (Mitchell et al., 2009; Cohen and Maunsell, 2009). Participation of enhanced versus decreased correlation may be cell type specific. Mitchell et al. (2007) demonstrated that attentional modulation acts particularly strongly on fast spiking neurons (interneurons) in V4, highlighting a potential role of interneurons in enhancement of gamma synchrony (Tiesinga et al., 2004; Buia and Tiesinga, 2006). Anderson et al. (2011a) found attention affected firing rate differently for bursty versus nonbursty pyramidal cells. How the effects on gamma synchrony relate to neuronal firing enhancement during attention is not clear.
Synchrony has also been proposed to underlie binding of object features, thereby enabling perceptual unity (e.g., Singer and Gray, 1995). Neuronal oscillations of cells in different cortical columns in cat visual cortex may or may not synchronize depending on stimulus geometry (such as spatial separation and feature orientation) (Gray et al., 1989). Enhanced neural synchrony has also been demonstrated when contours are perceived to be part of the same surface but not when interpreted as belonging to different surfaces (Castelo-Branco et al., 2000). Thus, synchrony is a potential way to temporally bind different stimulus features in a cell assembly and provide coherent global percepts. Although our current understanding of the role of synchrony is still evolving (indeed synchrony has been implicated in many mental processes), perhaps it can be viewed as a mechanism for establishing relations (Singer, 1999), whether it be relations within a shape, within an attentional focus, or within a memory trace (e.g., Harris et al., 2003).
Relation to Functional Organization in V4
One hint comes from the association of gamma band oscillation with hemodynamic signals. Hemodynamic signals are thought to be more closely related to local field potentials (LFPs) than to action potentials (Logothetis et al., 2001). In fact, Niessing et al. (2005) reported that optically imaged hemodynamic response strength correlated better with the power of high-frequency LFPs than with spiking activity. Optical imaging of attentional signals in V4 in monkeys has shown enhancement of the hemodynamic response during spatial attention tasks (Tanigawa and A.W.R., unpublished data). This is consistent with reported enhancements in gamma band synchrony (Fries et al., 2001) and predicts that spatial attention acts by elevating response magnitude in all functional domains within the attended locale (Figure 8A). This study also showed that feature-based attention (e.g., attention to color) may be mediated, not via enhancement of imaged domain response, but rather via enhanced correlations between task-relevant functional domains (e.g., color domains) in V4. Thus, feature attention may be mediated via correlation change across the visual field, but only within domains encoding the attended feature (Figure 8B). These differential effects of spatial and feature attention suggest that domain-based networks are dynamically configured in V4.
Figure 8. Means of Attentional Modulation in V4.

(A) Attention can enhance neuronal response within attended region. There is ample evidence for this in spatial attention tasks. Within a topographic region of V4, all functional domains within this region (red disk) exhibit enhanced activation (Tanigawa and A.W.R., unpublished data).
(B) There is accumulating evidence that attention can modulate synchrony between neurons. Here, we depict during a task requiring attention to color, enhancement of synchrony in a network of color domains in V4 (heavy lines) and either no change or decrement in synchrony in a network of orientation domains (light lines). Enhancement of gamma band oscillations has been reported both for tasks requiring feature attention and those involving spatial attention.
Top-Down Influences
We briefly give some consideration to how attentionally mediated reconfiguration of networks in V4 might be directed by top-down influences. V4 receives feedback influences from temporal (DeYoe et al., 1994; Felleman et al., 1997), prefrontal, and parietal areas (Stepniewska et al., 2005; Ungerleider et al., 2008; Pouget et al., 2009). In this sense, V4 is well positioned for integrating top-down influences with information about stimuli from the bottom-up direction.
Causal Interactions between Frontal and Visual Cortical Areas?
Although imaging and neuropsychological studies strongly suggested that feedback signals from fronto-parietal cortex interact with sensory signals in visual areas such as V4, it has been difficult to prove a causal link between activity in frontal (or parietal) cortex and modulation of visually driven activity. One area in prefrontal cortex that has been proposed as a source of top-down influence is the frontal eye fields (FEF), a cortical area responsible for directing eye movements. During overt attention, FEF initiates circuits which direct the center of gaze toward salient objects. During covert attention, similar neuronal mechanisms may be at play (which has led to the “pre-motor theory of attention”) (Corbetta et al., 1998; Corbetta, 1998; Hoffman and Subramaniam, 1995; Kustov and Robinson, 1996; Moore et al., 2003; Moore and Armstrong, 2003; Moore and Fallah, 2001; Moore and Fallah, 2004; Nobre et al., 2000; Rizzolatti et al., 1987). If so, then FEF should play a causal role in directing attention and in influencing V4 activity.
Currently, the only evidence of causal influences from FEF comes from studies of spatial attention. Moore and colleagues provided the first elegant evidence showing such a causal link (Moore and Fallah, 2004). By using microstimulation in FEF, they showed a causal relationship between altered activity in the FEF and spatially specific enhanced visual representations within V4. Second, they showed that microstimulation in FEF increased perceptual abilities at the stimulated visuotopic locations.
More recently, using fMRI methods, Ekstrom and colleagues examined the effect of electrical microstimulation in FEF on visually driven responses in V4 and other extrastriate cortical areas of behaving monkeys (Ekstrom et al., 2008, 2009). They found that voxels in V4 which showed the strongest enhancement of fMRI activity caused by FEF microstimulation were not the voxels with the strongest visual responses, but rather adjacent voxels. In fact, strongly visually driven voxels themselves were unaffected or even suppressed by FEF microstimulation. These results led them to test whether effects of electrical stimulation on visually driven activity in V4 would be stronger in the presence of “distractor” stimuli. Without distractors, electrical stimulation increased fMRI activity in V4. With distractors (which normally cause a decrease in activity), the activity in V4 voxel increased substantially beyond the effect without distractors. These results are consistent with neurophysiological studies that show stronger enhancement in the presence of competitive distractors. The same authors showed in a second study that FEF microstimulation leads to a nonproportional scaling of the contrast-response curve in visual areas including V4, suggesting that attention-induced increase in neural sensitivity can be mediated by top-down influences.
In sum, existing data indicate that top-down feedback modulates activity in V4 in a way that parallels spatial attention effects, and, furthermore, the magnitude of effect depends on specifics of bottom-up stimuli (i.e., presence/absence of distractors, salience). This is clear evidence that V4 integrates both sensory and attentional effects. It remains unknown how such specificity is achieved via anatomical feedback which is described as diffuse, broad and divergent (cf. Rockland and Drash, 1996; Pouget et al., 2009; Anderson et al., 2011b).
V. Conclusion
Association between Feature Representation and Attention: A Proposal
We conclude by trying to link the feature encoding and attentional encoding (cf. Reynolds and Desimone, 2003; Qiu et al, 2007) aspects of V4 with its functional organization. We have seen that V4 encodes a range of stimulus properties (contour, color, motion, disparity) and have proposed that these contribute to figure-ground segregation processes. We have also seen that V4 is prime real estate for mediating bottom-up and top-down attentional effects. We propose (1) as suggested by studies cited in this review, that these feature representations are tied to feature-specific domains within V4, (2) that domains of shared feature selectivity are anatomically and/or functionally linked into feature-specific networks, and (3) that attentional mechanisms map onto these domain networks and shape them in spatially and featurally specific ways.
We suggest that the unifying function of V4 circuitry is to enable selective extraction, whether it be by bottom-up feature-specified shape or by attentionally driven spatial or feature-defined selection (Figure 9). Thus, during bottom-up driven processes, stimulus features select which domains to modulate. During top-down attentional processes, feedback influences select which domains to modulate. This selective modulation creates an active network of functional domains that can be dynamically configured. Under what conditions such selection is mediated by enhancement of activity versus domain-domain correlation requires further investigation. For example, in case of spatial attention, all domains within a restricted region of V4 are networked. In the case of color constancy, a color network is selected. In case of shape representation, orientation domains are networked. In case of color search a color network is also selected, albeit driven by top-down sources. Subsets of color, shape, depth, and motion domains can all be dynamically reconfigured into stimulus-specific or task-specific networks. Shifting attention from one feature to another would be implemented by enhancement of one feature domain network and suppression of another.
Figure 9. Schematic of V4 Functional Organization as Common Subtrate for Object Feature Encoding and Attentional Selection.
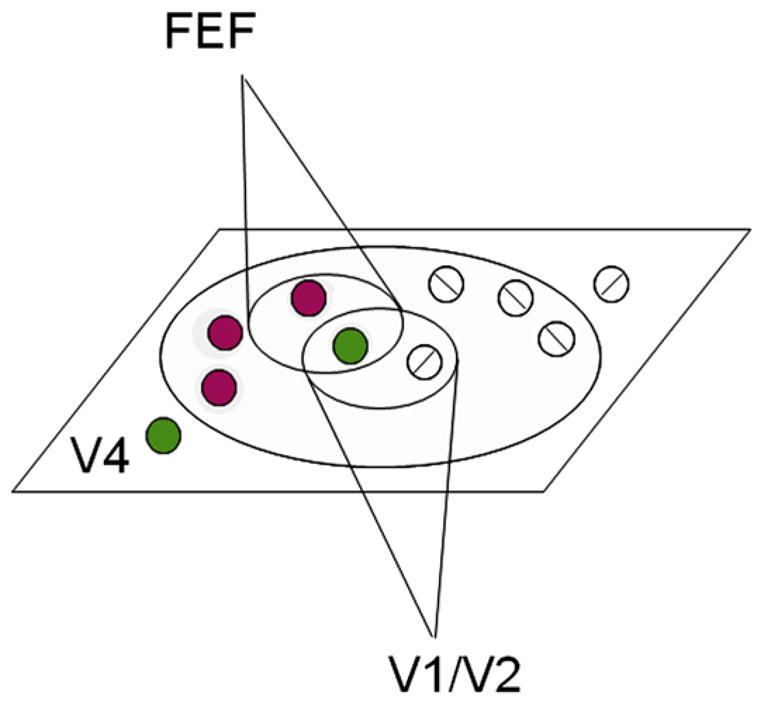
Both feature representation and attention are achieved by selection of networks in V4. Such selection results in enhancement of domain networks, shaped by both top-down (FEF) and bottom-up (V1/V2) influences. Although not depicted, note that during feature attention, such influences can extend beyond the locus of spatial attention. Gray disk: locus of spatial attention. Colored circles: color or luminance domains. White circles: orientation domains.
When viewed in this fashion, there may be surprisingly little difference between object-induced effects and attentionally induced effects. In brief, in terms of functional organization in V4, attending to an object (considered a mental state) may be very similar to making it more visible (considered an object state). Of course, finer neuronal selection is expected beyond domain-based selection. However, when viewed from a domain-based perspective within V4, vision and visual attention may not be so different and may differ largely by association with other brain regions.
References
- Albright TD, Desimone R, Gross CG. Columnar organization of directionally selective cells in visual area MT of the macaque. J Neurophysiol. 1984;51:16–31. doi: 10.1152/jn.1984.51.1.16. [DOI] [PubMed] [Google Scholar]
- Anderson EB, Mitchell JF, Reynolds JH. Attentional modulation of firing rate varies with burstiness across putative pyramidal neurons in macaque visual area V4. J Neurosci. 2011a;31:10983–10992. doi: 10.1523/JNEUROSCI.0027-11.2011. [DOI] [PMC free article] [PubMed] [Google Scholar]
- Anderson JC, Kennedy H, Martin KA. Pathways of attention: synaptic relationships of frontal eye field to V4, lateral intraparietal cortex, and area 46 in macaque monkey. J Neurosci. 2011b;31:10872–10881. doi: 10.1523/JNEUROSCI.0622-11.2011. [DOI] [PMC free article] [PubMed] [Google Scholar]
- Arcizet F, Jouffrais C, Girard P. Natural textures classification in area V4 of the macaque monkey. Exp Brain Res. 2008;189:109–120. doi: 10.1007/s00221-008-1406-9. [DOI] [PubMed] [Google Scholar]
- Arcizet F, Jouffrais C, Girard P. Coding of shape from shading in area V4 of the macaque monkey. BMC Neurosci. 2009;10:140. doi: 10.1186/1471-2202-10-140. [DOI] [PMC free article] [PubMed] [Google Scholar]
- Baizer JS, Ungerleider LG, Desimone R. Organization of visual inputs to the inferior temporal and posterior parietal cortex in macaques. J Neurosci. 1991;11:168–190. doi: 10.1523/JNEUROSCI.11-01-00168.1991. [DOI] [PMC free article] [PubMed] [Google Scholar]
- Bakin JS, Nakayama K, Gilbert CD. Visual responses in monkey areas V1 and V2 to three-dimensional surface configurations. J Neurosci. 2000;20:8188–8198. doi: 10.1523/JNEUROSCI.20-21-08188.2000. [DOI] [PMC free article] [PubMed] [Google Scholar]
- Barbur JL, Spang K. Colour constancy and conscious perception of changes of illuminant. Neuropsychologia. 2008;46:853–863. doi: 10.1016/j.neuropsychologia.2007.11.032. [DOI] [PubMed] [Google Scholar]
- Bartels A, Zeki S. The architecture of the colour centre in the human visual brain: new results and a review. Eur J Neurosci. 2000;12:172–193. doi: 10.1046/j.1460-9568.2000.00905.x. [DOI] [PubMed] [Google Scholar]
- Bichot NP, Rossi AF, Desimone R. Parallel and serial neural mechanisms for visual search in macaque area V4. Science. 2005;308:529–534. doi: 10.1126/science.1109676. [DOI] [PubMed] [Google Scholar]
- Bouvier SE, Cardinal KS, Engel SA. Activity in visual area V4 correlates with surface perception. J Vis. 2008;8:28, 1–9. doi: 10.1167/8.7.28. [DOI] [PubMed] [Google Scholar]
- Braddick O. Segmentation versus integration in visual motion processing. Trends Neurosci. 1993;16:263–268. doi: 10.1016/0166-2236(93)90179-p. [DOI] [PubMed] [Google Scholar]
- Brefczynski JA, DeYoe EA. A physiological correlate of the ‘spotlight’ of visual attention. Nat Neurosci. 1999;2:370–374. doi: 10.1038/7280. [DOI] [PubMed] [Google Scholar]
- Brincat SL, Connor CE. Underlying principles of visual shape selectivity in posterior inferotemporal cortex. Nat Neurosci. 2004;7:880–886. doi: 10.1038/nn1278. [DOI] [PubMed] [Google Scholar]
- Brouwer GJ, Heeger DJ. Decoding and reconstructing color from responses in human visual cortex. J Neurosci. 2009;29:13992–14003. doi: 10.1523/JNEUROSCI.3577-09.2009. [DOI] [PMC free article] [PubMed] [Google Scholar]
- Buia C, Tiesinga P. Attentional modulation of firing rate and synchrony in a model cortical network. J Comput Neurosci. 2006;20:247–264. doi: 10.1007/s10827-006-6358-0. [DOI] [PubMed] [Google Scholar]
- Bundesen C. A theory of visual attention. Psychol Rev. 1990;97:523–547. doi: 10.1037/0033-295x.97.4.523. [DOI] [PubMed] [Google Scholar]
- Buracas GT, Boynton GM. The effect of spatial attention on contrast response functions in human visual cortex. J Neurosci. 2007;27:93–97. doi: 10.1523/JNEUROSCI.3162-06.2007. [DOI] [PMC free article] [PubMed] [Google Scholar]
- Bushnell BN, Harding PJ, Kosai Y, Pasupathy A. Partial occlusion modulates contour-based shape encoding in primate area V4. J Neurosci. 2011a;31:4012–4024. doi: 10.1523/JNEUROSCI.4766-10.2011. [DOI] [PMC free article] [PubMed] [Google Scholar]
- Bushnell BN, Harding PJ, Kosai Y, Bair W, Pasupathy A. Equiluminance cells in visual cortical area v4. J Neurosci. 2011b;31:12398–12412. doi: 10.1523/JNEUROSCI.1890-11.2011. [DOI] [PMC free article] [PubMed] [Google Scholar]
- Buxton RB, Uludag K, Dubowitz DJ, Liu TT. Modeling the hemodynamic response to brain activation. Neuroimage. 2004;23(Suppl 1):S220–S233. doi: 10.1016/j.neuroimage.2004.07.013. [DOI] [PubMed] [Google Scholar]
- Carlson ET, Rasquinha RJ, Zhang K, Connor CE. A sparse object coding scheme in area V4. Curr Biol. 2011;21:288–293. doi: 10.1016/j.cub.2011.01.013. [DOI] [PMC free article] [PubMed] [Google Scholar]
- Carrasco M, Ling S, Read S. Attention alters appearance. Nat Neurosci. 2004;7:308–313. doi: 10.1038/nn1194. [DOI] [PMC free article] [PubMed] [Google Scholar]
- Castelo-Branco M, Goebel R, Neuenschwander S, Singer W. Neural synchrony correlates with surface segregation rules. Nature. 2000;405:685–689. doi: 10.1038/35015079. [DOI] [PubMed] [Google Scholar]
- Chatterjee S, Callaway EM. Parallel colour-opponent pathways to primary visual cortex. Nature. 2003;426:668–671. doi: 10.1038/nature02167. [DOI] [PubMed] [Google Scholar]
- Chelazzi L, Duncan J, Miller EK, Desimone R. Responses of neurons in inferior temporal cortex during memory-guided visual search. J Neurophysiol. 1998;80:2918–2940. doi: 10.1152/jn.1998.80.6.2918. [DOI] [PubMed] [Google Scholar]
- Chelazzi L, Miller EK, Duncan J, Desimone R. Responses of neurons in macaque area V4 during memory-guided visual search. Cereb Cortex. 2001;11:761–772. doi: 10.1093/cercor/11.8.761. [DOI] [PubMed] [Google Scholar]
- Chelazzi L, Della Libera C, Sani I, Santandrea E. Neural basis of visual selective attention. In: Nadel L, editor. Wiley Interdisciplinary Reviews: Cognitive Science. New York: John Wiley & Sons Ltd; 2011. [DOI] [PubMed] [Google Scholar]
- Chen G, Lu HD, Roe AW. A map for horizontal disparity in monkey V2. Neuron. 2008;58:442–450. doi: 10.1016/j.neuron.2008.02.032. [DOI] [PMC free article] [PubMed] [Google Scholar]
- Cohen MR, Maunsell JH. Attention improves performance primarily by reducing interneuronal correlations. Nat Neurosci. 2009;12:1594–1600. doi: 10.1038/nn.2439. [DOI] [PMC free article] [PubMed] [Google Scholar]
- Cohen MR, Newsome WT. What electrical microstimulation has revealed about the neural basis of cognition. Curr Opin Neurobiol. 2004;14:169–177. doi: 10.1016/j.conb.2004.03.016. [DOI] [PubMed] [Google Scholar]
- Connor CE, Gallant JL, Preddie DC, Van Essen DC. Responses in area V4 depend on the spatial relationship between stimulus and attention. J Neurophysiol. 1996;75:1306–1308. doi: 10.1152/jn.1996.75.3.1306. [DOI] [PubMed] [Google Scholar]
- Connor CE, Preddie DC, Gallant JL, Van Essen DC. Spatial attention effects in macaque area V4. J Neurosci. 1997;17:3201–3214. doi: 10.1523/JNEUROSCI.17-09-03201.1997. [DOI] [PMC free article] [PubMed] [Google Scholar]
- Conway BR. Spatial structure of cone inputs to color cells in alert macaque primary visual cortex (V-1) J Neurosci. 2001;21:2768–2783. doi: 10.1523/JNEUROSCI.21-08-02768.2001. [DOI] [PMC free article] [PubMed] [Google Scholar]
- Conway BR. Color vision, cones, and color-coding in the cortex. Neuroscientist. 2009;15:274–290. doi: 10.1177/1073858408331369. [DOI] [PubMed] [Google Scholar]
- Conway BR, Livingstone MS. Spatial and temporal properties of cone signals in alert macaque primary visual cortex. J Neurosci. 2006;26:10826–10846. doi: 10.1523/JNEUROSCI.2091-06.2006. [DOI] [PMC free article] [PubMed] [Google Scholar]
- Conway BR, Tsao DY. Color architecture in alert macaque cortex revealed by FMRI. Cereb Cortex. 2006;16:1604–1613. doi: 10.1093/cercor/bhj099. [DOI] [PMC free article] [PubMed] [Google Scholar]
- Conway BR, Tsao DY. Color-tuned neurons are spatially clustered according to color preference within alert macaque posterior inferior temporal cortex. Proc Natl Acad Sci USA. 2009;106:18034–18039. doi: 10.1073/pnas.0810943106. [DOI] [PMC free article] [PubMed] [Google Scholar]
- Conway BR, Moeller S, Tsao DY. Specialized color modules in macaque extrastriate cortex. Neuron. 2007;56:560–573. doi: 10.1016/j.neuron.2007.10.008. [DOI] [PMC free article] [PubMed] [Google Scholar]
- Conway BR, Chatterjee S, Field GD, Horwitz GD, Johnson EN, Koida K, Mancuso K. Advances in color science: from retina to behavior. J Neurosci. 2010;30:14955–14963. doi: 10.1523/JNEUROSCI.4348-10.2010. [DOI] [PMC free article] [PubMed] [Google Scholar]
- Corbetta M. Frontoparietal cortical networks for directing attention and the eye to visual locations: identical, independent, or overlapping neural systems? Proc Natl Acad Sci USA. 1998;95:831–838. doi: 10.1073/pnas.95.3.831. [DOI] [PMC free article] [PubMed] [Google Scholar]
- Corbetta M, Akbudak E, Conturo TE, Snyder AZ, Ollinger JM, Drury HA, Linenweber MR, Petersen SE, Raichle ME, Van Essen DC, Shulman GL. A common network of functional areas for attention and eye movements. Neuron. 1998;21:761–773. doi: 10.1016/s0896-6273(00)80593-0. [DOI] [PubMed] [Google Scholar]
- Cowey A, Heywood CA. Cerebral achromatopsia: colour blindness despite wavelength processing. Trends Cogn Sci. 1997;1:133–139. doi: 10.1016/S1364-6613(97)01043-7. [DOI] [PubMed] [Google Scholar]
- Cumming BG, Parker AJ. Responses of primary visual cortical neurons to binocular disparity without depth perception. Nature. 1997;389:280–283. doi: 10.1038/38487. [DOI] [PubMed] [Google Scholar]
- Cumming BG, Parker AJ. Binocular neurons in V1 of awake monkeys are selective for absolute, not relative, disparity. J Neurosci. 1999;19:5602–5618. doi: 10.1523/JNEUROSCI.19-13-05602.1999. [DOI] [PMC free article] [PubMed] [Google Scholar]
- Cumming BG, Parker AJ. Local disparity not perceived depth is signaled by binocular neurons in cortical area V1 of the macaque. J Neurosci. 2000;20:4758–4767. doi: 10.1523/JNEUROSCI.20-12-04758.2000. [DOI] [PMC free article] [PubMed] [Google Scholar]
- David SV, Hayden BY, Gallant JL. Spectral receptive field properties explain shape selectivity in area V4. J Neurophysiol. 2006;96:3492–3505. doi: 10.1152/jn.00575.2006. [DOI] [PubMed] [Google Scholar]
- David SV, Hayden BY, Mazer JA, Gallant JL. Attention to stimulus features shifts spectral tuning of V4 neurons during natural vision. Neuron. 2008;59:509–521. doi: 10.1016/j.neuron.2008.07.001. [DOI] [PMC free article] [PubMed] [Google Scholar]
- De Weerd P, Desimone R, Ungerleider LG. Cue-dependent deficits in grating orientation discrimination after V4 lesions in macaques. Vis Neurosci. 1996;13:529–538. doi: 10.1017/s0952523800008208. [DOI] [PubMed] [Google Scholar]
- De Weerd P, Desimone R, Ungerleider LG. Impairments in spatial generalization of visual skills after V4 and TEO lesions in macaques (Macaca mulatta) Behav Neurosci. 2003;117:1441–1447. doi: 10.1037/0735-7044.117.6.1441. [DOI] [PubMed] [Google Scholar]
- DeAngelis GC, Newsome WT. Organization of disparity-selective neurons in macaque area MT. J Neurosci. 1999;19:1398–1415. doi: 10.1523/JNEUROSCI.19-04-01398.1999. [DOI] [PMC free article] [PubMed] [Google Scholar]
- Derrington AM, Krauskopf J, Lennie P. Chromatic mechanisms in lateral geniculate nucleus of macaque. J Physiol. 1984;357:241–265. doi: 10.1113/jphysiol.1984.sp015499. [DOI] [PMC free article] [PubMed] [Google Scholar]
- Desimone R, Duncan J. Neural mechanisms of selective visual attention. Annu Rev Neurosci. 1995;18:193–222. doi: 10.1146/annurev.ne.18.030195.001205. [DOI] [PubMed] [Google Scholar]
- Desimone R, Schein SJ. Visual properties of neurons in area V4 of the macaque: sensitivity to stimulus form. J Neurophysiol. 1987;57:835–868. doi: 10.1152/jn.1987.57.3.835. [DOI] [PubMed] [Google Scholar]
- De Weerd P, Peralta MR, Desimone R, Ungerleider LG. Loss of attentional stimulus selection after extrastriate cortical lesions in macaques. Nat Neurosci. 1999;2:753–758. doi: 10.1038/11234. [DOI] [PubMed] [Google Scholar]
- DeYoe EA, Van Essen DC. Segregation of efferent connections and receptive field properties in visual area V2 of the macaque. Nature. 1985;317:58–61. doi: 10.1038/317058a0. [DOI] [PubMed] [Google Scholar]
- DeYoe EA, Felleman DJ, Van Essen DC, McClendon E. Multiple processing streams in occipitotemporal visual cortex. Nature. 1994;371:151–154. doi: 10.1038/371151a0. [DOI] [PubMed] [Google Scholar]
- Dobbins AC, Jeo RM, Fiser J, Allman JM. Distance modulation of neural activity in the visual cortex. Science. 1998;281:552–555. doi: 10.1126/science.281.5376.552. [DOI] [PubMed] [Google Scholar]
- Doi T, Tanabe S, Fujita I. Matching and correlation computations in stereoscopic depth perception. J Vis. 2011;11:1–16. doi: 10.1167/11.3.1. [DOI] [PubMed] [Google Scholar]
- Dow BM, Gouras P. Color and spatial specificity of single units in Rhesus monkey foveal striate cortex. J Neurophysiol. 1973;36:79–100. doi: 10.1152/jn.1973.36.1.79. [DOI] [PubMed] [Google Scholar]
- Dumoulin SO, Hess RF. Cortical specialization for concentric shape processing. Vision Res. 2007;47:1608–1613. doi: 10.1016/j.visres.2007.01.031. [DOI] [PubMed] [Google Scholar]
- Ekstrom LB, Roelfsema PR, Arsenault JT, Bonmassar G, Vanduffel W. Bottom-up dependent gating of frontal signals in early visual cortex. Science. 2008;321:414–417. doi: 10.1126/science.1153276. [DOI] [PMC free article] [PubMed] [Google Scholar]
- Ekstrom LB, Roelfsema PR, Arsenault JT, Kolster H, Vanduffel W. Modulation of the contrast response function by electrical microstimulation of the macaque frontal eye field. J Neurosci. 2009;29:10683–10694. doi: 10.1523/JNEUROSCI.0673-09.2009. [DOI] [PMC free article] [PubMed] [Google Scholar]
- Engel SA, Furmanski CS. Selective adaptation to color contrast in human primary visual cortex. J Neurosci. 2001;21:3949–3954. doi: 10.1523/JNEUROSCI.21-11-03949.2001. [DOI] [PMC free article] [PubMed] [Google Scholar]
- Erkelens CJ, Collewijn H. Motion perception during dichoptic viewing of moving random-dot stereograms. Vision Res. 1985;25:583–588. doi: 10.1016/0042-6989(85)90164-6. [DOI] [PubMed] [Google Scholar]
- Essen DC, Zeki SM. The topographic organization of rhesus monkey prestriate cortex. J Physiol. 1978;277:193–226. doi: 10.1113/jphysiol.1978.sp012269. [DOI] [PMC free article] [PubMed] [Google Scholar]
- Fanini A, Nobre AC, Chelazzi L. Selecting and ignoring the component features of a visual object: A negative priming paradigm. Vis Cogn. 2006;14:584–618. [Google Scholar]
- Felleman DJ, Xiao Y, McClendon E. Modular organization of occipito-temporal pathways: cortical connections between visual area 4 and visual area 2 and posterior inferotemporal ventral area in macaque monkeys. J Neurosci. 1997;17:3185–3200. doi: 10.1523/JNEUROSCI.17-09-03185.1997. [DOI] [PMC free article] [PubMed] [Google Scholar]
- Ferrera VP, Rudolph KK, Maunsell JH. Responses of neurons in the parietal and temporal visual pathways during a motion task. J Neurosci. 1994;14:6171–6186. doi: 10.1523/JNEUROSCI.14-10-06171.1994. [DOI] [PMC free article] [PubMed] [Google Scholar]
- Fize D, Vanduffel W, Nelissen K, Denys K, Chef d’Hotel C, Faugeras O, Orban GA. The retinotopic organization of primate dorsal V4 and surrounding areas: A functional magnetic resonance imaging study in awake monkeys. J Neurosci. 2003;23:7395–7406. doi: 10.1523/JNEUROSCI.23-19-07395.2003. [DOI] [PMC free article] [PubMed] [Google Scholar]
- Fries P, Reynolds JH, Rorie AE, Desimone R. Modulation of oscillatory neuronal synchronization by selective visual attention. Science. 2001;291:1560–1563. doi: 10.1126/science.1055465. [DOI] [PubMed] [Google Scholar]
- Gallant JL, Braun J, Van Essen DC. Selectivity for polar, hyperbolic, and Cartesian gratings in macaque visual cortex. Science. 1993;259:100–103. doi: 10.1126/science.8418487. [DOI] [PubMed] [Google Scholar]
- Gallant JL, Connor CE, Rakshit S, Lewis JW, Van Essen DC. Neural responses to polar, hyperbolic, and Cartesian gratings in area V4 of the macaque monkey. J Neurophysiol. 1996;76:2718–2739. doi: 10.1152/jn.1996.76.4.2718. [DOI] [PubMed] [Google Scholar]
- Gallant JL, Shoup RE, Mazer JA. A human extrastriate area functionally homologous to macaque V4. Neuron. 2000;27:227–235. doi: 10.1016/s0896-6273(00)00032-5. [DOI] [PubMed] [Google Scholar]
- Gattass R, Sousa AP, Gross CG. Visuotopic organization and extent of V3 and V4 of the macaque. J Neurosci. 1988;8:1831–1845. doi: 10.1523/JNEUROSCI.08-06-01831.1988. [DOI] [PMC free article] [PubMed] [Google Scholar]
- Gegenfurtner KR, Kiper DC. Color vision. Annu Rev Neurosci. 2003;26:181–206. doi: 10.1146/annurev.neuro.26.041002.131116. [DOI] [PubMed] [Google Scholar]
- Ghose GM, Ts’o DY. Form processing modules in primate area V4. J Neurophysiol. 1997;77:2191–2196. doi: 10.1152/jn.1997.77.4.2191. [DOI] [PubMed] [Google Scholar]
- Girard P, Lomber SG, Bullier J. Shape discrimination deficits during reversible deactivation of area V4 in the macaque monkey. Cereb Cortex. 2002;12:1146–1156. doi: 10.1093/cercor/12.11.1146. [DOI] [PubMed] [Google Scholar]
- Goddard E, Mannion DJ, McDonald JS, Solomon SG, Clifford CW. Color responsiveness argues against a dorsal component of human V4. J Vis. 2011;11:1–21. doi: 10.1167/11.4.3. [DOI] [PubMed] [Google Scholar]
- Gonzalez F, Perez R. Neural mechanisms underlying stereoscopic vision. Prog Neurobiol. 1998;55:191–224. doi: 10.1016/s0301-0082(98)00012-4. [DOI] [PubMed] [Google Scholar]
- Gray CM, König P, Engel AK, Singer W. Oscillatory responses in cat visual cortex exhibit inter-columnar synchronization which reflects global stimulus properties. Nature. 1989;338:334–337. doi: 10.1038/338334a0. [DOI] [PubMed] [Google Scholar]
- Grossberg S. How does a brain build a cognitive code? Psychol Rev. 1980;87:1–51. doi: 10.1007/978-94-009-7758-7_1. [DOI] [PubMed] [Google Scholar]
- Hadjikhani N, Liu AK, Dale AM, Cavanagh P, Tootell RB. Retinotopy and color sensitivity in human visual cortical area V8. Nat Neurosci. 1998;1:235–241. doi: 10.1038/681. [DOI] [PubMed] [Google Scholar]
- Hanazawa A, Komatsu H, Murakami I. Neural selectivity for hue and saturation of colour in the primary visual cortex of the monkey. Eur J Neurosci. 2000;12:1753–1763. doi: 10.1046/j.1460-9568.2000.00041.x. [DOI] [PubMed] [Google Scholar]
- Handa T, Inoue M, Mikami A. Neuronal activity during discrimination of shapes defined by motion in area V4. Neuroreport. 2010;21:532–536. doi: 10.1097/WNR.0b013e3283393a5f. [DOI] [PubMed] [Google Scholar]
- Hansen KA, Kay KN, Gallant JL. Topographic organization in and near human visual area V4. J Neurosci. 2007;27:11896–11911. doi: 10.1523/JNEUROSCI.2991-07.2007. [DOI] [PMC free article] [PubMed] [Google Scholar]
- Harada T, Goda N, Ogawa T, Ito M, Toyoda H, Sadato N, Komatsu H. Distribution of colour-selective activity in the monkey inferior temporal cortex revealed by functional magnetic resonance imaging. Eur J Neurosci. 2009;30:1960–1970. doi: 10.1111/j.1460-9568.2009.06995.x. [DOI] [PubMed] [Google Scholar]
- Harris KD, Csicsvari J, Hirase H, Dragoi G, Buzsáki G. Organization of cell assemblies in the hippocampus. Nature. 2003;424:552–556. doi: 10.1038/nature01834. [DOI] [PubMed] [Google Scholar]
- Hegdé J, Van Essen DC. Stimulus dependence of disparity coding in primate visual area V4. J Neurophysiol. 2005a;93:620–626. doi: 10.1152/jn.00039.2004. [DOI] [PubMed] [Google Scholar]
- Hegdé J, Van Essen DC. Role of primate visual area V4 in the processing of 3-D shape characteristics defined by disparity. J Neurophysiol. 2005b;94:2856–2866. doi: 10.1152/jn.00802.2004. [DOI] [PubMed] [Google Scholar]
- Heywood CA, Cowey A. On the role of cortical area V4 in the discrimination of hue and pattern in macaque monkeys. J Neurosci. 1987;7:2601–2617. doi: 10.1523/JNEUROSCI.07-09-02601.1987. [DOI] [PMC free article] [PubMed] [Google Scholar]
- Heywood CA, Gadotti A, Cowey A. Cortical area V4 and its role in the perception of color. J Neurosci. 1992;12:4056–4065. doi: 10.1523/JNEUROSCI.12-10-04056.1992. [DOI] [PMC free article] [PubMed] [Google Scholar]
- Hinkle DA, Connor CE. Disparity tuning in macaque area V4. Neuroreport. 2001;12:365–369. doi: 10.1097/00001756-200102120-00036. [DOI] [PubMed] [Google Scholar]
- Hinkle DA, Connor CE. Three-dimensional orientation tuning in macaque area V4. Nat Neurosci. 2002;5:665–670. doi: 10.1038/nn875. [DOI] [PubMed] [Google Scholar]
- Hinkle DA, Connor CE. Quantitative characterization of disparity tuning in ventral pathway area V4. J Neurophysiol. 2005;94:2726–2737. doi: 10.1152/jn.00341.2005. [DOI] [PubMed] [Google Scholar]
- Hoffman JE, Subramaniam B. The role of visual attention in saccadic eye movements. Percept Psychophys. 1995;57:787–795. doi: 10.3758/bf03206794. [DOI] [PubMed] [Google Scholar]
- Hubel DH, Livingstone MS. Segregation of form, color, and stereopsis in primate area 18. J Neurosci. 1987;7:3378–3415. doi: 10.1523/JNEUROSCI.07-11-03378.1987. [DOI] [PMC free article] [PubMed] [Google Scholar]
- Hubel DH, Wiesel TN. Ferrier lecture. Functional architecture of macaque monkey visual cortex. Proc R Soc Lond B Biol Sci. 1977;198:1–59. doi: 10.1098/rspb.1977.0085. [DOI] [PubMed] [Google Scholar]
- Humphrey NK, Weiskrantz L. Size constancy in monkeys with inferotemporal lesions. Q J Exp Psychol. 1969;21:225–238. doi: 10.1080/14640746908400217. [DOI] [PubMed] [Google Scholar]
- Hung CP, Ramsden BM, Roe AW. A functional circuitry for edge-induced brightness perception. Nat Neurosci. 2007;10:1185–1190. doi: 10.1038/nn1948. [DOI] [PubMed] [Google Scholar]
- Janssen P, Vogels R, Orban GA. Macaque inferior temporal neurons are selective for disparity-defined three-dimensional shapes. Proc Natl Acad Sci USA. 1999;96:8217–8222. doi: 10.1073/pnas.96.14.8217. [DOI] [PMC free article] [PubMed] [Google Scholar]
- Julesz B. Cyclopean perception and neurophysiology. Invest Ophthalmol. 1972;11:540–548. [PubMed] [Google Scholar]
- Kastner S, Ungerleider LG. Mechanisms of visual attention in the human cortex. Annu Rev Neurosci. 2000;23:315–341. doi: 10.1146/annurev.neuro.23.1.315. [DOI] [PubMed] [Google Scholar]
- Kastner S, Pinsk MA, De Weerd P, Desimone R, Ungerleider LG. Increased activity in human visual cortex during directed attention in the absence of visual stimulation. Neuron. 1999;22:751–761. doi: 10.1016/s0896-6273(00)80734-5. [DOI] [PubMed] [Google Scholar]
- Knierim JJ, van Essen DC. Neuronal responses to static texture patterns in area V1 of the alert macaque monkey. J Neurophysiol. 1992;67:961–980. doi: 10.1152/jn.1992.67.4.961. [DOI] [PubMed] [Google Scholar]
- Kobatake E, Tanaka K. Neuronal selectivities to complex object features in the ventral visual pathway of the macaque cerebral cortex. J Neurophysiol. 1994;71:856–867. doi: 10.1152/jn.1994.71.3.856. [DOI] [PubMed] [Google Scholar]
- Koida K, Komatsu H. Effects of task demands on the responses of color-selective neurons in the inferior temporal cortex. Nat Neurosci. 2007;10:108–116. doi: 10.1038/nn1823. [DOI] [PubMed] [Google Scholar]
- Kotake Y, Morimoto H, Okazaki Y, Fujita I, Tamura H. Organization of color-selective neurons in macaque visual area V4. J Neurophysiol. 2009;102:15–27. doi: 10.1152/jn.90624.2008. [DOI] [PubMed] [Google Scholar]
- Krauskopf J. Effect of retinal image stabilization on the appearance of heterochromatic targets. J Opt Soc Am. 1963;53:741–744. doi: 10.1364/josa.53.000741. [DOI] [PubMed] [Google Scholar]
- Kumano H, Tanabe S, Fujita I. Spatial frequency integration for binocular correspondence in macaque area V4. J Neurophysiol. 2008;99:402–408. doi: 10.1152/jn.00096.2007. [DOI] [PubMed] [Google Scholar]
- Kustov AA, Robinson DL. Shared neural control of attentional shifts and eye movements. Nature. 1996;384:74–77. doi: 10.1038/384074a0. [DOI] [PubMed] [Google Scholar]
- Kusunoki M, Moutoussis K, Zeki S. Effect of background colors on the tuning of color-selective cells in monkey area V4. J Neurophysiol. 2006;95:3047–3059. doi: 10.1152/jn.00597.2005. [DOI] [PubMed] [Google Scholar]
- Lamme VA. The neurophysiology of figure-ground segregation in primary visual cortex. J Neurosci. 1995;15:1605–1615. doi: 10.1523/JNEUROSCI.15-02-01605.1995. [DOI] [PMC free article] [PubMed] [Google Scholar]
- Lee AB, Mumford D, Huang J. Occlusion models for natural images: A statistical study of a scale-invariant dead leaves model. Int J Comput Vis. 2001;41:35–59. [Google Scholar]
- Lennie P, Krauskopf J, Sclar G. Chromatic mechanisms in striate cortex of macaque. J Neurosci. 1990;10:649–669. doi: 10.1523/JNEUROSCI.10-02-00649.1990. [DOI] [PMC free article] [PubMed] [Google Scholar]
- Levitt JB, Kiper DC, Movshon JA. Receptive fields and functional architecture of macaque V2. J Neurophysiol. 1994;71:2517–2542. doi: 10.1152/jn.1994.71.6.2517. [DOI] [PubMed] [Google Scholar]
- Li W, Piëch V, Gilbert CD. Contour saliency in primary visual cortex. Neuron. 2006;50:951–962. doi: 10.1016/j.neuron.2006.04.035. [DOI] [PubMed] [Google Scholar]
- Livingstone MS, Hubel DH. Anatomy and physiology of a color system in the primate visual cortex. J Neurosci. 1984;4:309–356. doi: 10.1523/JNEUROSCI.04-01-00309.1984. [DOI] [PMC free article] [PubMed] [Google Scholar]
- Livingstone M, Hubel D. Segregation of form, color, movement, and depth: anatomy, physiology, and perception. Science. 1988;240:740–749. doi: 10.1126/science.3283936. [DOI] [PubMed] [Google Scholar]
- Logothetis NK, Wandell BA. Interpreting the BOLD signal. Annu Rev Physiol. 2004;66:735–769. doi: 10.1146/annurev.physiol.66.082602.092845. [DOI] [PubMed] [Google Scholar]
- Logothetis NK, Pauls J, Augath M, Trinath T, Oeltermann A. Neurophysiological investigation of the basis of the fMRI signal. Nature. 2001;412:150–157. doi: 10.1038/35084005. [DOI] [PubMed] [Google Scholar]
- Lu HD, Chen GC, Tanigawa H, Roe AW. A motion direction map in macaque V2. Neuron. 2010;68:1002–1013. doi: 10.1016/j.neuron.2010.11.020. [DOI] [PMC free article] [PubMed] [Google Scholar]
- Luck SJ, Chelazzi L, Hillyard SA, Desimone R. Neural mechanisms of spatial selective attention in areas V1, V2, and V4 of macaque visual cortex. J Neurophysiol. 1997;77:24–42. doi: 10.1152/jn.1997.77.1.24. [DOI] [PubMed] [Google Scholar]
- MacEvoy SP, Paradiso MA. Lightness constancy in primary visual cortex. Proc Natl Acad Sci USA. 2001;98:8827–8831. doi: 10.1073/pnas.161280398. [DOI] [PMC free article] [PubMed] [Google Scholar]
- Marcar VL, Raiguel SE, Xiao D, Orban GA. Processing of kinetically defined boundaries in areas V1 and V2 of the macaque monkey. J Neurophysiol. 2000;84:2786–2798. doi: 10.1152/jn.2000.84.6.2786. [DOI] [PubMed] [Google Scholar]
- Maunsell JH, Treue S. Feature-based attention in visual cortex. Trends Neurosci. 2006;29:317–322. doi: 10.1016/j.tins.2006.04.001. [DOI] [PubMed] [Google Scholar]
- McAdams CJ, Maunsell JH. Attention to both space and feature modulates neuronal responses in macaque area V4. J Neurophysiol. 2000;83:1751–1755. doi: 10.1152/jn.2000.83.3.1751. [DOI] [PubMed] [Google Scholar]
- Merigan WH. Basic visual capacities and shape discrimination after lesions of extrastriate area V4 in macaques. Vis Neurosci. 1996;13:51–60. doi: 10.1017/s0952523800007124. [DOI] [PubMed] [Google Scholar]
- Merigan WH. Cortical area V4 is critical for certain texture discriminations, but this effect is not dependent on attention. Vis Neurosci. 2000;17:949–958. doi: 10.1017/s095252380017614x. [DOI] [PubMed] [Google Scholar]
- Merigan WH, Pham HA. V4 lesions in macaques affect both single-and multiple-viewpoint shape discriminations. Vis Neurosci. 1998;15:359–367. doi: 10.1017/s0952523898152112. [DOI] [PubMed] [Google Scholar]
- Merigan W, Freeman A, Meyers SP. Parallel processing streams in human visual cortex. Neuroreport. 1997;8:3985–3991. doi: 10.1097/00001756-199712220-00027. [DOI] [PubMed] [Google Scholar]
- Mirabella G, Bertini G, Samengo I, Kilavik BE, Frilli D, Della Libera C, Chelazzi L. Neurons in area V4 of the macaque translate attended visual features into behaviorally relevant categories. Neuron. 2007;54:303–318. doi: 10.1016/j.neuron.2007.04.007. [DOI] [PubMed] [Google Scholar]
- Mitchell JF, Stoner GR, Fallah M, Reynolds JH. Attentional selection of superimposed surfaces cannot be explained by modulation of the gain of color channels. Vision Res. 2003;43:1323–1328. doi: 10.1016/s0042-6989(03)00123-8. [DOI] [PubMed] [Google Scholar]
- Mitchell JF, Sundberg KA, Reynolds JH. Differential attention-dependent response modulation across cell classes in macaque visual area V4. Neuron. 2007;55:131–141. doi: 10.1016/j.neuron.2007.06.018. [DOI] [PubMed] [Google Scholar]
- Mitchell JF, Sundberg KA, Reynolds JH. Spatial attention decorrelates intrinsic activity fluctuations in macaque area V4. Neuron. 2009;63:879–888. doi: 10.1016/j.neuron.2009.09.013. [DOI] [PMC free article] [PubMed] [Google Scholar]
- Moore T, Armstrong KM. Selective gating of visual signals by microstimulation of frontal cortex. Nature. 2003;421:370–373. doi: 10.1038/nature01341. [DOI] [PubMed] [Google Scholar]
- Moore T, Fallah M. Control of eye movements and spatial attention. Proc Natl Acad Sci USA. 2001;98:1273–1276. doi: 10.1073/pnas.021549498. [DOI] [PMC free article] [PubMed] [Google Scholar]
- Moore T, Fallah M. Microstimulation of the frontal eye field and its effects on covert spatial attention. J Neurophysiol. 2004;91:152–162. doi: 10.1152/jn.00741.2002. [DOI] [PubMed] [Google Scholar]
- Moore T, Armstrong KM, Fallah M. Visuomotor origins of covert spatial attention. Neuron. 2003;40:671–683. doi: 10.1016/s0896-6273(03)00716-5. [DOI] [PubMed] [Google Scholar]
- Moran J, Desimone R. Selective attention gates visual processing in the extrastriate cortex. Science. 1985;229:782–784. doi: 10.1126/science.4023713. [DOI] [PubMed] [Google Scholar]
- Motter BC. Neural correlates of attentive selection for color or luminance in extrastriate area V4. J Neurosci. 1994;14:2178–2189. doi: 10.1523/JNEUROSCI.14-04-02178.1994. [DOI] [PMC free article] [PubMed] [Google Scholar]
- Mountcastle VB, Motter BC, Steinmetz MA, Sestokas AK. Common and differential effects of attentive fixation on the excitability of parietal and prestriate (V4) cortical visual neurons in the macaque monkey. J Neurosci. 1987;7:2239–2255. doi: 10.1523/JNEUROSCI.07-07-02239.1987. [DOI] [PMC free article] [PubMed] [Google Scholar]
- Moutoussis K, Zeki S. Responses of spectrally selective cells in macaque area V2 to wavelengths and colors. J Neurophysiol. 2002;87:2104–2112. doi: 10.1152/jn.00248.2001. [DOI] [PubMed] [Google Scholar]
- Mullen KT, Dumoulin SO, McMahon KL, de Zubicaray GI, Hess RF. Selectivity of human retinotopic visual cortex to S-cone-opponent, L/M-cone-opponent and achromatic stimulation. Eur J Neurosci. 2007;25:491–502. doi: 10.1111/j.1460-9568.2007.05302.x. [DOI] [PubMed] [Google Scholar]
- Murphey DK, Yoshor D, Beauchamp MS. Perception matches selectivity in the human anterior color center. Curr Biol. 2008;18:216–220. doi: 10.1016/j.cub.2008.01.013. [DOI] [PubMed] [Google Scholar]
- Mysore SG, Vogels R, Raiguel SE, Orban GA. Processing of kinetic boundaries in macaque V4. J Neurophysiol. 2006;95:1864–1880. doi: 10.1152/jn.00627.2005. [DOI] [PubMed] [Google Scholar]
- Mysore SG, Vogels R, Raiguel SE, Orban GA. Shape selectivity for camouflage-breaking dynamic stimuli in dorsal V4 neurons. Cereb Cortex. 2008;18:1429–1443. doi: 10.1093/cercor/bhm176. [DOI] [PubMed] [Google Scholar]
- Nakamura H, Gattass R, Desimone R, Ungerleider LG. The modular organization of projections from areas V1 and V2 to areas V4 and TEO in macaques. J Neurosci. 1993;13:3681–3691. doi: 10.1523/JNEUROSCI.13-09-03681.1993. [DOI] [PMC free article] [PubMed] [Google Scholar]
- Nascimento-Silva S, Gattass R, Fiorani M, Jr, Sousa APB. Three streams of visual information processing in V2 of Cebus monkey. J Comp Neurol. 2003;466:104–118. doi: 10.1002/cne.10878. [DOI] [PubMed] [Google Scholar]
- Naselaris T, Prenger RJ, Kay KN, Oliver M, Gallant JL. Bayesian reconstruction of natural images from human brain activity. Neuron. 2009;63:902–915. doi: 10.1016/j.neuron.2009.09.006. [DOI] [PMC free article] [PubMed] [Google Scholar]
- Nassi JJ, Callaway EM. Specialized circuits from primary visual cortex to V2 and area MT. Neuron. 2007;55:799–808. doi: 10.1016/j.neuron.2007.07.037. [DOI] [PMC free article] [PubMed] [Google Scholar]
- Neri P, Bridge H, Heeger DJ. Stereoscopic processing of absolute and relative disparity in human visual cortex. J Neurophysiol. 2004;92:1880–1891. doi: 10.1152/jn.01042.2003. [DOI] [PubMed] [Google Scholar]
- Niessing J, Ebisch B, Schmidt KE, Niessing M, Singer W, Galuske RA. Hemodynamic signals correlate tightly with synchronized gamma oscillations. Science. 2005;309:948–951. doi: 10.1126/science.1110948. [DOI] [PubMed] [Google Scholar]
- Nobre AC, Gitelman DR, Dias EC, Mesulam MM. Covert visual spatial orienting and saccades: overlapping neural systems. Neuroimage. 2000;11:210–216. doi: 10.1006/nimg.2000.0539. [DOI] [PubMed] [Google Scholar]
- Nobre AC, Rao A, Chelazzi L. Selective attention to specific features within objects: behavioral and electrophysiological evidence. J Cogn Neurosci. 2006;18:539–561. doi: 10.1162/jocn.2006.18.4.539. [DOI] [PubMed] [Google Scholar]
- Ohzawa I, DeAngelis GC, Freeman RD. Stereoscopic depth discrimination in the visual cortex: neurons ideally suited as disparity detectors. Science. 1990;249:1037–1041. doi: 10.1126/science.2396096. [DOI] [PubMed] [Google Scholar]
- Orban GA, Kennedy H, Bullier J. Velocity sensitivity and direction selectivity of neurons in areas V1 and V2 of the monkey: influence of eccentricity. J Neurophysiol. 1986;56:462–480. doi: 10.1152/jn.1986.56.2.462. [DOI] [PubMed] [Google Scholar]
- Parker AJ. Binocular depth perception and the cerebral cortex. Nat Rev Neurosci. 2007;8:379–391. doi: 10.1038/nrn2131. [DOI] [PubMed] [Google Scholar]
- Parkes LM, Marsman JB, Oxley DC, Goulermas JY, Wuerger SM. Multivoxel fMRI analysis of color tuning in human primary visual cortex. J Vis. 2009;9:1, 1–13. doi: 10.1167/9.1.1. [DOI] [PubMed] [Google Scholar]
- Pasupathy A, Connor CE. Responses to contour features in macaque area V4. J Neurophysiol. 1999;82:2490–2502. doi: 10.1152/jn.1999.82.5.2490. [DOI] [PubMed] [Google Scholar]
- Pasupathy A, Connor CE. Shape representation in area V4: position-specific tuning for boundary conformation. J Neurophysiol. 2001;86:2505–2519. doi: 10.1152/jn.2001.86.5.2505. [DOI] [PubMed] [Google Scholar]
- Pasupathy A, Connor CE. Population coding of shape in area V4. Nat Neurosci. 2002;5:1332–1338. doi: 10.1038/nn972. [DOI] [PubMed] [Google Scholar]
- Peterhans E, von der Heydt R. Mechanisms of contour perception in monkey visual cortex. II Contours bridging gaps. J Neurosci. 1989;9:1749–1763. doi: 10.1523/JNEUROSCI.09-05-01749.1989. [DOI] [PMC free article] [PubMed] [Google Scholar]
- Peterhans E, von der Heydt R. Functional organization of area V2 in the alert macaque. Eur J Neurosci. 1993;5:509–524. doi: 10.1111/j.1460-9568.1993.tb00517.x. [DOI] [PubMed] [Google Scholar]
- Pinna B, Brelstaff G, Spillmann L. Surface color from boundaries: a new ‘watercolor’ illusion. Vision Res. 2001;41:2669–2676. doi: 10.1016/s0042-6989(01)00105-5. [DOI] [PubMed] [Google Scholar]
- Poggio GF, Fischer B. Binocular interaction and depth sensitivity in striate and prestriate cortex of behaving rhesus monkey. J Neurophysiol. 1977;40:1392–1405. doi: 10.1152/jn.1977.40.6.1392. [DOI] [PubMed] [Google Scholar]
- Posner MI. Orienting of attention. Q J Exp Psychol. 1980;32:3–25. doi: 10.1080/00335558008248231. [DOI] [PubMed] [Google Scholar]
- Pouget P, Stepniewska I, Crowder EA, Leslie MW, Emeric EE, Nelson MJ, Schall JD. Visual and motor connectivity and the distribution of calcium-binding proteins in macaque frontal eye field: implications for saccade target selection. Frontiers Neuroanat. 2009;3:1–14. doi: 10.3389/neuro.05.002.2009. [DOI] [PMC free article] [PubMed] [Google Scholar]
- Preston TJ, Li S, Kourtzi Z, Welchman AE. Multivoxel pattern selectivity for perceptually relevant binocular disparities in the human brain. J Neurosci. 2008;28:11315–11327. doi: 10.1523/JNEUROSCI.2728-08.2008. [DOI] [PMC free article] [PubMed] [Google Scholar]
- Qian N, Zhu Y. Physiological computation of binocular disparity. Vision Res. 1997;37:1811–1827. doi: 10.1016/s0042-6989(96)00331-8. [DOI] [PubMed] [Google Scholar]
- Qiu FT, von der Heydt R. Figure and ground in the visual cortex: v2 combines stereoscopic cues with gestalt rules. Neuron. 2005;47:155–166. doi: 10.1016/j.neuron.2005.05.028. [DOI] [PMC free article] [PubMed] [Google Scholar]
- Qiu FT, Sugihara T, von der Heydt R. Figure-ground mechanisms provide structure for selective attention. Nat Neurosci. 2007;10:1492–1499. doi: 10.1038/nn1989. [DOI] [PMC free article] [PubMed] [Google Scholar]
- Regan D, Erkelens CJ, Collewijn H. Necessary conditions for the perception of motion in depth. Invest Ophthalmol Vis Sci. 1986;27:584–597. [PubMed] [Google Scholar]
- Reynolds JH, Chelazzi L. Attentional modulation of visual processing. Annu Rev Neurosci. 2004;27:611–647. doi: 10.1146/annurev.neuro.26.041002.131039. [DOI] [PubMed] [Google Scholar]
- Reynolds JH, Desimone R. Interacting roles of attention and visual salience in V4. Neuron. 2003;37:853–863. doi: 10.1016/s0896-6273(03)00097-7. [DOI] [PubMed] [Google Scholar]
- Reynolds JH, Chelazzi L, Desimone R. Competitive mechanisms subserve attention in macaque areas V2 and V4. J Neurosci. 1999;19:1736–1753. doi: 10.1523/JNEUROSCI.19-05-01736.1999. [DOI] [PMC free article] [PubMed] [Google Scholar]
- Reynolds JH, Pasternak T, Desimone R. Attention increases sensitivity of V4 neurons. Neuron. 2000;26:703–714. doi: 10.1016/s0896-6273(00)81206-4. [DOI] [PubMed] [Google Scholar]
- Rizzo M, Nawrot M, Blake R, Damasio A. A human visual disorder resembling area V4 dysfunction in the monkey. Neurology. 1992;42:1175–1180. doi: 10.1212/wnl.42.6.1175. [DOI] [PubMed] [Google Scholar]
- Rizzolatti G, Riggio L, Dascola I, Umiltá C. Reorienting attention across the horizontal and vertical meridians: evidence in favor of a premotor theory of attention. Neuropsychologia. 1987;25(1A):31–40. doi: 10.1016/0028-3932(87)90041-8. [DOI] [PubMed] [Google Scholar]
- Rockland KS, Drash GW. Collateralized divergent feedback connections that target multiple cortical areas. J Comp Neurol. 1996;373:529–548. doi: 10.1002/(SICI)1096-9861(19960930)373:4<529::AID-CNE5>3.0.CO;2-3. [DOI] [PubMed] [Google Scholar]
- Roe AW. Modular complexity of Area V2 in the Macaque monkey. In: Collins C, Kaas J, editors. The Primate Visual System. New York, NY: CRC Press; 2003. pp. 109–138. [Google Scholar]
- Roe AW, Ts’o DY. Visual topography in primate V2: multiple representation across functional stripes. J Neurosci. 1995;15:3689–3715. doi: 10.1523/JNEUROSCI.15-05-03689.1995. [DOI] [PMC free article] [PubMed] [Google Scholar]
- Roe AW, Lu HD, Hung CP. Cortical processing of a brightness illusion. Proc Natl Acad Sci USA. 2005;102:3869–3874. doi: 10.1073/pnas.0500097102. [DOI] [PMC free article] [PubMed] [Google Scholar]
- Roe AW, Lu HD, Chen G. Visual System: Functional architecture of Area V2. In: Squire L, editor. The Encyclopedia of Neuroscience. Vol. 10. Oxford, UK: Elsevier; 2009. pp. 331–349. [Google Scholar]
- Sàenz M, Buraĉas GT, Boynton GM. Global feature-based attention for motion and color. Vision Res. 2003;43:629–637. doi: 10.1016/s0042-6989(02)00595-3. [DOI] [PubMed] [Google Scholar]
- Sakata H, Taira M, Kusunoki M, Murata A, Tanaka Y. The TINS Lecture. The parietal association cortex in depth perception and visual control of hand action. Trends Neurosci. 1997;20:350–357. doi: 10.1016/s0166-2236(97)01067-9. [DOI] [PubMed] [Google Scholar]
- Sasaki Y, Hadjikhani N, Fischl B, Liu AK, Marrett S, Dale AM, Tootell RB. Local and global attention are mapped retinotopically in human occipital cortex. Proc Natl Acad Sci USA. 2001;98:2077–2082. doi: 10.1073/pnas.98.4.2077. [DOI] [PMC free article] [PubMed] [Google Scholar]
- Schein SJ, Desimone R. Spectral properties of V4 neurons in the macaque. J Neurosci. 1990;10:3369–3389. doi: 10.1523/JNEUROSCI.10-10-03369.1990. [DOI] [PMC free article] [PubMed] [Google Scholar]
- Schein SJ, Marrocco RT, de Monasterio FM. Is there a high concentration of color-selective cells in area V4 of monkey visual cortex? J Neurophysiol. 1982;47:193–213. doi: 10.1152/jn.1982.47.2.193. [DOI] [PubMed] [Google Scholar]
- Schiller PH. The effects of V4 and middle temporal (MT) area lesions on visual performance in the rhesus monkey. Vis Neurosci. 1993;10:717–746. doi: 10.1017/s0952523800005423. [DOI] [PubMed] [Google Scholar]
- Schiller PH. Effect of lesions in visual cortical area V4 on the recognition of transformed objects. Nature. 1995;376:342–344. doi: 10.1038/376342a0. [DOI] [PubMed] [Google Scholar]
- Sereno MI, Dale AM, Reppas JB, Kwong KK, Belliveau JW, Brady TJ, Rosen BR, Tootell RBH. Borders of multiple visual areas in humans revealed by functional magnetic resonance imaging. Science. 1995;268:889–893. doi: 10.1126/science.7754376. [DOI] [PubMed] [Google Scholar]
- Shapley R, Hawken M. Neural mechanisms for color perception in the primary visual cortex. Curr Opin Neurobiol. 2002;12:426–432. doi: 10.1016/s0959-4388(02)00349-5. [DOI] [PubMed] [Google Scholar]
- Shiozaki HM, Tanabe S, Doi T, Fujita I. Neural activity in cortical area V4 underlies fine disparity discrimination. J Neurosci. 2012;32:3830–3841. doi: 10.1523/JNEUROSCI.5083-11.2012. [DOI] [PMC free article] [PubMed] [Google Scholar]
- Shipp S, Zeki S. Segregation of pathways leading from area V2 to areas V4 and V5 of macaque monkey visual cortex. Nature. 1985;315:322–325. doi: 10.1038/315322a0. [DOI] [PubMed] [Google Scholar]
- Shipp S, Zeki S. The organization of connections between areas V5 and V2 in macaque monkey visual cortex. Eur J Neurosci. 1989;1:333–354. doi: 10.1111/j.1460-9568.1989.tb00799.x. [DOI] [PubMed] [Google Scholar]
- Shipp S, Zeki S. The functional organization of area V2, I: specialization across stripes and layers. Vis Neurosci. 2002a;19:187–210. doi: 10.1017/s0952523802191164. [DOI] [PubMed] [Google Scholar]
- Shipp S, Zeki S. The functional organization of area V2, II: the impact of stripes on visual topography. Vis Neurosci. 2002b;19:211–231. doi: 10.1017/s0952523802191176. [DOI] [PubMed] [Google Scholar]
- Singer W. Neuronal synchrony: a versatile code for the definition of relations? Neuron. 1999;24:49–65. 111–125. doi: 10.1016/s0896-6273(00)80821-1. [DOI] [PubMed] [Google Scholar]
- Singer W, Gray CM. Visual feature integration and the temporal correlation hypothesis. Annu Rev Neurosci. 1995;18:555–586. doi: 10.1146/annurev.ne.18.030195.003011. [DOI] [PubMed] [Google Scholar]
- Sohn W, Papathomas TV, Blaser E, Vidnyánszky Z. Object-based cross-feature attentional modulation from color to motion. Vision Res. 2004;44:1437–1443. doi: 10.1016/j.visres.2003.12.010. [DOI] [PubMed] [Google Scholar]
- Solomon SG, Lennie P. The machinery of colour vision. Nat Rev Neurosci. 2007;8:276–286. doi: 10.1038/nrn2094. [DOI] [PubMed] [Google Scholar]
- Solomon SG, Peirce JW, Lennie P. The impact of suppressive surrounds on chromatic properties of cortical neurons. J Neurosci. 2004;24:148–160. doi: 10.1523/JNEUROSCI.3036-03.2004. [DOI] [PMC free article] [PubMed] [Google Scholar]
- Stepniewska I, Collins CE, Kaas JH. Reappraisal of DL/V4 boundaries based on connectivity patterns of dorsolateral visual cortex in macaques. Cereb Cortex. 2005;15:809–822. doi: 10.1093/cercor/bhh182. [DOI] [PubMed] [Google Scholar]
- Sugita Y. Grouping of image fragments in primary visual cortex. Nature. 1999;401:269–272. doi: 10.1038/45785. [DOI] [PubMed] [Google Scholar]
- Tanabe S, Umeda K, Fujita I. Rejection of false matches for binocular correspondence in macaque visual cortical area V4. J Neurosci. 2004;24:8170–8180. doi: 10.1523/JNEUROSCI.5292-03.2004. [DOI] [PMC free article] [PubMed] [Google Scholar]
- Tanabe S, Doi T, Umeda K, Fujita I. Disparity-tuning characteristics of neuronal responses to dynamic random-dot stereograms in macaque visual area V4. J Neurophysiol. 2005;94:2683–2699. doi: 10.1152/jn.00319.2005. [DOI] [PubMed] [Google Scholar]
- Tanabe S, Yasuoka S, Fujita I. Disparity-energy signals in perceived stereoscopic depth. J Vis. 2008;8:22, 1–10. doi: 10.1167/8.3.22. [DOI] [PubMed] [Google Scholar]
- Tanaka M, Weber H, Creutzfeldt OD. Visual properties and spatial distribution of neurones in the visual association area on the prelunate gyrus of the awake monkey. Exp Brain Res. 1986;65:11–37. doi: 10.1007/BF00243827. [DOI] [PubMed] [Google Scholar]
- Tanigawa H, Lu HD, Roe AW. Functional organization for color and orientation in macaque V4. Nat Neurosci. 2010;13:1542–1548. doi: 10.1038/nn.2676. [DOI] [PMC free article] [PubMed] [Google Scholar]
- Taylor K, Mandon S, Freiwald WA, Kreiter AK. Coherent oscillatory activity in monkey area v4 predicts successful allocation of attention. Cereb Cortex. 2005;15:1424–1437. doi: 10.1093/cercor/bhi023. [DOI] [PubMed] [Google Scholar]
- Thomas OM, Cumming BG, Parker AJ. A specialization for relative disparity in V2. Nat Neurosci. 2002;5:472–478. doi: 10.1038/nn837. [DOI] [PubMed] [Google Scholar]
- Tiesinga PH, Fellous JM, Salinas E, José JV, Sejnowski TJ. Inhibitory synchrony as a mechanism for attentional gain modulation. J Physiol Paris. 2004;98:296–314. doi: 10.1016/j.jphysparis.2005.09.002. [DOI] [PMC free article] [PubMed] [Google Scholar]
- Tolias AS, Keliris GA, Smirnakis SM, Logothetis NK. Neurons in macaque area V4 acquire directional tuning after adaptation to motion stimuli. Nat Neurosci. 2005;8:591–593. doi: 10.1038/nn1446. [DOI] [PubMed] [Google Scholar]
- Tootell RB, Hadjikhani N, Hall EK, Marrett S, Vanduffel W, Vaughan JT, Dale AM. The retinotopy of visual spatial attention. Neuron. 1998;21:1409–1422. doi: 10.1016/s0896-6273(00)80659-5. [DOI] [PubMed] [Google Scholar]
- Treue S, Maunsell JH. Attentional modulation of visual motion processing in cortical areas MT and MST. Nature. 1996;382:539–541. doi: 10.1038/382539a0. [DOI] [PubMed] [Google Scholar]
- Ts’o DY, Gilbert CD. The organization of chromatic and spatial interactions in the primate striate cortex. J Neurosci. 1988;8:1712–1727. doi: 10.1523/JNEUROSCI.08-05-01712.1988. [DOI] [PMC free article] [PubMed] [Google Scholar]
- Ts’o DY, Roe AW, Gilbert CD. A hierarchy of the functional organization for color, form and disparity in primate visual area V2. Vision Res. 2001;41:1333–1349. doi: 10.1016/s0042-6989(01)00076-1. [DOI] [PubMed] [Google Scholar]
- Uka T, DeAngelis GC. Contribution of area MT to stereoscopic depth perception: choice-related response modulations reflect task strategy. Neuron. 2004;42:297–310. doi: 10.1016/s0896-6273(04)00186-2. [DOI] [PubMed] [Google Scholar]
- Uka T, DeAngelis GC. Linking neural representation to function in stereoscopic depth perception: roles of the middle temporal area in coarse versus fine disparity discrimination. J Neurosci. 2006;26:6791–6802. doi: 10.1523/JNEUROSCI.5435-05.2006. [DOI] [PMC free article] [PubMed] [Google Scholar]
- Uka T, Tanabe S, Watanabe M, Fujita I. Neural correlates of fine depth discrimination in monkey inferior temporal cortex. J Neurosci. 2005;25:10796–10802. doi: 10.1523/JNEUROSCI.1637-05.2005. [DOI] [PMC free article] [PubMed] [Google Scholar]
- Umeda K, Tanabe S, Fujita I. Representation of stereoscopic depth based on relative disparity in macaque area V4. J Neurophysiol. 2007;98:241–252. doi: 10.1152/jn.01336.2006. [DOI] [PubMed] [Google Scholar]
- Ungerleider L, Ganz L, Pribram KH. Size constancy in rhesus monkeys: effects of pulvinar, prestriate, and inferotemporal lesions. Exp Brain Res. 1977;27:251–269. doi: 10.1007/BF00235502. [DOI] [PubMed] [Google Scholar]
- Ungerleider LG, Galkin TW, Desimone R, Gattass R. Cortical connections of area V4 in the macaque. Cereb Cortex. 2008;18:477–499. doi: 10.1093/cercor/bhm061. [DOI] [PubMed] [Google Scholar]
- Vaina LM. Functional segregation of color and motion processing in the human visual cortex: clinical evidence. Cereb Cortex. 1994;4:555–572. doi: 10.1093/cercor/4.5.555. [DOI] [PubMed] [Google Scholar]
- Vinberg J, Grill-Spector K. Representation of shapes, edges, and surfaces across multiple cues in the human visual cortex. J Neurophysiol. 2008;99:1380–1393. doi: 10.1152/jn.01223.2007. [DOI] [PubMed] [Google Scholar]
- Wade AR, Brewer AA, Rieger JW, Wandell BA. Functional measurements of human ventral occipital cortex: retinotopy and colour. Philos Trans R Soc Lond B Biol Sci. 2002;357:963–973. doi: 10.1098/rstb.2002.1108. [DOI] [PMC free article] [PubMed] [Google Scholar]
- Wade A, Augath M, Logothetis N, Wandell B. fMRI measurements of color in macaque and human. J Vis. 2008;8:6, 1–19. doi: 10.1167/8.10.6. [DOI] [PMC free article] [PubMed] [Google Scholar]
- Walsh V, Butler SR, Carden D, Kulikowski JJ. The effects of V4 lesions on the visual abilities of macaques: shape discrimination. Behav Brain Res. 1992;50:115–126. doi: 10.1016/s0166-4328(05)80293-1. [DOI] [PubMed] [Google Scholar]
- Walsh V, Carden D, Butler SR, Kulikowski JJ. The effects of V4 lesions on the visual abilities of macaques: hue discrimination and colour constancy. Behav Brain Res. 1993;53:51–62. doi: 10.1016/s0166-4328(05)80265-7. [DOI] [PubMed] [Google Scholar]
- Walsh V, Le Mare C, Blaimire A, Cowey A. Normal discrimination performance accompanied by priming deficits in monkeys with V4 or TEO lesions. Neuroreport. 2000;11:1459–1462. [PubMed] [Google Scholar]
- Watanabe M, Tanaka H, Uka T, Fujita I. Disparity-selective neurons in area V4 of macaque monkeys. J Neurophysiol. 2002;87:1960–1973. doi: 10.1152/jn.00780.2000. [DOI] [PubMed] [Google Scholar]
- Wegener D, Ehn F, Aurich MK, Galashan FO, Kreiter AK. Feature-based attention and the suppression of non-relevant object features. Vision Res. 2008;48:2696–2707. doi: 10.1016/j.visres.2008.08.021. [DOI] [PubMed] [Google Scholar]
- Werner A. The influence of depth segmentation on colour constancy. Perception. 2006;35:1171–1184. doi: 10.1068/p5476. [DOI] [PubMed] [Google Scholar]
- Westheimer G. Cooperative neural processes involved in stereoscopic acuity. Exp Brain Res. 1979;36:585–597. doi: 10.1007/BF00238525. [DOI] [PubMed] [Google Scholar]
- Wilkinson F, James TW, Wilson HR, Gati JS, Menon RS, Goodale MA. An fMRI study of the selective activation of human extrastriate form vision areas by radial and concentric gratings. Curr Biol. 2000;10:1455–1458. doi: 10.1016/s0960-9822(00)00800-9. [DOI] [PubMed] [Google Scholar]
- Winawer J, Horiguchi H, Sayres RA, Amano K, Wandell BA. Mapping hV4 and ventral occipital cortex: the venous eclipse. J Vis. 2010;10:1. doi: 10.1167/10.5.1. [DOI] [PMC free article] [PubMed] [Google Scholar]
- Womelsdorf T, Fries P. The role of neuronal synchronization in selective attention. Curr Opin Neurobiol. 2007;17:154–160. doi: 10.1016/j.conb.2007.02.002. [DOI] [PubMed] [Google Scholar]
- Xiao Y, Wang Y, Felleman DJ. A spatially organized representation of colour in macaque cortical area V2. Nature. 2003;421:535–539. doi: 10.1038/nature01372. [DOI] [PubMed] [Google Scholar]
- Xiao Y, Casti A, Xiao J, Kaplan E. Hue maps in primate striate cortex. Neuroimage. 2007;35:771–786. doi: 10.1016/j.neuroimage.2006.11.059. [DOI] [PMC free article] [PubMed] [Google Scholar]
- Yamane Y, Carlson ET, Bowman KC, Wang Z, Connor CE. A neural code for three-dimensional object shape in macaque inferotemporal cortex. Nat Neurosci. 2008;11:1352–1360. doi: 10.1038/nn.2202. [DOI] [PMC free article] [PubMed] [Google Scholar]
- Yau JM, Pasupathy A, Fitzgerald PJ, Hsiao SS, Connor CE. Analogous intermediate shape coding in vision and touch. Proc Natl Acad Sci USA. 2009;106:16457–16462. doi: 10.1073/pnas.0904186106. [DOI] [PMC free article] [PubMed] [Google Scholar]
- Yoshioka T, Levitt JB, Lund JS. Intrinsic lattice connections of macaque monkey visual cortical area V4. J Neurosci. 1992;12:2785–2802. doi: 10.1523/JNEUROSCI.12-07-02785.1992. [DOI] [PMC free article] [PubMed] [Google Scholar]
- Youakim M, Bender DB, Baizer JS. Vertical meridian representation on the prelunate gyrus in area V4 of macaque. Brain Res Bull. 2001;56:93–100. doi: 10.1016/s0361-9230(01)00608-6. [DOI] [PubMed] [Google Scholar]
- Yukie M, Iwai E. Laminar origin of direct projection from cortex area V1 to V4 in the rhesus monkey. Brain Res. 1985;346:383–386. doi: 10.1016/0006-8993(85)90875-3. [DOI] [PubMed] [Google Scholar]
- Zeki SM. Representation of central visual fields in prestriate cortex of monkey. Brain Res. 1969;14:271–291. doi: 10.1016/0006-8993(69)90110-3. [DOI] [PubMed] [Google Scholar]
- Zeki SM. Colour coding in rhesus monkey prestriate cortex. Brain Res. 1973;53:422–427. doi: 10.1016/0006-8993(73)90227-8. [DOI] [PubMed] [Google Scholar]
- Zeki SM. The distribution of wavelength and orientation selective cells in different areas of monkey visual cortex. Proc R Soc Lond B Biol Sci. 1983;217:449–470. doi: 10.1098/rspb.1983.0020. [DOI] [PubMed] [Google Scholar]
- Zhou H, Friedman HS, von der Heydt R. Coding of border ownership in monkey visual cortex. J Neurosci. 2000;20:6594–6611. doi: 10.1523/JNEUROSCI.20-17-06594.2000. [DOI] [PMC free article] [PubMed] [Google Scholar]