Abstract
Microfluidic stickers are used as a sample environment to measure the microrheology of monoclonal antibody (mAb) protein solutions. A Peltier-based microscope stage is implemented and validated, and is capable of controlling the sample temperature over the range 0.9–40 °C. The design accounts for heat transfer to and from the objective, controls the sample environment humidity to mitigate condensation, and provides adequate damping to reduce vibration from the cooling system. A concentrated sucrose solution is used as a standard sample to provide an in situ temperature measurement by the Stokes-Einstein-Sutherland relation. By combining microfluidic stickers and microrheology, 72 temperature-concentration viscosity measurements of mAb solutions can be made in 1 day, a significant increase in throughput over conventional rheometry.
I. INTRODUCTION
The production and use of high concentration monoclonal antibody (mAb) therapeutics have grown rapidly in the pharmaceutical industry over the past decade.1 Protein solution rheology is one of the critical physical properties that is measured during early stage development, as viscosity affects syringeability2 and manufacturability,3 and may indicate self-associating protein-protein interactions,4 thermal stability,5 or protein aggregation propensity.6 The effects of temperature on solution viscosity require thorough examination, as drug product manufacturing units operate at different temperatures: tangential flow filtrations and thermal stability studies are often conducted at elevated temperatures (>30 °C),7,8 whereas protein solutions are refrigerated during storage and transportation.9 Various buffer conditions, excipients, and pH affect solution viscosity significantly.10 However, rheometry typically requires sample volumes greater than 100 μl, and such volume requirements limit the number of samples that can be measured. In studies of the effects of temperature on viscosity, another bottleneck lies in the time needed for temperature equilibration; many viscosity measurements are not able to equilibrate multiple samples at the same time, which significantly decreases throughput. There is clearly a need for a small volume, high throughput rheological technique for protein solutions that is capable of rapid parallel temperature equilibration.
Microrheology measures material rheology through the motion of embedded or dispersed colloidal particles.11–13 It has several advantages including that it only requires microliter volume samples and enables fast experimental acquisition. The integration of microfluidics and microrheology has enabled measurements of complex materials over multi-variable composition spaces. Examples include block copolypeptide libraries in the presence of surfactant and salt in a 96-well plate,14 the viscoelastic response of populations of cells as a function of frequency in a multi-functional sorting device,15 solvent-responsive materials in a microfluidic dialysis cell,16 and hydrogelation and degradation of biomaterials in a droplet-forming microfluidic devices.17,18
Earlier, He et al.10 demonstrated the value of parallel temperature equilibration for testing protein solution viscosity in a dynamic light scattering system. But the benefit of utilizing the micrometer dimension microfluidic channels is the rapid temperature control due to shorter lengths of heat conduction and the greater area to volume ratio. This advantage has been demonstrated in a “phase chip” used to map the phase diagram of protein nucleation and crystallization,19–23 a microfluidic viscometer with an embedded fluid temperature controller,24 and a single-sample microcapillary rheometer.25 Rapid temperature control of a microfluidic device capable of holding multiple samples would leverage the advantages of these technologies.
Here, we demonstrate high-throughput temperature-dependent mAb viscometry by combining particle tracking microrheology and microfluidics; the sample temperature is controlled by a Peltier device and calibrated with an internal standard fluid on the chip. We first describe the microfluidic sticker design and fabrication material choice. We design a temperature control stage using a Peltier module, locally controlling the surrounding environment of the samples and enabling rapid equilibration to a set temperature for multiple samples in a microfluidic device. The particle tracking microrheology methods and the experimental analysis using excess kurtosis are briefly reviewed. Sucrose solutions are used to validate the temperature control in situ and to develop a calibration curve. Using a biocompatible microfluidic device and our temperature control setup, 72 temperature-concentration viscosity measurements of monoclonal antibody solutions are obtained using 2 μl samples in approximately 6 h.
II. EXPERIMENTAL METHODS
A. Materials
Two humanized monoclonal antibodies (mAb1 and mAb2) are supplied by Genentech, Inc. (South San Francisco, CA) and stored at −80 °C. The proteins are diluted serially with buffer (30 mM histidine, 0.02% Tween 20, pH 5.4). Sucrose, histidine, histidine-HCl, and Tween 20 are used as received (Sigma-Aldrich).
Fluorescently labeled tracer particles are obtained from Invitrogen; the surface of the amine-modified polystyrene (2a = 0.97 ± 0.022 μm) particles are chemically grafted with poly(ethylene glycol) (PEG) through N-hydroxysuccinimide ester-amine reactions using mPEG-succinimidyl carboxyl methyl ester (MW = 5000, Creative PEGWorks, Winston-Salem, NC). The particles are washed by centrifugating the solution for 6 min at 6000 G, discarding the supernatant, and redispersing in the same volume of ultra-pure Milli-Q water (resistivity 18.2 M Ω cm, Millipore EMD). The washing procedure removes excess fluorescent dye and possible contaminants from their synthesis and storage. The polystyrene-PEG (PS-PEG) particles are sonicated for 20 min and observed under a microscope to verify their colloidal stability. The final particle concentrations needed in the samples are approximately 0.1%w/v; this particle concentration prevents brightness saturation in the camera. The stock concentrations of the probes are concentrated to approximately 10%w/v, so only a small volume is added to each sample.
The 1 μm size probes are chosen to satisfy the continuum assumption in the Stokes equation to measure the bulk rheological properties of the protein samples. The PEG grafted surface chemistry for the probes is selected to prevent surface adsorption by proteins. Although protein adsorption to probe surfaces does not significantly alter the hydrodynamic radius of the probes, it may induce additional interactions between probes.26
B. Microfluidic stickers
Microfluidic stickers are used to create 12 channels, each containing 2 μl, on a single microscope coverslip. The soft imprint lithography process used to fabricate stickers is adapted from Bartolo et al.27 and Natali et al.28 The structured polydimethylsiloxane (PDMS) mold is fabricated using standard photolithography methods. First, a layer of SU-8 2035 photoresist (Microchem) is spin-coated onto a silicon wafer; the photoresist film is exposed to ultraviolet light (365 nm) through a patterned mask printed at Fineline Imaging, 10K DPI resolution PDMS is mixed in a 10:1 ratio of monomer and curing agent (Sylgard 184, Dow Corning), poured over the etched photoresist, degassed, and cured at 65 °C overnight. The PDMS mold serves as the device master from which the microfluidic stickers are fabricated. Approximately 100 μl of thiolene resin (Norland Products, NOA 81) is deposited on a flat substrate made with polyethylene (PE, 3 M, film tape 483, 5.3 mm thick × 1 in wide) supported on PDMS. The master PDMS mold is gently pressed onto the thiolene resin with the help of a roller29 and the module is exposed to UV light for 5 s to partially cure NOA 81. Since oxygen inhibits the free-radical polymerization in the photocuring reaction,30 the gas permeability of PDMS versus the substrate polymer is an important parameter to consider for the ease of handling of the microfluidic sticker. Polyethylene (PE) is chosen as the top layer of the substrate, because its permeability is significantly less than PDMS. The sticker preferentially sticks to the PE substrate rather than the PDMS mold, which makes handling of thin sheets of microfluidic device easier. The PDMS mold is peeled away, leaving the channel sticker on the substrate. Access inlets to channels are carved on the sticker, before the assembly onto a rigid glass substrate (25 × 75 × 0.15 mm, Fisher Scientific) and final curing under UV light. The PE substrate is then peeled off, leaving the sticker on the cover slip. The process can be repeated to assemble multiple stickers comprising different microfluidic networks.
The channel height is set at 125 μm to account for 1% error in hindered particle mobility in a microfluidic channel wall.17,31,32 The microfluidic sticker has 12 channels, each with dimensions 0.35 × 30 × 0.125 mm and holds approximately 2 μl sample volume (Fig. 1). The multiple-channel design enables the parallel temperature equilibration of multiple samples and increases the throughput of the experiments.
FIG. 1.
Scheme of 12-channel microfluidic sticker design. Pre-cured “sticky” layer is indicated in green and is pressed onto a glass cover slip. Inlets are carved prior to final curing and are sealed with additional thiolene drops.
The choice of thiolene chemistry over the traditional PDMS serves multiple purposes. Thiolene stickers can be rapidly fabricated without heating, compared to curing of PDMS at 150 °C for 10 min. Thiolene is impermeable to air and water vapor, preventing evaporation in the channels and is suitable for temperature studies. These advantages of the thiolene sticker decrease device fabrication time, resulting in increased overall throughput.
C. Temperature control
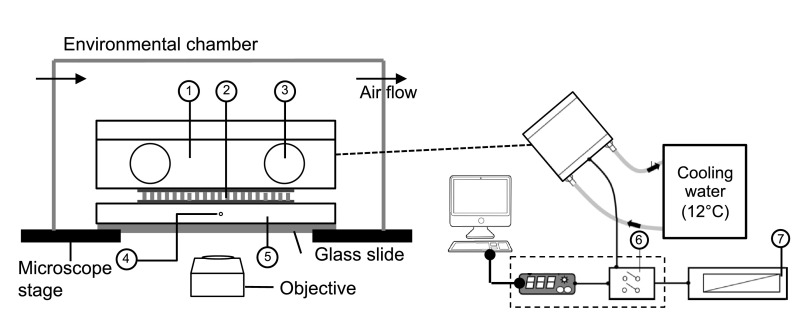
The temperature control unit (Fig. 2) is built with a thermoelectric (Peltier) module with lapped ceramic faces (50 × 50 × 5.2 mm, Tmax = 200 °C, DTmax = 68 °C, Custom Thermoelectric, Bishopville, MD). The Peltier module is sealed between an aluminum contact plate (3 × 3 × 0.25 in., Custom Thermoelectric) and a copper heat sink maintained at 12 °C (3 × 3 × 0.85 in., Custom Thermoelectric). The Peltier module is controlled by a PID controller (TC-48-20, TE Technology, Inc., Traverse City, MI) that is powered by DC power supply. A thermistor sensor (15 k Ω at 25 °C, temperature range −20 °C–100 °C, TE Technology, Inc.) on the side of the contact plate measures the temperature on the stage (and in the samples, assuming steady state temperature equilibration).
FIG. 2.
Schematic of temperature control setup. The components are: 1, copper cooling body; 2, Peltier module; 3, water circulation inlet/outlet; 4, thermistor hole; 5, aluminum contact plate; 6, PID controller with relay unit; and 7, DC power.
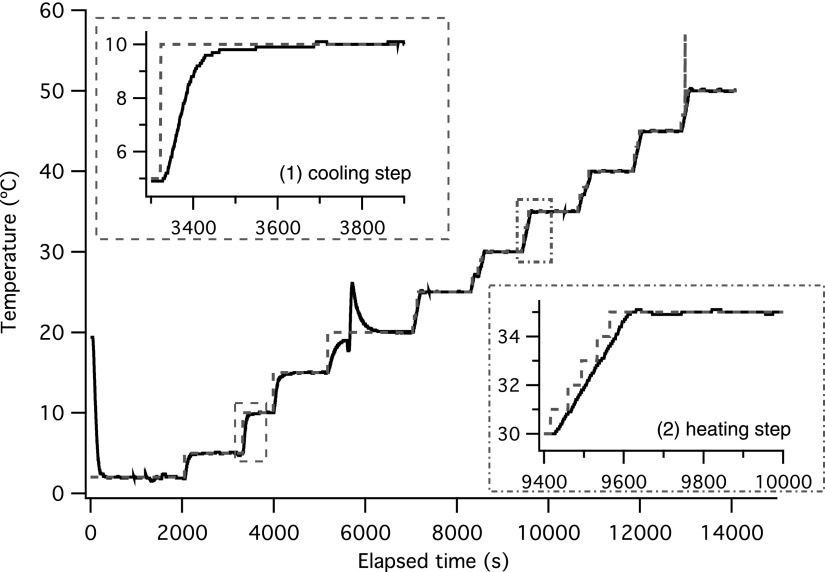
A LabView program records the calibrated PID parameters and the real-time thermistor temperature. A stream of dry air (22 °C and 13% relative humidity) blows across an environmental chamber and above the microscope stage to control the local humidity and eliminate condensation at low temperatures. The entire unit is clamped on the microscope stage to minimize vibrations from the circulating water bath. No vibrations are detected by tracking probes embedded inside a stiff gel sample. An example transient temperature ramp program is shown in Fig. 3. A 5 °C step change is applied to change the temperature in cooling mode; in contrast, five continuous 1 °C step changes are used in the heating mode to prevent temperature overshoot. The measured temperature typically reaches each set point (Tset) within 2 min.
FIG. 3.
Transient temperature ramp; dashed line indicates set point temperature, and solid line shows temperature measured from thermistor in aluminum block. Inset (1) shows an example cooling step and inset (2) shows an example heating step. Note that incremental steps in the heating mode to prevent temperature overshoot. The spike at ∼5500 s occurred when the polarity of the Peltier module is switched.
In the experimental setup, the bottleneck lies in the time to reach thermal steady state for the samples. We first investigate the thermal performance of the Peltier module. On average, it takes approximately 40–60 s for the Peltier to change temperature by 1 °C (Fig. 3). The temperature is measured from thermistor inside the aluminum block and is not in sample materials. However, the heat transfer time in the aluminum block should be negligible, since its thermal diffusivity is α = 85 mm2/s. To verify that the sample reaches thermal equilibrium with the aluminum block, we developed a heat transfer model of the system in its exact dimensions. We start with the time dependent heat transfer PDE in one dimension for a solid with thermal diffusivity α and no generation term
| (1) |
Each material (aluminum, glass, thiolene) obeys this partial differential equation (PDE) in each respective domain; 0 < x < L1 refers to the aluminum contact plate (L1 is half the thickness of aluminum plate), L1 < x < L2 to the glass cover slip, and L2 < x < L3 to the thiolene sticker. At t = 0 s, the thermistor (x = 0) has already detected the set point temperature; the temperature and flux are equal at the material boundaries, and at the interface with dry air, there is convective heat transfer.
The set of PDEs are solved numerically using the geometry of our temperature control module using COMSOL. The simulation results confirm that as the core of aluminum contact plate (the location of thermistor) reaches Tset, the temperature in the thiolene microfluidic sticker equilibrates within 1 s, and there are no discernible temperature differences between 1 s and 600 s. This shows that the temperature control bottleneck lies in the response of the Peltier module to the PID controller. To account for differences in sample composition, the variable speed at which dry air blows across the stage and also any 2-dimensional heat transfer effects (though we expect none), microrheology measurements are taken 7–10 min after Tset is registered to ensure equilibration across samples in the microfluidic sticker.
D. Multiple particle tracking (MPT) experiments
Multiple particle tracking measurements are taken from each equilibrated sample in the microfluidic sticker. Samples are pipetted into the microfluidic channels through carved inlets, and sealed with thiolene resin. Fluorescent video microscopy with a high-speed camera (Phantom v5.1, 50 frames per second, exposure time σ = 5 ms) is used to capture the Brownian motion of the probe particles at 40 times magnification (EC Plan-Neofluar, NA 0.75, Carl Zeiss). The camera settings are selected so that static and dynamic errors of particle tracking experiments are minimized.33 As each movie is saved, the microscope stage is moved to the next sample and refocused. The probe positions are tracked by a brightness-weighted centroid algorithm, and trajectories are formed by linking the probes found in consecutive video frames.34
The details of the particle tracking experiment analysis using Van Hove self-correlation and its statistic parameter excess kurtosis are described in a recent publication.35 Here, we briefly review key aspects of the particle tracking method.11,12,36 The rheological properties of a sample are calculated from the dynamics of the embedded probe particles. The ensemble-averaged mean square displacement (MSD), , is calculated from the probe trajectories at each lag time τ. The Generalized Stokes-Einstein Relation (GSER)11 relates the MSD to bulk rheological properties by , where J(τ) is the material creep compliance, τ is the lag time, a is the probe radius, and kT is the thermal energy. In the limit for a material with Newtonian viscosity η, , and the GSER simplifies to the familiar Stokes-Einstein-Sutherland equation
| (2) |
With a sufficiently large sample of displacements, the distribution of probe displacement is expected to be a normal distribution37 and can be written as the one-dimensional Van Hove space-time correlation function
| (3) |
The Van Hove self-correlation is valid for any material that satisfies the GSER.38 The deviation from normal distribution of the Van Hove correlations may indicate sample heterogeneity39 or incorrect algorithm parameters in tracking probe particles34 and can be quantified using the excess kurtosis
| (4) |
to reflect tailedness and peakedness in a distribution. For a normal distribution, α2 = 0. The excess kurtosis and its test statistic (calculated from standard error of α2) are used to determine the lag time τ at which the probe displacement distribution is closest to being Gaussian. The critical value of is 1.96 at 95% confidence; when , α2 is considered significantly different from zero, and the probe displacement distribution is therefore not close enough to a normal distribution for viscosity calculations. This lag time maximizes the number of displacements while minimizing the static particle tracking error.
III. RESULTS AND DISCUSSION
A. Temperature control validation and calibration by microrheology
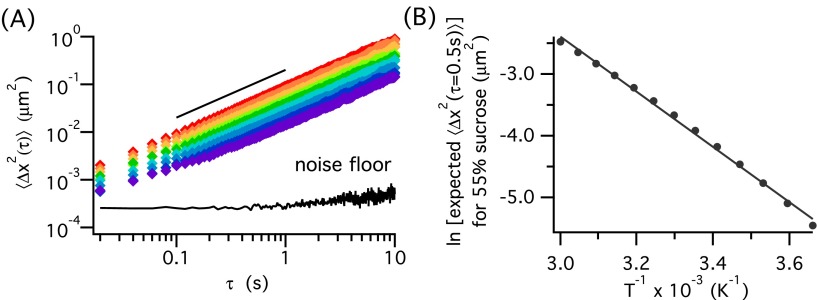
Heat transfer effects may result in the sample temperature being inconsistent with the temperature of the Peltier. While a second thermistor at another location on the Peltier can verify the temperature control, it cannot measure the actual temperature of the sample. In order to obtain an in situ temperature measurement, we introduce a calibration fluid in a channel on the same microfluidic device as the protein samples. A 55% sucrose solution is used as the calibration fluid, because its viscosity range in the target temperature range is well within the operating regime of detectable viscosity without inducing significant static error at short lag times.41 It is also aqueous, making temperature equilibration time comparable to aqueous protein samples. In Fig. 4(a), the ensemble averaged mean squared displacement (MSD) is plotted as a function of lag time τ for 55% sucrose solution at 9 set point temperatures, Tset, from 5 °C to 45 °C. The probe displacements are all above the noise floor measured from particles trapped in a gel, and the logarithmic slopes of 1 of the MSDs show that the sucrose solution is a Newtonian fluid, as expected.
FIG. 4.
Temperature control stage validation. (a) Mean squared displacements of 55% sucrose solution at 9 set point temperatures (Tset = 5–45 °C). Black line indicates a logarithmic slope of 1. (b) Calibration curve of temperature as a function of the expected MSD (τ = 0.5 s) of 55% sucrose solution from tabulated data40 and its Arrhenius fit.
Given a measured mean-squared displacement, the true temperature of the sample can be calculated by rearranging Eq. (2) to . However, since viscosity η is also a function of temperature, the temperature of the sample cannot be directly calculated from the measured MSD. Instead, a calibration curve is used to correlate the MSD (the measured parameter) and temperature (the desired parameter) of sucrose solution. Taking the tabulated viscosity data of 55% sucrose,40 the expected MSD at τ = 0.5 s is calculated using the Stokes-Einstein-Sutherland relation (Eq. (2)) from 273.15 K to 333.15 K in 5 K increments and plotted in Fig. 4(b). The linearized Arrhenius equation
| (5) |
is used as a calibration curve to back calculate temperature based on MSD, with parameters ln A = 11.1 ± 0.568 and −Ea/R = −4490 ± 171 at 95% confidence interval, and a chi-square goodness of fit test of χ2 = 0.036. The simple two-parameter Arrhenius model is chosen because it works well for 55% sucrose in this range of temperature, with the extracted activation energy Ea = 37.3 ± 1.4 kJ/mol in close agreement with the published value.42 However, for calibration fluids that exhibit super-Arrhenius behavior at a wider temperature range, other viscosity models (eg., Vogel-Fulcher-Tammann equation,43–45 Williams-Landel-Ferry equation,46 Avramov-Milchev equation,47 etc.) are needed. Longinotti and Corti48 and Mauro et al.49 discussed the different viscosity models for sucrose and glass-forming liquids extensively. In developing the calibration curve with the Arrhenius equation, the specific lag time τ for the MSD used in the equation depends on the viscosity of the chosen calibration fluid. We find that for 55% sucrose, τ = 0.5 s balances between minimizing tracking error across all temperatures and maximizing the number of observed particle displacements.
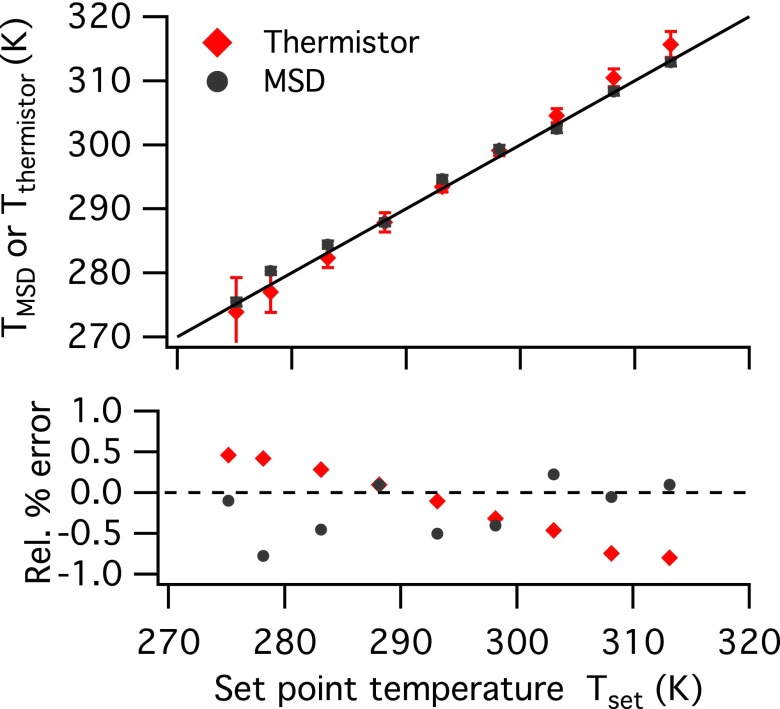
The MSDs at τ = 0.5 s of the sucrose solution at various temperatures from Fig. 4(a) are used in Eq. (5) to calculate TMSD. A second thermistor secured on the edge of the contact plate using aluminum tape (not shown in Fig. 2) is also used to monitor the temperature of the samples, denoted as Tthermistor. The thermistor measurements are taken at the same time as the video microscopy for 30 s. Fig. 5 compares TMSD and Tthermistor to Tset, as well as the calculated relative error, defined as
| (6) |
where i = MSD or thermistor. At room temperature (25 °C), there are negligible differences between the measured temperatures and set point temperature. However, at the extremes of the temperatures studied (i.e., Tset = 5 °C and 45 °C), Tthermistor fluctuates more than TMSD, with bigger absolute error bars. The relative error of Tthermistor compared to Tset also shows a systematic error, decreasing steadily as set point temperature increases. The systematic error is likely due to the contact plate edge losing heat to its surroundings with the constant air flow. In contrast, TMSD from the sucrose sample does not have a systematic error relative to Tset. Since the sucrose sample is embedded in the same microfluidic sticker as the protein samples, the temperature of the sucrose sample represents that of the samples, and TMSD is used as the true temperature of the samples across the microfluidic sticker, corrected from Tset.
FIG. 5.
Comparison of the measured temperatures from MSD and thermistor, TMSD and Tthermistor, to the set point temperature Tset. The solid line (top) is a parity line, and the dashed line (bottom) indicates 0% error. The error bars for TMSD come from error propagation from particle tracking and Arrhenius fit, and the error bars for Tthermistor come from the temperature fluctuations during the 30-s measurements.
To measure the true sample temperature on chip, it is necessary to include a standard calibration fluid alongside the samples. The calibration fluid validates the temperature control setup and corrects for temperature variations on chip. The choice of calibration fluid depends on the application and the range of temperatures for the experiment. An appropriate calibration fluid must have: (1) accurate viscosity data or model in the desired operating temperatures available, (2) viscosity within the operating regime of particle tracking microrheology,17 and (3) similar thermal properties to the sample fluids (i.e., aqueous calibration fluid for aqueous samples).
B. Application to monoclonal antibody solutions
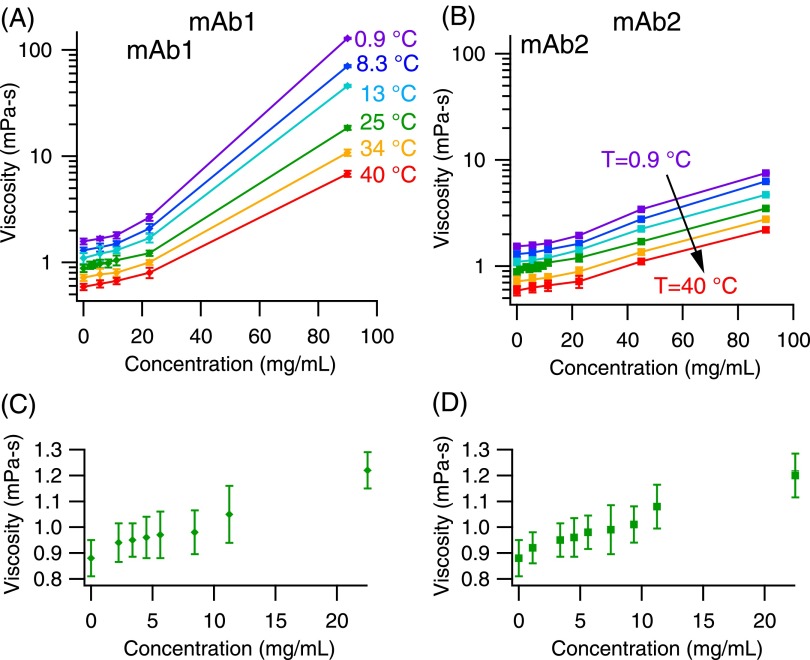
The temperature-dependent viscosity profiles of mAb1 and mAb2 at 6 temperatures (TMSD = 0.9 °C–40 °C) are shown in Figs. 6(a) and 6(b); the mAb solutions were serially diluted two-fold from 90 mg/ml to 5.6 mg/ml. The precise temperature of the samples was measured in situ with a 55% sucrose sample in the same microfluidic sticker. The data for 72 experiments were acquired over approximately 5 h; with 2 μl samples, only 1.5 mg of each mAb was used in total.
FIG. 6.
Viscosity profile for mAb solutions. (a) and (b) Viscosity of mAb1 and mAb2, respectively, as a function of concentration and temperature. The various colors represent data collected at 6 different temperatures, and the lines are drawn to guide the eye. (c) and (d) Viscosity of mAb1 and mAb2 from 0 mg/ml to 22 mg/ml at 25 °C. Note the axis only goes from 0.8 mPa s to 1.3 mPa s; microrheology can measure small incremental changes in viscosity.
The protein solution viscosity increases exponentially as a function of concentration for both proteins. Figs. 6(a) and 6(b) show the important role of protein-protein self-association in the material rheological properties. Though both proteins are of the same IgG1 framework with only 2% sequence differences in the complementarity determining region,50,51 the viscosity behavior at concentrations above 22 mg/ml differs drastically.
Particle tracking microrheology is sensitive in detecting small viscosity changes, as evident in the incremental changes in buffer viscosity η0 (0.7–1.7 mPa s) in the range of temperature examined. The mAb solutions are further diluted in the range of 1–10 mg/ml and their viscosity measured at 25 °C (Figs. 6(c) and 6(d)), and the same observation holds. The intrinsic viscosities of these mAbs are found35 to be [η] = (7.6 ± 0.8) × 10−3 ml/mg, which agrees with reported intrinsic viscosities of other IgG1 antibodies.4,52 The measurement sensitivity of microrheology is only related to particle tracking noise level in the microscope setup.41 Such sensitivity may not hold true for bulk rheometry, as the mechanical torque sensitivity sets the limit of the instrument, and Hellström et al.53 show that sample underfilling leads to errors in rheometry measurements in low viscosity samples.
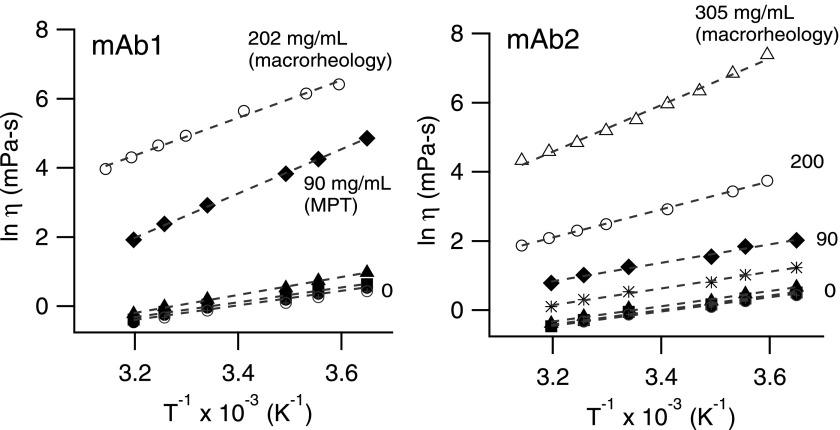
The effect of temperature on protein solution viscosity is illustrated in Fig. 7, with a plot of ln η as a function of 1/T. A linear correlation is found between ln η and inverse temperature, indicating that the relation can be expressed by the Arrhenius equation, which views flow as an activated process and the motions between molecules depend exponentially on the temperature, with the Arrhenius expression for viscosity
| (7) |
where Ea is the activation energy, R is the gas constant, and A is a pre-factor. The apparent activation energy is calculated between T1 = 0.9 °C and T2 = 40 °C by fitting the Arrhenius equation to compare the two mAbs. The solution viscosity of a material departs from the Arrhenius equation when there is strong association between molecules, for example, as water approaches its freezing point. Protein solutions typically exhibit nearly Arrhenius behavior, with an apparent activation energy that depends on the protein molecule, its concentration, and excipients in the solution.54,55 Temperature studies are therefore informative in evaluating whether protein solutions exhibit such behaviors.
FIG. 7.
Semi-logarithmic plot of viscosity against inverse temperature. Open symbols are experiments performed with a cone-and-plate rheometer. Dashed lines are fits to the Arrenius equation (Eq. (7)). Note the higher slope for 90 mg/ml mAb1 and the curvature of the higher concentrations.
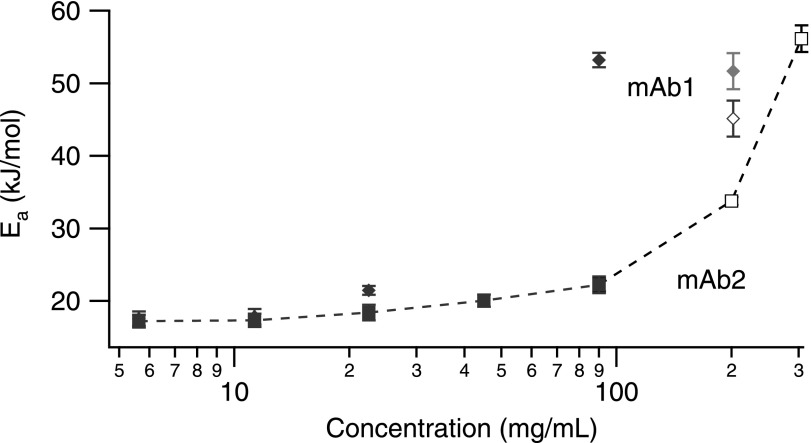
The Arrhenius viscosity relation reasonably captures the temperature dependence of the two monoclonal antibody solutions. At low concentrations (5.6–22.5 mg/ml), the apparent activation energy between mAbs is similar (Ea = 18 ± 3 kJ/mol) (Fig. 8) and consistent with the expected value for water (Ea = 15 kJ/mol). At higher concentrations, however, the activation energy increases. At 202 mg/ml, mAb1 exhibits an activation energy of Ea = 54 ± 0.3 kJ/mol and mAb2 at 200 mg/ml is 34 ± 0.5 kJ/mol. Interestingly, the activation energy for 90 mg/ml mAb1 (Ea/R = 6404 ± 89, goodness of fit χ2 = 0.005) is higher than that for 202 mg/ml measured by bulk rheology. However, fitting the first five points of the 202 mg/ml mAb1 bulk data brings these values more in line, Ea = 51 ± 1 kJ/mol. The non-linear dependence of the higher concentration protein solutions (>200 mg/ml) suggests that protein-protein interactions begin to play a dominant role in towards the solution activation energy, and consequently leads to departures from Arrhenius behavior.
FIG. 8.
Apparent activation energies of mAb solutions as a function of concentration for mAb1 (diamonds) and mAb2 (squares). The open symbols are for bulk rheology measurements. A second value is given for mAb1 at 202 mg/ml (grey diamond), reflecting different temperature ranges of the fitted data.
Data such as these may be useful in future understanding of protein-protein interactions and self-association in concentrated systems; here, we simply demonstrate the capability of parallel temperature-dependent microrheological measurements in microfluidic channels. Our setup makes it possible to examine the effect of temperature on the material even when the amount of sample is too small (less than 10 μl) to be measured by macrorheology.
IV. CONCLUSIONS AND OUTLOOK
Accurate in situ measurement of temperature is obtained by inserting the calibration fluid in the same microfluidic device with protein samples. We demonstrate that 72 temperature-concentration viscosity measurements of mAb solutions can be made in a single day. Particle tracking microrheology combined with microfluidics can be used to explore the rheology of protein solutions as a function of concentration and temperature, and our setup increases experiment throughput significantly by eliminating temperature equilibration in each sample separately, such as in traditional rheometry. Interfacing with higher throughput sample preparation using droplet microfluidic would be straightforward, resulting in rapid acquisition of formulation or solution conditions library available at early stage pharmaceutical development.
References
- 1. Aggarwal S. R., Nat. Biotechnol. 32, 32 (2014). 10.1038/nbt.2794 [DOI] [PubMed] [Google Scholar]
- 2. Burckbuchler V., Mekhloufi G., Giteau A. P., Grossiord J. L., Huille S., and Agnely F., Eur. J. Pharm. Biopharm. 76, 351 (2010). 10.1016/j.ejpb.2010.08.002 [DOI] [PubMed] [Google Scholar]
- 3. Shire S. J., Curr. Opin. Biotechnol. 20, 708 (2009). 10.1016/j.copbio.2009.10.006 [DOI] [PubMed] [Google Scholar]
- 4. Kanai S., Liu J., Patapoff T. W., and Shire S. J., J. Pharm. Sci. 97, 4219 (2008). 10.1002/jps.21322 [DOI] [PubMed] [Google Scholar]
- 5. Liu C., Vailhe C., Samuel N., and Min Q., Int. J. Pharm. 374, 1 (2009). 10.1016/j.ijpharm.2009.03.030 [DOI] [PubMed] [Google Scholar]
- 6. Cheng W., Joshi S. B., Jain N. K., He F., Kerwin B. A., Volkin D. B., and Middaugh C. R., J. Pharm. Sci. 102, 4291 (2013). 10.1002/jps.23748 [DOI] [PubMed] [Google Scholar]
- 7. He F., Woods C. E., Trilisky E., Bower K. M., Litowski J. R., Kerwin B. A., Becker G. W., Narhi L. O., and Razinkov V. I., J. Pharm. Sci. 100, 1330 (2011). 10.1002/jps.22384 [DOI] [PubMed] [Google Scholar]
- 8. Rubin J., Sharma A., Linden L., Bommarius A. S., and Behrens S. H., J. Phys. Chem. B 118, 2803 (2014). 10.1021/jp411185d [DOI] [PubMed] [Google Scholar]
- 9. Palm T., Sahin E., Gandhi R., and Khossravi M., “ The importance of the concentration–temperature–viscosity relationship for development of biologics,” BioProcess Int. 13, 32 (2015). [Google Scholar]
- 10. He F., Woods C. E., Litowski J. R., Roschen L. A., Gadgil H. S., Razinkov V. I., and Kerwin B. A., Pharm. Res. 28, 1552 (2011). 10.1007/s11095-011-0388-7 [DOI] [PubMed] [Google Scholar]
- 11. Mason T. G. and Weitz D. A., Phys. Rev. Lett. 74, 1250 (1995). 10.1103/PhysRevLett.74.1250 [DOI] [PubMed] [Google Scholar]
- 12. Mason T. G., Ganesan K., van Zanten J. H., Wirtz D., and Kuo S. C., Phys. Rev. Lett. 79, 3282 (1997). 10.1103/PhysRevLett.79.3282 [DOI] [Google Scholar]
- 13. Parthasarathy R., Nat. Methods 9, 724 (2012). 10.1038/nmeth.2071 [DOI] [PubMed] [Google Scholar]
- 14. Breedveld V. and Pine D. J., J. Mater. Sci. 38, 4461 (2003). 10.1023/A:1027321232318 [DOI] [Google Scholar]
- 15. Krayer J., Tatic-Lucic S., and Neti S., Sens. Actuators B 118, 20 (2006). 10.1016/j.snb.2006.04.080 [DOI] [Google Scholar]
- 16. Sato J. and Breedveld V., J. Rheol. 50, 1 (2006). 10.1122/1.2135329 [DOI] [Google Scholar]
- 17. Schultz K. M. and Furst E. M., Lab Chip 11, 3802 (2011). 10.1039/c1lc20376b [DOI] [PubMed] [Google Scholar]
- 18. Schultz K. M., Baldwin A. D., Kiick K. L., and Furst E. M., ACS Macro Lett. 1, 706 (2012). 10.1021/mz300106y [DOI] [PMC free article] [PubMed] [Google Scholar]
- 19. Shim J. U., Cristobal G., Link D. R., Thorsen T., and Fraden S., Cryst. Growth Des. 7, 2192 (2007). 10.1021/cg700688f [DOI] [PMC free article] [PubMed] [Google Scholar]
- 20. Shim J. U., Cristobal G., Link D. R., Thorsen T., Jia Y., Piattelli K., and Fraden S., J. Am. Chem. Soc. 129, 8825 (2007). 10.1021/ja071820f [DOI] [PMC free article] [PubMed] [Google Scholar]
- 21. Selimović Š., Jia Y., and Fraden S., Cryst. Growth Des. 9, 1806 (2009). 10.1021/cg800990k [DOI] [PMC free article] [PubMed] [Google Scholar]
- 22. Selimović Š., Gobeaux F., and Fraden S., Lab Chip 10, 1696 (2010). 10.1039/b925661j [DOI] [PubMed] [Google Scholar]
- 23. Li L. and Ismagilov R. F., Annu. Rev. Biophys. 39, 139 (2010). 10.1146/annurev.biophys.050708.133630 [DOI] [PubMed] [Google Scholar]
- 24. Kang Y. J. and Yang S., Microfluid. Nanofluid. 14, 657 (2013). 10.1007/s10404-012-1085-5 [DOI] [Google Scholar]
- 25. Hudson S. D., Sarangapani P., Pathak J. A., and Migler K. B., J. Pharm. Sci. 104, 678 (2015). 10.1002/jps.24201 [DOI] [PubMed] [Google Scholar]
- 26. Sule S. V., Dickinson C. D., Lu J., Chow C. K., and Tessier P. M., Mol. Pharmaceutics 10, 1322 (2013). 10.1021/mp300524x [DOI] [PubMed] [Google Scholar]
- 27. Bartolo D., Degre G., Ngheb P., and Studer V., Lab Chip 8, 274 (2008). 10.1039/B712368J [DOI] [PubMed] [Google Scholar]
- 28. Natali M., Begolo S., Carofiglio T., and Mistura G., Lab Chip 8, 492 (2008). 10.1039/b716594c [DOI] [PubMed] [Google Scholar]
- 29. Arayanarakool R., Le Gac S., and van den Berg A., Lab Chip 10, 2115 (2010). 10.1039/c004436a [DOI] [PubMed] [Google Scholar]
- 30. Jeong H. E. and Suh K. Y., Lab Chip 8, 1787 (2008). 10.1039/b810348h [DOI] [PubMed] [Google Scholar]
- 31. Faxén H., Ann. Phys. 373, 89 (1922). 10.1002/andp.19223731003 [DOI] [Google Scholar]
- 32. Happel J. and Brenner H., Low Reynolds Number Hydrodynamics: With Special Applications to Particulate Media ( Prentice-Hall, 1965). [Google Scholar]
- 33. Savin T. and Doyle P. S., Biophys. J. 88, 623 (2005). 10.1529/biophysj.104.042457 [DOI] [PMC free article] [PubMed] [Google Scholar]
- 34. Crocker J. C. and Grier D. G., J. Colloid Interface Sci. 179, 298 (1996). 10.1006/jcis.1996.0217 [DOI] [Google Scholar]
- 35. Josephson L. L., Galush W. J., and Furst E. M., J. Rheol. 60, 531 (2016). 10.1122/1.4948427 [DOI] [Google Scholar]
- 36. Mason T. G., Dhople A., and Wirtz D., MRS Proc. 463, 153 (1996). 10.1557/PROC-463-153 [DOI] [Google Scholar]
- 37. Van Hove L., Phys. Rev. 95, 249 (1954). 10.1103/PhysRev.95.249 [DOI] [Google Scholar]
- 38. Höfling F. and Franosch T., Rep. Prog. Phys. 76, 046602 (2013). 10.1088/0034-4885/76/4/046602 [DOI] [PubMed] [Google Scholar]
- 39. Weeks E. R., Crocker J. C., Levitt A. C., Schofield A., and Weitz D. A., Science 287, 627 (2000). 10.1126/science.287.5453.627 [DOI] [PubMed] [Google Scholar]
- 40. Swindells J. F., Viscosities of Sucrose Solutions at Various Temperatures: Tables of Recalculated Values ( National Institute of Standards and Technology, 1958). [Google Scholar]
- 41. Schultz K. M. and Furst E. M., Soft Matter 8, 6198 (2012). 10.1039/c2sm25187f [DOI] [Google Scholar]
- 42. Telis V. R. N., Telis-Romero J., Mazzotti H. B., and Gabas A. L., Int. J. Food Prop. 10, 185 (2007). 10.1080/10942910600673636 [DOI] [Google Scholar]
- 43. Vogel H., Phys. Z. 22, 645 (1921). [Google Scholar]
- 44. Fulcher G. S., J. Am. Ceram. Soc. 8, 339 (1925). 10.1111/j.1151-2916.1925.tb16731.x [DOI] [Google Scholar]
- 45. Tammann G. and Hesse W., Z. Anorg. Allg. Chem. 156, 245 (1926). 10.1002/zaac.19261560121 [DOI] [Google Scholar]
- 46. Williams M. L., Landel R. F., and Ferry J. D., J. Am. Chem. Soc. 77, 3701 (1955). 10.1021/ja01619a008 [DOI] [Google Scholar]
- 47. Avramov I. and Milchev A., J. Non-Cryst. Solids 104, 253 (1988). 10.1016/0022-3093(88)90396-1 [DOI] [Google Scholar]
- 48. Longinotti M. P. and Corti H. R., J. Phys. Chem. Ref. Data 37, 1503 (2008). 10.1063/1.2932114 [DOI] [Google Scholar]
- 49. Mauro J. C., Yue Y., Ellison A. J., Gupta P. K., and Allan D. C., Proc. Natl. Acad. Sci. U. S. A. 106, 19780 (2009). 10.1073/pnas.0911705106 [DOI] [PMC free article] [PubMed] [Google Scholar]
- 50. Yadav S., Sreedhara A., Kanai S., Liu J., Lien S., Lowman H., Kalonia D. S., and Shire S. J., Pharm. Res. 28, 1750 (2011). 10.1007/s11095-011-0410-0 [DOI] [PubMed] [Google Scholar]
- 51. Chaudhri A., Zarraga I. E., Yadav S., Patapoff T. W., Shire S. J., and Voth G. A., J. Phys. Chem. B 117, 1269 (2013). 10.1021/jp3108396 [DOI] [PubMed] [Google Scholar]
- 52. Yadav S., Shire S. J., and Kalonia D. S., J. Pharm. Sci. 99, 4812 (2010). 10.1002/jps.22190 [DOI] [PubMed] [Google Scholar]
- 53. Hellström L. H. O., Samaha M. A., Wang K. M., Smits A. J., and Hultmark M., Meas. Sci. Technol. 26, 015301 (2014). 10.1088/0957-0233/26/1/015301 [DOI] [Google Scholar]
- 54. Monkos K., Biochim. Biophys. Acta (BBA), Protein Struct. Mol. Enzymol. 1339, 304 (1997). 10.1016/S0167-4838(97)00013-7 [DOI] [PubMed] [Google Scholar]
- 55. Monkos K., Biophys. Chem. 85, 7 (2000). 10.1016/S0301-4622(00)00127-7 [DOI] [PubMed] [Google Scholar]


