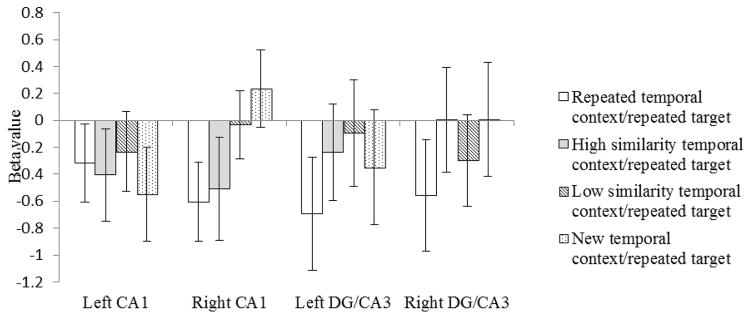
Figure 3.
Beta values to repeated target images following temporal context that was an identical repeat (white bars), high in similarity to the original temporal context (grey bars), low in similarity to the original temporal context (striped bars), or unrelated to the original temporal context (dotted bars). Error bars indicate the standard error of the means.

