

Abstract
The flow of viscous fluid in the cochlea induces shear forces, which could provide benefit in clinical practice, for example to guide cochlear implant insertion or produce static pressure to the cochlear partition or wall. From a research standpoint, studying the effects of a viscous fluid in the cochlea provides data for better understanding cochlear fluid mechanics. However, cochlear perfusion with a viscous fluid may damage the cochlea. In this work we studied the physiological and anatomical effects of perfusing the cochlea with a viscous fluid. Gerbil cochleae were perfused at a rate of 2.4 μL/min with artificial perilymph (AP) and sodium hyaluronate (Healon, HA) in four different concentrations (0.0625%, 0.125%, 0.25%, 0.5%). The different HA concentrations were applied either sequentially in the same cochlea or individually in different cochleae. The perfusion fluid entered from the round window and was withdrawnfrom basal scala vestibuli, in order to perfuse the entire perilymphatic space. Compound action potentials (CAP) were measured after each perfusion. After perfusion with increasing concentrations of HA in the order of increasing viscosity, the CAP thresholds generally increased. The threshold elevation after AP and 0.0625% HA perfusion was small or almost zero, and the 0.125% HA was a borderline case, while the higher concentrations significantly elevated CAP thresholds. Histology of the cochleae perfused with the 0.0625% HA showed an intact Reissner’s membrane, while in cochleae perfused with 0.125% and 0.25% HA Reissner’s membrane (RM) was torn. Thus, the CAP threshold elevation was likely due to the broken of RM, which likely caused by the shear stress produced by the flow of the viscous fluid. Our results and analysis indicate that the cochlea can sustain, without a significant CAP threshold shift, up to a 1.5 Pa shear stress. Beside these finding, in the 0.125% and 0.25% HA perfusion cases, a temporary CAP threshold shift was observed, perhaps due to the presence and then clearance of viscous fluid within the cochlea, or to a temporary position shift of the Organ of Corti. After 0.5% HA perfusion, a short latency positive peak (P0) appeared in the CAP wavefrom. This P0 might be due to a change in the cochlea’s traveling-wave pattern, or distortion in the cochlear microphonic.
Keywords: cochlear perfusion, sodium hyaluronate, compound action potential, viscous fluid, cochlear mechanics, cochlear implantation
1. Introduction
Cochlear perfusion is a useful technique to alter the fluid within the cochlea. Since the first use of inner ear perfusion (Tasaki et al., 1954), cochlear perfusion technique has gradually matured and is now regularly used in research. To improve controlling parameters in cochlear perfusions, Nuttall et al. (1982) provided data about the influence of pH, temperature and dissolved oxygen gas concentration of the perfusate. Prieskorn and Miller (2000) developed a stable intracochlear infusion technique with micro-cannula and osmotic pump for rodents that enabled both chronic and acute intracochlear perfusions while maintaining hearing. Different kinds of fluid, or even bubbles (Nishioka and Yanagihara, 1986) have been applied in cochlear perfusion for a variety of purposes. The objectives of these studies included assessing ototoxicity of drugs (e.g. Fitzgerald et al., 1993), understanding properties of cochlear fluid (e.g. Salt et al., 1991), investigating cochlear mechanics by controlling the extracellular environment (e.g. Santos-Sacchi et al., 2006). Ours is the first study to our knowledge to investigate the effect of viscous fluid in a complete perilymphatic perfusion.
A viscous fluid induces high shear forces when the fluid is flowing. This physical property enables cochlear perfusion with viscous fluid to produce pressure/force in cochlea. Salt et al. (2009) injected highly viscous fluid into the apex of the cochlea to mechanically displace the organ of Corti (OC) in vivo and investigated sensitivity changes. On the other hand, the flowing fluid may damage the cochlear structures. Our prior study presented a novel perfusion-based method for cochlear implant (CI) electrode insertion (Kale et al., 2014), using perfusion of a viscous fluid (0.5% HA, Healon, Abbot Labs Inc.) to guide the CI insertion. The shear forces produced by the flow of viscous fluid successfully brought the CI electrode deeply into cochlea (or a desired insertion depth), and the flow of the lubricating fluid prevented the CI from penetrating delicate cochlear structures. However, CAP thresholds were elevated, perhaps because of the large shear stress on intracochlear fluid/tissue boundaries. To further develop the injection-insertion technique, a fluid with suitable viscosity needs to be found, to minimize the damage while still being able to carry the CI within the cochlea.
From a research standpoint, studying the effects of viscous fluid in the cochlea provides data for better understanding cochlear fluid mechanics. The cochlear fluid is perilymph in scala vestibuli (SV) and scala tympani (ST), and endolymph in scala media (SM). Their viscosity is similar to that of water (Kleinfeldt and Dahl, 1970). The traveling wave in the cochlea is based on fluid inertia and OC stiffness, and if the fluid in the cochlea became substantially more viscous, the cochlea’s mechanical response and wave pattern will change. Studies on cochlear models showed that an increase in fluid viscosity led to a decrease in BM motion and the longitudinal width of the envelope of the traveling wave (Tonndorf, 1957), and flattened the tuning curves (Gan et al., 2007). In another model fluid viscosity was necessary to suppress standing waves (White and Grosh, 2005).
HA is a viscoelastic and biocompatible fluid widely used in eye surgery (Hütz et al., 1996) and also used as a lubricant that is placed in the round window (RW) during cochlear implantation. In this work the physiological and anatomical effects of perilymphatic perfusion of HA of various concentrations and viscosities were examined in vivo in gerbil.
2. Methods
2.1. Animal preparation
Animal procedures were approved by the Institutional Animal Care and Use Committee (IACUC) of Columbia University. Adult female gerbils with normal compound action potential (CAP) response were used in the experiments. Animals were sedated with ketamine, and anesthetized with Pentobarbital, with supplemental dosing throughout the experiment. Saline was given every two hours, and Buprenorphine was given every six hours as an analgesic. Body temperature was monitored via a rectal probe, and was maintained around 37 °C by a thermostatically controlled heating pad. The pinna was removed. The animal was placed in a supine position and a tracheotomy was performed to maintain a clear airway. A horizontal incision from the skin above the trachea to the ear was made, to expose the bulla, which was opened with forceps to expose the cochlea.
Fig.1 illustrates the cochleostomy for perfusion of the left ear. Both openings for accessing the ST and SV were made in the basal part of the cochlea in order to perfuse the entire cochlear perilymph space. For accessing the ST, the round window membrane (RWM)was torn, and for the SV, a ~ 200 μm diameter hole was made using a hand drill, in the SV area below SM (SM region is blue in Fig.1B).
Fig.1. View of the gerbil cochlea from the bulla opening.
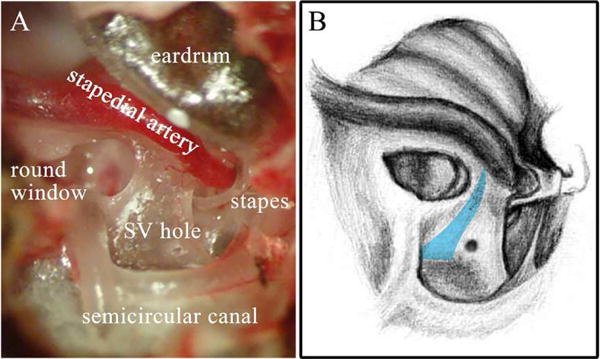
The cochleostomy can be seen in the SV, and the RWM was torn so the perfusion fluid could enter the cochlea. A: Experimental photo with cochlea structure labeled. Apex of the cochlea was covered by eardrum, thus is not visible here. B: Corresponding sketch, with eardrum removed. The wall of the SM is represented in blue. Drawing by Vanessa Cervantes.
2.2. Perfusion system set up
We needed to seal the gap between the perfusion tubing and the SV opening in order to create a leak-free system and maintain an accurate perfusion rate. This made it challenging to change the perfusion fluid while experimenting, since reattaching the inlet tubing can easily damage, or introduce bubbles into the cochlea. To overcome this difficulty, and also to be consistent with our previous work (Kale et al., 2014), a reverse perfusion method was used (Fig.2). Instead of infusing the fluid, the perfusion pump was set to a withdrawal mode. While perfusing, the perfusion fluid entered ST through the open RW, flowed up to the apex and back down and out through the SV hole, thus perfusing the cochlear perilymphatic space.
Fig.2. Diagram of perfusion system.

A: Set up of the perfusion system. The gray color indicates the fluid space, and the arrow indicates the flow direction. Perfusion fluid was supplied to the ST space at the open RW with a soft syringe, and pulled out from basal SV hole by a perfusion pump in withdraw mode. The SV hole and perfusion pump were connected by a perfusion cannula (illustrated in detail at B), with one side inserted into the SV hole and the other side connected to the perfusion pump. The gap between the tip of the perfusion cannula and the SV hole was sealed by dental cement to create a leak-free perfusion system. B: Detailed diagram of perfusion cannula. The tip that was inserted into SV (left side in the figure) was composed of a polyimide-coated glass tubing and a capillary. A length of tubing connected the tip to the syringe pump. The different parts of the perfusion cannula were glued together with silicone rubber.
To implement the reverse perfusion, the following system was used: The RW opening was filled slowly by hand with perfusion fluid using a syringe with a soft rubber needle. Fluid in the RW opening was gently wicked out with soft tissue paper each time before changing the perfusion fluid. The SV hole was plugged with a prepared cochlear perfusion cannula as illustrated in Fig.2B, and its tip was glued to the SV hole with dental cement (Durelon™ Carboxylate Cement). The perfusion cannula consisted of a 4 mm piece of polyamide-coated glass tubing (Polymicro corp.) (151 μm o.d., 75 μm i.d.) with one end connected to a 5 cm length of capillary (1.5 mm o.d., 0.75 mm i.d.), which was itself connected to a perfusion pump (WPI’s UltraMicroPump III with microprocessor controller Micro4™). The tip of the Polymicro tubing was cut flat to avoid trauma to intracochlear structures. To produce a precise and constant perfusion rate, firm tubing was chosen and the perfusion pump was set at a microstep mode. All the parts of this cannula were connected using silicone rubber to ensure it was air and water tight.
The perfusion pump was set to withdraw the fluid through the perfusion cannula at a controlled perfusion rate. For our general study, a 10 min perfusion with 2.4 μL/min rate was applied to perfuse the whole ~ 3 μL perilymphatic space several times over (Thorne et al., 1999). This made up for any residual fluid in the RW opening, and also was approximately the perfusion time duration needed for the implantation technique (Kale et al., 2014).
2.3. Perfusion fluid preparation
In this experiment, both artificial perilymph (AP) and Healon (HA, Abbot Labs Inc.) were used for perfusion. AP served as a control to ensure that perfusing this low-viscosity fluid did not damage the cochlea. HA was the experimental fluid in different concentrations/viscosities. Generally, HA with higher concentration has higher viscosity (Maleki et al., 2007). Four different concentrations were prepared (0.0625%, 0.125%, 0.25% and 0.5%) by diluting 1% HA with AP (NaCl 125 mM, KCl 3 mM, NaHCO3 25 mM, CaCl2 1.3 mM, MgCl2 1.2mM and NaH2PO4 0.75mM, in a pH of 7.4) (Salt and Demott, 1998). The fluids were at room temperature (25 °C) before use.
2.4. Stimulating sound generation and CAP recording
In this study, CAP thresholds were measured to gauge cochlear condition. To measure the CAP response, a silver wire electrode was placed on the bony round window. The reference electrode was inserted into the muscle of the jaw, and the gerbil body was grounded. An AC amplifier with a first order high pass filter and a second order low pass filter, with a pass band of ~ 200 Hz – 4 kHz, was used to measure the CAP response. Sound stimulation was generated by a Tucker Davis Technologies (TDT) System driving a Radio Shack dynamic speaker, connected in a closed-field configuration to the ear canal (EC). The calibration of sound was performed within the EC using a Sokolich ultrasonic probe microphone. The CAP stimulus was composed of a 3 ms tone pip of variable frequency presented every 12 ms, with alternating polarity to eliminate the linear component of the CM from the averaged responses. CAP responses were collected for 16 frequencies ranging from 0.5 kHz to 40 kHz. Thresholds were determined as ~ 3–6 μV peak-to-peak responses. Limited by the highest sound level the system could generate, in some experiments threshold responses at high frequencies were not attainable and are not included in the presented results.
2.5. Histology
To investigate the impairment caused by perfusion with viscous fluid, experimental cochleae were examined histologically. After euthanasia, the experimental cochlea was gently perfused with fixative (2.5% glutaraldehyde, 1.5% formaldehyde in 0.065M sodium phosphate buffer at pH of 7.3) using the perfusion system that was established. The cochlea from the other side was used as control, where RW and oval window were opened to circulate the fixative. Both the experimental and control cochleae were removed from the temporal bones and immersed in fixative for 24 hours. They were then decalcified in a 120 mM EDTA (at pH of 7) solution for 6 days, and washed in phosphate buffer. After decalcification, the cochleae were dehydrated with increasing concentrations of ethanol, and then with increasing concentrations of polypropylene oxide (PPO) initially diluted by ethanol. The cochleae were then permeated with increasing concentrations of Embed 812 Mixture (21 mL Embed 812, 13 mL DDSA, 11.0 mL NMA, 0.7 mL DMP30) in PPO. Finally, the specimens were embedded in Embed 812 Mixture kept at vacuum for 24 hours and then cured in a 60°C oven for 24 hours. Sections were cut at a thickness of 1.5 μm and mounted on glass slides, stained with Toludine blue and examined by optical microscopy.
2.6. Shear stress estimation
The maximal shear stress produced by perfusing viscous fluid through the cochlea was estimated. For estimation, we approximate HA as a Newtonian fluid, because then shear rate and shear stress can be found in a straightforward manner. Regarding the uncoiled gerbil cochlea as a circular tube and taking the perfusion flow as laminar, the shear stress at the wall of the cochlea is:
| (Eq. 1) |
Where μ is the viscosity of the perfusion fluid (units Pas). HA is a non-Newtonian fluid and its viscosity depends on shear rate, in addition to concentration. The viscosity was found from the graph in Maleki et al., 2007. These will be given below in Table 1 of the discussion section. is the shear rate:
| (Eq. 2) |
Table 1. Estimation of the maximal shear stress on the cochlear wall and the pressure drop between the RW and the basal SV generated during the cochlear perfusion.
The cochlea was treated as an uncoiled tube and the shear rate on the cochlear wall was 31.3 s−1 (see text). HA is assumed to have a constant viscosity at each concentration.
| HA Concentration | Viscosity (Pas) |
Shear stress (Pa) |
Pressure drop (Pa) |
|---|---|---|---|
| 0% (AP) | 0.001 | 0.03 | 3.9 |
| 0.0625% | 0.05 | 1.5 | 195 |
| 0.125% | 0.09 | 2.8 | 351 |
| 0.25% | 0.3 | 9.2 | 1169 |
| 0.5% | 0.5 | 15.3 | 1949 |
Q is the volume flow rate, corresponding to the perfusion rate of 2.4 μL/min. R is the radius, ~ 118.5 μm for this calculation. According to the anatomical data (http://oto2.wustl.edu/cochlea/mrgbvol.htm), over a large fraction of their length ~ 3 – 7 mm from base (~ 8 mm was the total), both SV and ST have nearly constant cross sectional areas. In the noted range, the area of SV is slightly smaller than ST, and we used SV for our calculation of shear stress. We regarded the cross sectional of SV as a circle, calculated the radius and used the average over the aforementioned length range for R in Eq. 2. According to the above estimations the shear rate on the scala wall was 30.6 s−1; it will be smaller in the basal region where the areas are larger.
The pressure drop along the whole cochlea between the RW and SV hole is estimated as:
| (Eq. 3) |
To calculate pressure, the varying cross sectional areas of SV and ST were used. x is the distance from the base of gerbil cochlea. rSV(x) and rST(x)are the radius of SV and ST as a function of distance. LSV and LST are the total lengths of the uncoiled SV and ST.
3. Results
3.1. CAP thresholds were elevated after perfusion with viscous fluid
Our goal was to investigate the highest value of viscosity that the cochlea could be perfused with, while maintaining ~ normal CAP thresholds. The experiment started with AP perfusion, followed by HA concentrations from low to high. For each concentration, as noted in section 2.2, a 10 min perfusion with a rate of 2.4 μL/min was applied.
Fig.3 shows the CAP threshold change of two ears: A and C for the first, B and D for the second. For 0.125% and 0.25% HA perfusions, the thresholds that obtained after they stabilized are shown; these were measured ~ 40 min and 60 min after the perfusions respectively. Fig. 3A shows that the pre-perfusion CAP thresholds taken after fixing the perfusion apparatus and removing the RWM were similar to baseline (< 5dB change). Similar results were also found in our other experiments. Those findings indicate that opening the RW, making the cochleostomy, and gluing the perfusion cannula were not very traumatic. Fig. 3C and D show that the AP perfusion had little effect on thresholds, and with increasing concentrations of HA, the thresholds increased. The threshold elevation after 0.0625% HA perfusion was small, but after 0.5% HA perfusion the thresholds were > 90 dB SPL. The 0.125% concentration was a borderline case in that it was damaging in one case (Fig.3A and C) and relatively mildly damaging in the other (Fig.3B and D).
Fig.3. CAP threshold change after cochlear perfusion with different fluids.
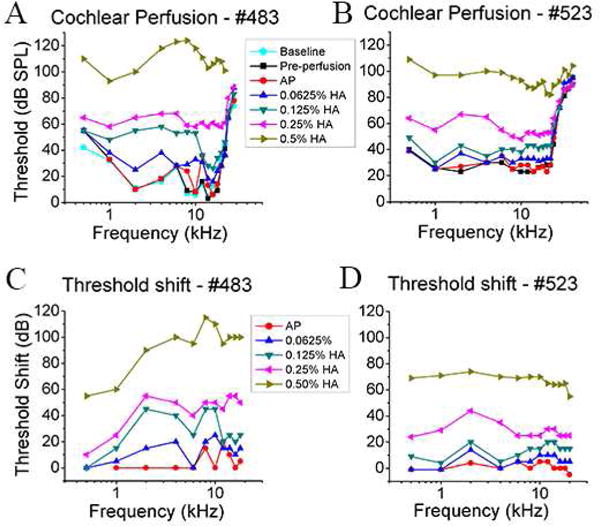
Data from gerbil # 483 are shown in A and C and the data from gerbil # 523 are shown in B and D. AP, 0.0625% HA, 0.125% HA, 0.25% HA, and 0.5% HA were perfused sequentially at the rate of 2.4 μL/min, in the order of increasing viscosity. Baseline thresholds were measured just after the bulla was opened. Pre-perfusion thresholds were measured after the cochleostomy was made and the perfusion cannula was cemented to the cochlea. A, B: CAP threshold curves after cochlear perfusion; C, D: Corresponding CAP threshold shift compared with pre-perfusion. 0.5–20 kHz stimulus range is shown. For 0.125% and 0.25% HA perfusion, several CAP threshold measurements were made after perfusion and the stabilized thresholds are shown.
Following perfusions in which CAP thresholds were elevated, thresholds were measured several times over ~ an hour to see if thresholds would recover. Since after 0.0625% HA perfusion the threshold elevation was small, and after 0.5% HA perfusion the CAP thresholds were greatly elevated and altered in character, only 0.125% and 0.25% HA perfusion were used to study the CAP threshold recovery. Fig.4 compares shifts in CAP thresholds measured immediately following HA perfusion to those measured some time later. The data are from the same two cochleae as in Fig.3. Both after 0.125% and 0.25% HA perfusions, the thresholds recovered to some degree and stabilized at a new level. Thresholds after 0.125% HA perfusion improved by as much as 20 dB within 20 min, to a level where they stabilized, while for 0.25% HA perfusion thresholds improved ~5–20 dB and stabilized after 40min.
Fig.4. CAP threshold stabilization after cochlear perfusion with viscous fluid.

Data are from the same animals as in Fig.3, A, C for #483, and B, D for #523. A, B: CAP thresholds after 0.125% HA perfusion, measured at the time just after perfusion (0 min), and ~ 20 and ~ 40 min later. C, D: CAP thresholds after 0.25% HA perfusion, measured at the time just after perfusion (0 min), and ~ 20, ~ 40 and ~ 60 min later.
To further examine the effect of HA perfusion, cochlear perfusion with 0.0625% HA, 0.125% HA and 0.25% HA were investigated individually in different cochlea. Each perfusion started with a 10 min 2.4 μL/min AP perfusion as a control. Fig.5 shows the CAP threshold changes from three cochleae perfused with HA of each of these concentrations. Similar to the results of Fig.3, 0.0625% HA perfusion (Fig.5A) resulted in almost no elevation of CAP thresholds, but 0.125% and 0.25% HA perfusion (Fig.5B and C) resulted in significant elevation. Following the 0.125% and 0.25% HA perfusions, CAP thresholds were also measured several times and threshold recovery was observed to be similar to Fig.4.
Fig.5. CAP threshold change after cochlear perfusion with 0.0625%, 0.125% and 0.25% HA.
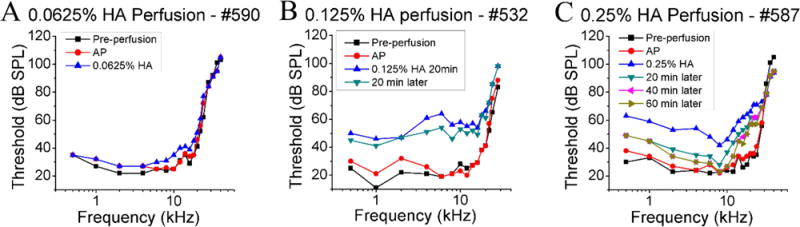
CAP threshold curves from three animals perfused separately with A: 0.0625% HA, B: 0.125% HA and C: 0.25% HA are shown. Each cochlea was perfused first with AP, followed by HA. Thresholds after 0.125% and 0.25% HA perfusion were measured several times to observe the threshold stabilization.
The results presented above showed that perfusion of certain HA concentrations consistently did (0.5%) or did not (0.0625%) cause trauma, while in the mid-range of 0.125% and 0.25% HA, cochleae responded to the perfusions with various threshold elevations and recoveries. Likely the range of responses is related to the cochlear morphology; perhaps the less traumatized cochleae had wider cochlear scalae compared to the other cochleae (Plassmann et al., 1987), so that smaller shear stresses were produced.
3.2. CAP waveform changed after perfusion
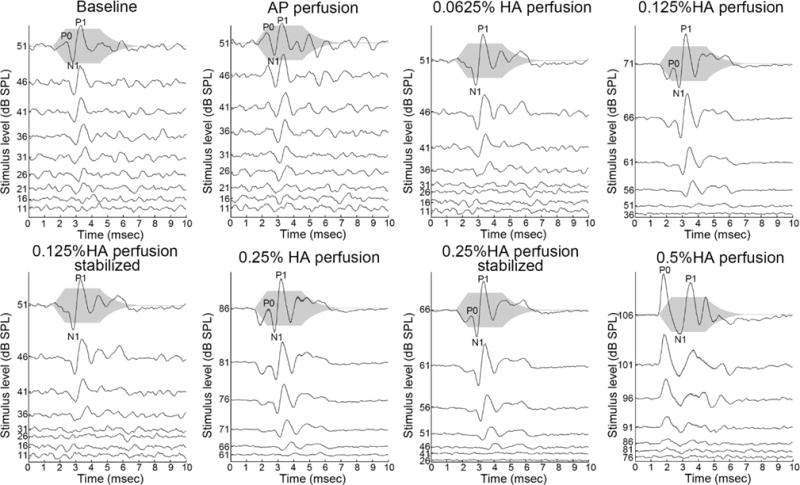
In addition to the elevation of CAP thresholds, the CAP response waveforms changed after perfusion with the relatively concentrated HA solutions. Fig.6 shows an example. The stimulus was a 4 kHz tone pip. Along with the threshold recovery illustrated in Fig.4 and Fig.5, the CAP response waveform also recovered over time. After 0.5% HA perfusion, in addition to the pronounced CAP threshold elevation, the CAP waveform showed an altered peak structure and latency. In the baseline condition, the CAP response normally started with a valley N1 followed by a peak P1, followed by several small additional waves. The largest peak is P1, with latency in the range of 3.7–4.2 ms, gradually decreasing with the increasing stimulus level. In contrast, after the 0.5% HA perfusion, the response started with a peak P0 at 2 ms, following by several large valleys and peaks. The P0 was not always the largest peak and was only evident at high stimulus level. This short latency P0 also appeared after some low concentration perfusions (as labeled in Fig.6), but those CAP responses still started with a deep valley. A P0 was also found in some healthy CAP responses (Fig.7 baseline condition at 8 kHz and 51 dB SPL for example), but in healthy cochleae P0 was directly attributable to distinguishable in a subset of frequencies and well-supra-threshold stimulus levels. However, it is not only because of high stimulus levels since P0 did not appear with a 4 kHz stimulus even when the stimulus level was high ~ 100 dB. Another observation of the response to the 4 kHz stimulus following perfusion was the development of a substantial response at the second harmonic, at 8 kHz. Since our method to cancel the CM in the CAP response (alternating polarity of stimulation) only works on the linear portion of the CM response, the 8 kHz component of the response is most certainly due to nonlinear distortion in CM at this high stimulus level, producing a pronounced second harmonic. Nonlinearity is also apparent in a DC shift of the response, in which the entire response waveform was offset in the positive direction.
Fig.6. Example of CAP waveform change in response to a 4 kHz stimulus (animal: #523).

The gray shadow indicates the stimulus envelope. (The magnitude of the envelope does not reflect the stimulus level.) The dashed lines in conditions of “baseline” and “after 0.5% HA perfusion” indicate the first peak latency at the largest stimulus level. After 0.5% HA perfusion, substantial waveform changes occurred; in particular the CAP response began with a large, short latency P0 instead of N1. The CAP response waveform partially recovered over time after the 0.125% HA and 0.25% HA perfusions. The rippled response that appeared first after the 0.125% perfusion at high stimulus levels is at 8 kHz (second harmonic of 4kHz), and this and the DC offset of the response are likely due to increased nonlinear distortion in CM.
Fig.7. Example of CAP waveform changes in response to an 8 kHz stimulus (animal: #523).
The gray shadow indicates the stimulus envelope. After 0.5% HA perfusion, the CAP response was distorted and started with a large, short-latency P0. A small P0 appeared at high stimulus levels even in the baseline condition. CM second harmonic is not apparent but could be present, as it would have been substantially attenuated by the CAP amplifier filter.
3.3. Viscous fluid perfusion tore Reissner’s membrane
The changes in CAP waveform were only significant after perfusion of relatively high concentration HA, and may be due to the presence of viscous fluid in the cochlea or to trauma within the cochlea, or both. The presence of trauma is supported by the further results presented below.
For the next step we investigated the cause of CAP threshold elevation presented in section 3.1. HA is known to be nontoxic to the cochlea (Salt et al., 2009) and therefore physical explanations were investigated. Since perfusate with the higher viscosity elevated the CAP thresholds more, two hypotheses were considered: 1. The increased viscosity of the cochlear fluid reduced the motions of the OC, leading to elevated thresholds; 2. Permanent damage of the cochlea occurred during cochlea perfusion. For the first hypothesis, the perfusion fluid was hypothesized to remain within the cochlea, damping the mechanical responses and thus affecting the hearing. In this case, the CAP thresholds would recover after replacing the viscous HA fluid with AP. For the second hypothesis, perfusion with high viscosity HA introduced shear stress that was sufficient to tear the RM or OC. In this case, the CAP thresholds would not recover after AP perfusion.
To test hypothesis 1, responses with HA perfusion followed by AP perfusion were investigated. Experiments started with a 10 min 2.4 μL/min 0.125% HA perfusion, then a 20 min wait time, followed by a 10 min 2.4 μL/min AP perfusion. Results are in Fig.8. CAP thresholds were elevated after the 0.125% HA perfusion and recovered slightly after 20 min, confirming the result in Fig.4. However, after the AP perfusion, the thresholds did not recover further. This result points to the second hypothesis, that CAP thresholds were elevated because of trauma induced by shear stress within the cochlear duct.
Fig.8. CAP thresholds of HA cochlear perfusion followed by AP perfusion.

The CAP thresholds were measured pre-perfusion, just after 0.125% HA perfusion, 20 min later, and just after AP perfusion. The thresholds improved 20 min after HA perfusion, and did not recover further after AP perfusion.
To further explore this hypothesis, we histologically evaluated cochleae perfused with 0.0625% HA, 0.125% HA and 0.25% HA. Because of the histological processing, some parts of the OC were distorted, such as the pillar cells and tectorial membrane (Edge et al., 1998). However, as shown in Fig.9, Reissner’s membrane (RM) was partly torn after 0.125% and 0.25% HA (Fig. 9B and C), while the RM after 0.0625% HA perfusion (Fig. 9A) and in a control cochlea (Fig. 9D) was intact. The result of the control cochlea and the one perfused with 0.0625% HA confirms that the histological processing and repeated cochlear perfusions did not cause the RM rupture. Considered along with the physiological data from the same cochleae in Fig.5, the observations of broken RM and CAP threshold elevation are correlated – the RM was only found to be broken in those cases when CAP thresholds were elevated. These results support the hypothesis that permanent damage of the cochlea occurred because of the shear stress produced during cochlea perfusion. The stress scales with the viscosity and larger stresses are likely responsible for the observation that the 0.5% HA perfusion resulted in larger and permanent CAP threshold elevations compared to perfusion with the lower dilution HA.
Fig.9. Histological photo for perfused and control cochlea.

Corresponding physiological data was in Fig.5. A: 0.0625% HA perfused cochlea. RM was intact. B: 0.125% HA perfused cochlea. RM was partly torn (circled in red). C: 0.25% HA perfused cochlea. RM was partly torn (circled in red). D: Control. The RM was intact. Some parts of the OC were distorted because of the histological processing.
4. Discussion
4.1. Estimation of shear stress and pressure drop
The present study provides results of cochlear perfusion with viscous fluid of various viscosities. The shear stress and pressure drops produced during the perfusion were calculated using the formulae introduced in section 2.6 and results are shown in Table 1. Pure perilymph (AP) is also considered here for reference, and is taken to have a viscosity similar to that of water, 0.001 Pas (Kleinfeldt and Dahl, 1970). The viscosities for HA solution with different concentration were estimated from Maleki et al. (2007).
According to our results the cochlea can sustain the shear stress produced by 0.0625% HA at 25°C without significant damage. This would produce a shear stress up to 1.5 Pa, which is a factor of ~ 50 larger than the shear stress produced by AP perfusion. Shear stresses of 2.8 and 9.2 Pa, produced by the 0.125% and 0.25% HA perfusions respectively, resulted in a moderate hearing loss, based on the CAP threshold shifts observed in Fig.3 – 5. The 15.3 Pa shear stress produced by 0.5% HA perfusion is a factor ~ 510 larger than AP perfusion and resulted in a severe hearing loss.
The final column in the table is an estimation of the pressure drop across the whole cochlea between the basal SV and the RW, due to the perfusion. It provides a tool for determining the static pressure that is required for a full perilymphatic perfusion.
4.2. Estimation of perturbation to cochlear mechanics due to viscous fluid
When a more viscous fluid replaces the perilymph, BM motion may be affected because of the change in viscous forces. We did a study to determine when viscous forces are likely to become dominant in cochlear mechanics by comparing the size of terms in the Navier-Stokes equation. The Navier-Stokes equation relates pressure gradients to fluid motion in an incompressible fluid:
| (Eq. 4) |
ρ is fluid density, assumed that of water, 103 kg/m3. v is the fluid velocity (m/s). The sizes of the terms in the Navier-Stokes equation that involve fluid velocity can be estimated using dimensional analysis. Define L and U, scale factors used to characterize the fluid system. L is the extent over which fluid velocities vary by a factor of ~ e. Measured close and perpendicular to the BM, this was found to be ~ 15 μm, independent of stimulus level and frequency (Olson, 1999). The theoretically predicted value is reasonably similar to this: Yoon et al. (2007) show a decrease in slow-wave pressure of a factor of ~ 4 over an extent of 50 μm, perpendicular to the BM. 15 μm (the worse-case value for the purposes of the calculation here) is used for L in Table 2. U is scale factor of BM velocity, and depends on frequency and stimulus level. In a recent study (Dong and Olson, 2013), at the 24 kHz best frequency the velocity amplitude, U, was ~ 0.5 mm/s at 30 dB SPL and ~ 3 mm/s at 80 dB SPL. At 5 kHz it was ~ 2 μm/s at 30 dB SPL and ~ 0.6 mm/s at 80 dB SPL. ω is radian frequency. μ is the viscosity of the cochlear fluid, .001 Pas for AP. As noted above, the viscosity of HA varies with shear rate; it is smaller at larger shear rates. Using shear rates calculated as 0.5U/L, the corresponding fluid viscosities were found from the Maleki (2007) reference at 37 °C. The viscosity values are noted in Table 2 for HA concentrations of 0.125% and 0.5%. In Table 2 we compare the estimated sizes of the three terms in the Navier Stokes equation that depend on fluid velocity. The three are labeled the “inertial”, “nonlinear” and “viscous” terms.
Table 2. Comparison of terms in the Navier-Strokes equation.
The units for all the terms is Pa/m. μ value is as noted, and with the unit Pas. p = 103 kg/m3, L = 15 urn, U = 0.5 mm/s at 24 kHz and 30 dB SPL, 3 mm/s at 24 kHz and 80 dB SPL, 2 μm/s at 5 kHz and 30 dB SPL and 0.6 mm/s at 5 kHz and 80 dB SPL. See text for further explanation.
| Frequency & Stimulus Level |
|
|
|
|||||
|---|---|---|---|---|---|---|---|---|
| AP | 0.125% HA | 0.5% HA | ||||||
| 24kHz 30dB | 7.5×10⁴ | 17 | 2.2×10³ (μ = 0.001) | 1.6×10⁵ (μ = 0.07) | 1.6×10⁶ (μ = 0.70) | |||
| 24kHz 80dB | 4.5×10⁵ | 600 | 1.3×10⁴ (μ = 0.001) | 4.7×10⁵ (μ = 0.04) | 3.3×10⁶ (μ = 0.25) | |||
| 5kHz 30dB | 63 | 3×10⁻⁴ | 8.9×100 (μ = 0.001) | 4.4×10³ (μ = 0.50) | 2.7×10⁴ (μ = 3.00) | |||
| 5kHz 80dB | 1.9×10⁴ | 24 | 2.7×10³ (μ = 0.001) | 1.9×10⁵ (μ = 0.07) | 1.9×10⁶ (μ = 0.70) | |||
The nonlinear (second) term is much smaller than the other terms in all entries. It does not depend on viscosity and it is negligible throughout this analysis. The inertial (first) and viscous (third) terms are more similar in size. When the cochlea is filled with perilymph the inertial term is larger than the viscous term by a factor of 34 at 24 kHz and a factor of 7 at 5 kHz. For the 0.125% HA concentration the viscous term is larger than the inertial term by a factor of ~ 2 at 24 kHz, 30 dB SPL, and the terms are ~ equal at 25 kHz, 80 dB SPL. At 5 kHz, 30 dB SPL the viscous term is larger than the inertial term by a factor of 70 and by a factor of 10 at 80 dB SPL. Thus, with the 0.125% concentration of HA, viscous forces are expected to play a much larger role in cochlear mechanics. The U and L values above were taken from measurements in a normal cochlea, and due to the increased viscosity, U will decrease, but this affects the inertial and viscous terms similarly so does not affect their relative size. L, the distance over which the fluid velocity changes, is likely to increase in a more viscous fluid and this would mitigate the affect of viscosity, since that term is proportional to 1/L2. It is notable that we do not perfuse SM, so that side of the OC is not affected by the high viscosity perfusions, and that will reduce the affect of viscosity. Viscosity of endolymph and perilymph have been reported as similar (Kate and Kuiper, 1970). Thus, with the 0.125 % HA, the inertial and viscous terms are likely both significant. With an increase to 0.5% HA, the viscous term is much larger than the inertial term and cochlear mechanics is expected to be dominated by viscous forces, which would eliminate the traveling wave.
4.3. Possible explanation for Temporary threshold shift (TTS)
During the experiment, TTS was found after 0.125% and 0.25% HA perfusions. It is possible that the viscous fluid affecting the traveling-wave pattern contributed to the TTS. As discussed in section 4.2, the viscous term is significant with 0.125% HA. The viscous fluid might be naturally removed due to perilymph flow, and replaced by perilymph, which would return the cochlea to a more normal state. Salt et al. (1991) explored natural flow in the cochlea and reported that the clearance of trimethylphenylammonium (TMPA) from ST ranged from 20 min to 70 min depending on the turn of the cochlea where TMPA had been injected. These times are in the range of the times needed for TTS to stabilize in our study. It may require less time to clear the TMPA in their work since only 50 nl TMPA was injected into a small cochleostomy. On the other hand, since in our experiment the RW was torn, the perilymph flow rate should be higher as a result of cerebrospinal fluid pressure (Ohyama and Salt, 1988), thus less time would be needed to remove the HA. Therefore it is reasonable to consider that the clearance times of our study would be comparable to those of Salt et al.
Another possibility is a temporary position shift of RM and OC. In Flock and Flock (2000), static pressure caused hydrops and reduction of CM. Several studies found CAP threshold elevation under SM hydrops (Horner and Cazals, 1990; Salt et al., 2009). In the experiment of Salt et al. (2009), SM, CM, CAP and EP were measured while pressurizing the cochlea with a slow injection of viscous 1% HA into the apex (1 μL max, at a rate of 0.1 μL/min). All these quantities were affected by the injection and all returned to normal essentially immediately when the injection stopped. This is different from our results in which the perfusion-induced changes in CAP persisted. It is possible that our experiment caused a long-lasting displacement of RM and OC and thus a longer lasting TTS, with partial recovery. However, due to the torn RM that we observed histologically, permanent damage occurred following full cochlear perfusions with HA of concentration 0.125% and above.
4.4. The CAP waveforms
In Fig. 6 and 7 show that a significant CAP waveform change occurred after 0.5% HA perfusion. One substantial change is the appearance of the short latency P0. Fig.6 shows that in the normal cochlea the latency of P1 decreased as stimulus level increased. In results from a normal cochlea, a stimulus level increase from 35 to 95 dB SPL reduced P1 latency by ~ 0.72 ms. The P1 at 36 dB SPL in Fig.6 occured at ~ 4 ms, so at 95 dB SPL P1 would be at ~ 3.28 ms, which is much later than the latency of P0 in Fig.6. Therefore, P0 is qualitatively different than P1, and seems to be a different response. It is notable that a P0 did not appear in a healthy cochlear response to the same frequency (4 kHz) even when the stimulus level was high, ~ 100 dB, but sometimes was present at some frequencies as a small peak (Fig.7). Below we give some speculative explanations for P0.
One possibility is that the viscous 0.5% HA fluid caused the cochlea’s mechanical response to by dominated by a fast-mode instead of the normal slow traveling-wave mode (Huang and Olson, 2011; Olson, 2013). Fast-mode operation would reduce the latency of the CAP response and account for the short latency of P0. Indeed, the dimensional analysis of section 4.2 showed the dominance of viscous over inertial forces. This would severely damp the traveling-wave mode, which is based on the dominance of inertial fluid forces.
Antoli-Candela and Kiang (1978) found a similar P0 peak when they measured the CAP response to a click stimulus, and they ascribed it to CM. In our experiments, distorted CM could be seen in some responses as a second harmonic disturbance and a DC offset (Fig.6) and it is evident that nonlinearity in the mechanoelectric transduction that gives rise to CM has become exaggerated by the perfusion. It is possible that P0 is primarily produced by a combination of CAP response and the DC component of the CM, the summating potential (SP). As mentioned in section 4.3, Flock and Flock (2000) found that static pressure caused a temporary hydrops of SM, and several studies have shown that hydrops of SM can result in increased SP (Kumagami et al., 1981; van Deelen et al., 1987). Salt et al. (2009) found that apical injections of viscous HA resulted in increased CM distortion and increased SP, and attributed the observations to a mechanically induced change in transducer operating point. Overall, we suspect that the short latency P0 is based in a combination of increased CM nonlinear distortion, with the presence of viscous fluid contributing to the short-latency.
4.5. Possible effects of torn RM
In our histological studies, even 0.125% HA perfusion could cause tearing of the RM, which is expected to impair cochlear function. Although it was not measured, EP would drop and EP is necessary for normal cochlear function (Hibino and Kurachi, 2006; Sewell, 1984; Ruggero and Rich, 1991). In addition, it is possible that the endolymph and perilymph would mix. We withdrew the fluid from the SV, which might have caused a slightly negative pressure in SV compared to SM, causing endolymph to flow from the SM into the SV. Notably, endolymph would have flown into SV, and not directly into ST. Tasaki et al. (1954) showed that endolymph in ST greatly depressed CM and auditory nerve responses, likely due to the high extracellular K+ leading to hair cell depolarization and damage. In our study, the endolymph would flow from the RM opening to SV but would not then flow to the ST because the perfusion fluid went from ST to SV. Previous studies have indicated that connections between endolymph and perilymph can lead to localized impairment. For example Suga et al. (1964) showed that EP in the basal turn was not affected by destruction of the more apical turns, and vice-versa. These findings are in accord with our results that the 0.125% and 0.25% perfusions of Figs. 5 and 9 did not elevate CAP thresholds drastically even though they resulted in a torn RM.
5. Conclusion
The physiological and anatomical effects of perfusing the cochlea with a viscous fluid were studied. With increasing concentrations, and thus increasing viscosity of HA, the CAP thresholds increased. The cochlea could sustain, without CAP threshold shift, a perfusion of up to 0.0625% HA at the rate of 2.4 μL/min, corresponding to a 1.5 Pa shear stress. 0.125% and 0.25% HA perfusion caused some hearing loss, and RM damage in the cases where histology was performed. The perfusion of HA at higher concentrations produced sufficient shear stress to cause large threshold shifts, which could partially recover. The recovery may be because of the natural clearing of viscous fluid from the perilymphatic space, or because of a temporary shift in the position of the OC. The perfusion of the highest concentration HA we used (0.5%) occurred with a CAP waveform change in which a short latency positive peak P0 appeared, which is suspected to be due to a combination of fast-mode domination of cochlear mechanics and increased CM nonlinear distortion due to transducer operating point changes.
The shear stress and pressure drop of cochlear perfusion with fluid of different viscosities were estimated. This provides a useful standard for considering what viscosities and flow rates are likely to be safe in cochlear perfusions.
This study was motivated by findings in which 0.5% HA solution was used in a novel perfusion-implantation technique. Although the technique was successful in achieving deep cochlear implantations without the implant penetrating the cochlear partition, it led to substantial threshold elevation. Based on our findings, 0.0625% HA is safe for 2.4 μL/min perfusions in the gerbil. In humans, with substantially wider scalae, these numbers can be considered lower limits. For the future development of the perfusion-implantation concept, in order for 0.0625% HA to be successful in guiding a cochlear implant, very compliant implants will be required, and perhaps a surface treatment to make them more fully coupled to the only moderately viscous perfusion fluid.
Highlights.
The maximum shear stress that the cochlea can sustain without damage was explored.
CAP thresholds increased when the viscosity of the cochlear perfusate increased.
Cochlear perfusion with a viscous fluid could alter cochlear mechanics.
Cochlear perfusion with a viscous fluid could rupture Reissner’s membrane.
Acknowledgments
This work was funded by the NIDCD and the Emil Capita Foundation. We acknowledge Sushrut Kale’s assistance.
Footnotes
Publisher's Disclaimer: This is a PDF file of an unedited manuscript that has been accepted for publication. As a service to our customers we are providing this early version of the manuscript. The manuscript will undergo copyediting, typesetting, and review of the resulting proof before it is published in its final citable form. Please note that during the production process errors may be discovered which could affect the content, and all legal disclaimers that apply to the journal pertain.
References
- Antoli-Candela F, Kiang NYS. Evoked Electrical Activity in the Auditory Nervous System. Academic Press; New York: 1978. Unit activity underlying the N1 potential; pp. 165–191. [Google Scholar]
- Dong W, Olson ES. Detection of cochlear amplification and its activation. Biophysical journal. 2013;105:1067–1078. doi: 10.1016/j.bpj.2013.06.049. [DOI] [PMC free article] [PubMed] [Google Scholar]
- Edge RM, Evans BN, Pearce M, Richter CP, Hu X, Dallos P. Morphology of the unfixed cochlea. Hearing Research. 1998;124:1–16. doi: 10.1016/S0378-5955(98)00090-2. [DOI] [PubMed] [Google Scholar]
- Fitzgerald JJ, Robertson D, Johnstone BM. Effects of intra-cochlear perfusion of salicylates on cochlear microphonic and other auditory responses in the guinea pig. Hearing research. 1993;67:147–156. doi: 10.1016/0378-5955(93)90242-S. [DOI] [PubMed] [Google Scholar]
- Flock Å, Flock B. Hydrops in the cochlea can be induced by sound as well as by static pressure. Hearing Research. 2000;150:175–188. doi: 10.1016/S0378-5955(00)00198-2. [DOI] [PubMed] [Google Scholar]
- Gan RZ, Reeves BP, Wang X. Modeling of Sound Transmission from Ear Canal to Cochlea. Annals of Biomedical Engineering. 2007;35:2180–2195. doi: 10.1007/s10439-007-9366-y. [DOI] [PubMed] [Google Scholar]
- Hibino H, Kurachi Y. Molecular and physiological bases of the K+ circulation in the mammalian inner ear. Physiology (Bethesda, Md) 2006;21:336–345. doi: 10.1152/physiol.00023.2006. [DOI] [PubMed] [Google Scholar]
- Horner KC, Cazals Y. Alterations of CAP audiogram by increased endolymphatic pressure and its relation to hydrops. Hearing research. 1990;45:145–150. doi: 10.1016/0378-5955(90)90190-Z. [DOI] [PubMed] [Google Scholar]
- Huang S, Olson ES. Auditory nerve excitation via a non-traveling wave mode of basilar membrane motion. JARO – Journal of the Association for Research in Otolaryngology. 2011;12:559–575. doi: 10.1007/s10162-011-0272-5. [DOI] [PMC free article] [PubMed] [Google Scholar]
- Hütz WW, Eckhardt HB, Kohnen T. Comparison of viscoelastic substances used in phacoemulsification. Journal of cataract and refractive surgery. 1996;22:955–959. doi: 10.1016/S0886-3350(96)80198-2. [DOI] [PubMed] [Google Scholar]
- Kale S, Cervantes VM, Wu MR, Pisano DV, Sheth N, Olson ES. A novel perfusion-based method for cochlear implant electrode insertion. Hearing Research. 2014;314:33–41. doi: 10.1016/j.heares.2014.05.003. [DOI] [PMC free article] [PubMed] [Google Scholar]
- Kate JH, Kuiper JW. The viscosity of the pike’s endolymph. Journal of Experimental Biology. 1970;53:495–500. [Google Scholar]
- Kleinfeldt D, Dahl D. Eine Methode der viscositätsmessung der perilymphe in der meerschweinchenschnecke unter physiologischen bedingungen. European Archives of Oto-Rhino-Laryngology. 1970;197:31–40. [PubMed] [Google Scholar]
- Kumagami H, Nishida H, Moriuchi H. Changes of the action potential, the summating potential and cochlear microphonics in experimental endolymphatic hydrops. ORL. 1981;43:314–327. doi: 10.1159/000275552. [DOI] [PubMed] [Google Scholar]
- Maleki A, Kjøniksen AL, Nyström B. Anomalous viscosity behavior in aqueous solutions of hyaluronic acid. Polymer Bulletin. 2007;59:217–226. doi: 10.1007/s00289-007-0760-2. [DOI] [Google Scholar]
- Nishioka I, Yanagihara N. Role of air bubbles in the perilymph as a cause of sudden deafness. Otology & Neurotology. 1986;7:430–438. [PubMed] [Google Scholar]
- Nuttall AL, LaRouere MJ, Lawrence M. Acute perilymphatic perfusion of the guinea pig cochlea. Hearing research. 1982;6:207–221. doi: 10.1016/0378-5955(82)90055-7. [DOI] [PubMed] [Google Scholar]
- Ohyama K, Salt AN. Volume flow rate of perilymph in the guinea-pig cochlea. Hearing research. 1988;35:119–129. doi: 10.1016/0378-5955(88)90111-6. [DOI] [PubMed] [Google Scholar]
- Olson ES. Fast waves, slow waves and cochlear excitation. Proceedings of Meetings on Acoustics. 2013;19:050134. doi: 10.1121/1.4799326. [DOI] [Google Scholar]
- Olson ES. Direct measurement of intra-cochlear pressure waves. Nature. 1999;402:526–529. doi: 10.1038/990092. [DOI] [PubMed] [Google Scholar]
- Plassmann W, Peetz W, Schmidt M. The cochlea in gerbilline rodents. Brain, behavior and evolution. 1987;30:82–102. doi: 10.1159/000118639. [DOI] [PubMed] [Google Scholar]
- Prieskorn DM, Miller JM. Technical report: Chronic and acute intracochlear infusion in rodents. Hearing Research. 2000;140:212–215. doi: 10.1016/S0378-5955(99)00193-8. [DOI] [PubMed] [Google Scholar]
- Ruggero MA, Rich NC. Furosemide alters organ of corti mechanics: evidence for feedback of outer hair cells upon the basilar membrane. The Journal of neuroscience. 1991;11:1057–1067. doi: 10.1523/JNEUROSCI.11-04-01057.1991. [DOI] [PMC free article] [PubMed] [Google Scholar]
- Salt AN, Brown DJ, Hartsock JJ, Plontke SK. Displacements of the organ of Corti by gel injections into the cochlear apex. Hearing Research. 2009;250:63–75. doi: 10.1016/j.heares.2009.02.001. [DOI] [PMC free article] [PubMed] [Google Scholar]
- Salt AN, Demott JE. Longitudinal endolymph movements induced by perilymphatic injections. Hearing research. 1998;123:137–147. doi: 10.1016/S0378-5955(98)00106-3. [DOI] [PubMed] [Google Scholar]
- Salt AN, Ohyama K, Thalmann R. Radial communication between the perilymphatic scalae of the cochlea. I: Estimation by tracer perfusion. Hearing research. 1991;56:29–36. doi: 10.1016/0378-5955(91)90150-8. [DOI] [PubMed] [Google Scholar]
- Santos-Sacchi J, Song L, Zheng J, Nuttall AL. Control of mammalian cochlear amplification by chloride anions. The Journal of neuroscience. 2006;26:3992–3998. doi: 10.1523/JNEUROSCI.4548-05.2006. [DOI] [PMC free article] [PubMed] [Google Scholar]
- Sewell WF. The effects of furosemide on the endocochlear potential and auditory-nerve fiber tuning curves in cats. Hearing Research. 1984;14:305–314. doi: 10.1016/0378-5955(84)90057-1. [DOI] [PubMed] [Google Scholar]
- Suga F, Morimitsu T, Matsuo K. Endocochlear DC potential: how is it maintained along the cochlear turns? The Annals of otology, rhinology, and laryngology. 1964;73:924–933. doi: 10.1177/000348946407300405. [DOI] [PubMed] [Google Scholar]
- Tasaki I, Davis H, Eldredoe DH. Exploration of Cochlear Potentials in Guinea Pig with a Microelectrode. The Journal of the Acoustical Society of America. 1954;26:765–773. doi: 10.1121/1.1907415. [DOI] [Google Scholar]
- Thorne M, Salt AN, DeMott JE, Henson MM, Henson OW, Gewalt SL. Cochlear fluid space dimensions for six species derived from reconstructions of three-dimensional magnetic resonance images. The Laryngoscope. 1999;109:1661–1668. doi: 10.1097/00005537-199910000-00021. [DOI] [PubMed] [Google Scholar]
- Tonndorf J. Fluid motion in cochlear models. The Journal of the Acoustical Society of America. 1957;29:558–568. doi: 10.1121/1.1908965. [DOI] [Google Scholar]
- Van Deelen GW, Ruding PRJW, Veldman JE, Huizing EH, Smoorenburg GF. Electrocochleographic study of experimentally induced endolymphatic hydrops. Archives of oto-rhino-laryngology. 1987;244:167–173. doi: 10.1007/BF00464262. [DOI] [PubMed] [Google Scholar]
- White RD, Grosh K. Microengineered hydromechanical cochlear model. Proceedings of the National Academy of Sciences of the United States of America. 2005;102:1296–1301. doi: 10.1073/pnas.0407446102. [DOI] [PMC free article] [PubMed] [Google Scholar]
- Yoon YJ, Puria S, Steele CR. Intracochlear pressure and derived quantities from a three-dimensional model. The Journal of the Acoustical Society of America. 2007;122:952–966. doi: 10.1121/1.2747162. [DOI] [PubMed] [Google Scholar]