Abstract
Retracted blood clots have been previously recognized to be more resistant to drug-based thrombolysis methods, even with ultrasound and microbubble enhancements. Microtripsy, a new histotripsy approach, has been investigated as a non-invasive, drug-free, and image-guided method that uses ultrasound to break up clots with improved treatment accuracy and a lower risk of vessel damage when compared to the traditional histotripsy thrombolysis approach. Unlike drug-mediated thrombolysis, which is dependent on the permeation of the thrombolytic agents into the clot, microtripsy controls acoustic cavitation to fractionate clots. We hypothesize that microtripsy thrombolysis is effective on retracted clots and that the treatment efficacy can be enhanced using strategies incorporating electronic focal steering. To test our hypothesis, retracted clots were prepared in vitro and the mechanical properties were quantitatively characterized. Microtripsy thrombolysis was applied on the retracted clots in an in vitro flow model using three different strategies: single-focus, electronically-steered multi-focus, and a dual-pass multi-focus strategy. Results show that microtripsy was used to successfully generate a flow channel through the retracted clot and the flow was restored. The multi-focus and the dual-pass treatments incorporating the electronic focal steering significantly increased the recanalized flow channel size compared to the single-focus treatments. The dual-pass treatments achieved a restored flow rate up to 324 mL/min without cavitation contacting the vessel wall. The clot debris particles generated from microtripsy thrombolysis remained within the safe range. The results in this study show the potential of microtripsy thrombolysis for retracted clot recanalization with the enhancement of electronic focal steering.
Keywords: Thrombolysis, Sonothrombolysis, Histotripsy, Retracted Clot, Tissue Elasticity
Introduction
Thrombosis is the formation of a blood clot in the cardiovascular system that prevents blood from circulating. Arterial thrombosis in the cerebral vasculature leads to ischemic stroke, which is a leading cause of disability and death in the United States (Mozaffarian et al. 2015). The most common form of venous thrombosis is deep vein thrombosis (DVT), which occurs predominantly in the legs and can sometimes lead to lethal pulmonary embolism (PE). DVT/PE (also called venous thromboembolism) affects over 300,000 people and causes deaths of 60,000 to 100,000 each year in the United States (Beckman et al. 2010). Patients with more extensive thrombosis sometimes require thrombolytic treatments. The current gold standard of thrombolytic treatment involves the infusion of thrombolytic drugs such as tissue plasminogen activator (tPA) (Adams et al. 1996; Bates and Ginsberg 2004). Systemic administration of thrombolytic drugs has limited effectiveness with long treatment time (several hours to days) and is associated with a high risk of major bleeding (Friedman et al. 1996). Catheter-directed thrombolysis has the advantage over systemic thrombolysis through local application at the thrombosis site, but it is invasive and carries the risks of bleeding, vascular damage, and infections (Sharafuddin et al. 2003; Lauw and Büller 2014).
Ultrasound has been investigated as a tool to enhance or induce thrombolysis for several decades (Siegel and Luo 2008). Significant efforts have been focused on enhancing the efficacy of thrombolytic drugs using ultrasound (Larsson et al. 1998; Pfaffenberger et al. 2003; Frenkel et al. 2006; Stone et al. 2007; Holland et al. 2008; Hitchcock et al. 2011), with several clinical trials showing promising results (Alexandrov et al. 2004; Molina et al. 2009; Tsivgoulis et al. 2010). In addition, ultrasound combined with microbubbles has been demonstrated to successfully augment clot dissolution in the presence or absence of thrombolytic drugs (Datta et al. 2008; Meairs and Culp 2009; Brown et al. 2011; Culp et al. 2011; Laing et al. 2012). Ultrasound has also been studied as a stand-alone thrombolysis method under approaches utilizing acoustic cavitation (Rosenschein et al. 2000; Maxwell et al. 2009; Maxwell et al. 2011a; Burgess et al. 2012; Wright et al. 2012; Zhang et al. 2015a; Zhang et al. 2015c).
Histotripsy is a non-thermal tissue ablation method that mechanically fractionates soft tissue via well-controlled acoustic cavitation generated by microsecond-long, high-pressure ultrasound pulses (Xu et al. 2007; Xu et al. 2008; Xu et al. 2010). The potential of using histotripsy as a non-invasive, drug-free, and image-guided thrombolysis method was demonstrated both in vitro and in vivo by Maxwell et al (Maxwell et al. 2009; Maxwell et al. 2011a). Multi-cycle (usually ≥ 5 cycles) ultrasound pulses were used in those studies to generate cavitation bubble clouds via a shock scattering mechanism (Maxwell et al. 2011b). A new histotripsy approach, termed microtripsy, has been recently investigated for thrombolysis application to improve treatment precision and avoid potential vessel damage (Zhang et al. 2015a; Zhang et al. 2015b; Zhang et al. 2015c). In microtripsy, a cavitation cloud is initiated via a single-cycle ultrasound pulse with only one high, negative pressure phase exceeding a very distinct negative pressure intrinsic threshold of the medium (Maxwell et al. 2013; Lin et al. 2014). The location and size of the cavitation cloud generated using microtripsy through the intrinsic threshold mechanism is more reproducible and predictable than the shock scattering mechanism (Maxwell et al. 2013; Lin et al. 2014). In those microtripsy thrombolysis studies, cavitation was precisely generated and confined in the vessel lumen without contacting the vessel wall, allowing for a precise flow channel to be created within the clot while minimizing the risk of vessel damage (Zhang et al. 2015c).
Previous studies showed that drug-mediated thrombolysis, including ultrasound-enhanced thrombolysis, was difficult to achieve with retracted clots (Blinc et al. 1992; Kunitada et al. 1992; Sutton et al. 2013). As a clot is formed, clot retraction initiated by platelets occurs and changes the structure and composition of the clot remarkably as it ages over time (Fox and Phillips 1983; Feghhi and Sniadecki 2011). In the clot retraction process, the fibrin network shrinks and effectively increases fibrin density per unit of clot volume and/or decreasing plasminogen concentration, and results in lower porosity and reduced permeability (Carr and Hardin 1987; Blinc et al. 1994; Kirchhof et al. 2003). The high resistance of retracted clots to drug-mediated thrombolysis is believed to be due to the reduced permeability of the retracted clot to the thrombolytic agents.
Unlike drug-mediated thrombolysis that depends on the permeation of thrombolytic agents into the clot, microtripsy fractionates clots by controlled cavitation. In the previous microtripsy thrombolysis study, a fast lysis rate was achieved with unretracted clots. Retracted clots are stiffer than unretracted clots and are expected to be more resistant to histotripsy-induced cavitation and fractionation (Vlaisavljevich et al. 2014; Vlaisavljevich et al. 2015) We hypothesize that microtripsy is effective to treat retracted clots, but with reduced treatment efficacy compared to unretracted clots. We further hypothesize that the treatment efficacy for retracted clots can be enhanced using treatment strategies incorporating electronic focal steering. By using a phased-array transducer with electronic focal steering capability, the treatment focus can be steered to enlarge the flow channel through the retracted clot without additional mechanical movements of the therapy transducer. These hypotheses are tested in this paper by investigating the treatment efficacy of microtripsy thrombolysis on retracted clots and exploring efficacies of different microtripsy thrombolysis strategies incorporating electrical focal steering. Retracted clots were prepared in vitro following a protocol described by Sutton et al (Sutton et al. 2013), and their elasticity was characterized quantitatively. The retracted clots were treated in an in vitro flow model using three different strategies: single-focus strategy, electronically-steered multi-focus strategy and a dual-pass multi-focus strategy. After treatments, the generated flow channels were 3D-scanned using a 20 MHz ultrasound imaging probe, and the sizes of the flow channels were quantified. The restored flow and the distribution of generated clot debris particles were also measured. The treatment results of retracted clots were compared with those of the unretracted clots from a previous study. The treatment efficacies using three different microtripsy thrombolysis strategies were also compared side by side.
Materials and Methods
Flow Model
An in vitro flow model, which has been described previously (Zhang et al. 2015a; Zhang et al. 2015c), was deployed in this study. The flow model was designed to mimic the condition of occlusive venous thrombosis, where blood flow is completely blocked by the thrombus but blood pressure still applies. A saline reservoir, a pressure sensor, a vessel phantom, a filter, and a fluid collector were connected in sequence with silicone tubing (Masterflex L/S 17; Cole-Parmer, Vernon Hills, IL, USA) (Figure 1). The saline reservoir was placed higher than the rest of the system for perfusion under gravity-driven pressure. With an occlusive thrombus fixed inside, the vessel phantom was mounted horizontally in a tank filled with degassed water. The height difference between the saline level in the reservoir and the vessel phantom was set to apply a constant pressure of 3.7 mm Hg, which was measured by the pressure sensor (MG-9V; SSI Technologies, Janesville, WI, USA). A pressure of 3.7 mm Hg was chosen according to reported femoral vein pressure (Negus and Cockett 1967; Albrechtsson et al. 1981). The femoral vein in the upper leg is where DVT often occurs. The therapy transducer was positioned inside the tank facing the vessel phantom to conduct the microtripsy recanalization treatment. When a channel was generated through the clot, the restored flow, together with clot debris particles generated from the treatment, was passed through the filter, and the filtered fluid was collected for further small particle analysis.
Figure 1.
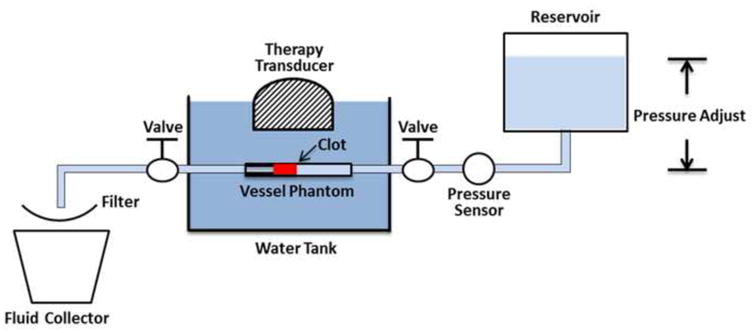
Schematic diagram of the in vitro flow model.
The vessel phantom was developed in-house to mimic a human femoral vein (Figure 2). It was made from urethane polymer (Urethane RTV Mold-Making System; Tap Plastics Inc., San Leandro, CA, USA), which has acoustic properties similar to human tissue (Browne et al. 2003). The vessel phantom had an 8 mm outer diameter, a 6.5 mm inner diameter on one side, and a 4.2 mm inner diameter (35% stenosis) on the other side. The method of making the vessel phantom has been described previously in detail (Zhang et al. 2015c). The 6.5 mm inner diameter was chosen according to reported DVT vein diameters (5 to 21.7 mm) (Hertzberg et al. 1997). The stenosis in this in vitro setup stabilized the clot and prevented it from flowing away during the treatment under pressure. The vessel phantom was held by a 3D-printed frame with tube fittings at the two ends to connect the vessel in-line with the rest of the flow model (Park et al. 2013).
Figure 2.
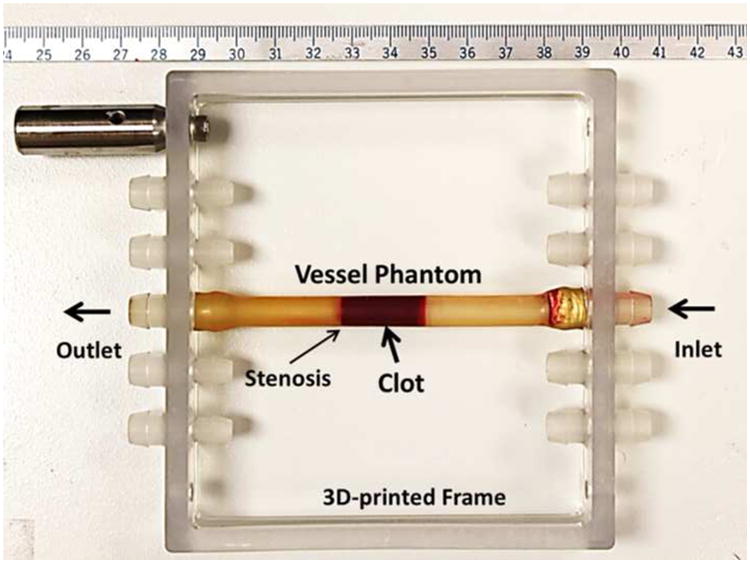
The vessel phantom was held by a 3D-printed frame and could be easily connected in line with the flow model using tubing fittings. A 35% stenosis in the vessel phantom was used to stabilize the clot so that it did not slip under pressure. The inner diameter was 4.2 mm on the downstream side of the stenosis and 6.5 mm on the upstream side. A clot was inserted to the upstream side of the stenosis as shown in the figure.
Retracted Clot Formation
Retracted clots were formed following a protocol similar to that described by Sutton (Sutton et al. 2013). Fresh bovine blood was collected from a local abattoir. A citrate-phosphate-dextrose (CPD) solution (#C7165; Sigma-Aldrich Co., St. Louis, MO, USA) was immediately mixed with fresh bovine blood as an anti-coagulant at a ratio of 1 mL CPD per 9 mL blood. All the blood samples were used within the same day as they were collected. The bovine blood was first warmed up to the normal cow body temperature (38.6 °C). To stimulate the clotting cascade, calcium chloride (#21107; Sigma-Aldrich Co., St. Louis, MO, USA) was injected into the blood to a final concentration of 20 mM/L. To form a retracted clot, the stimulated blood (6.5 mL) was carefully poured into a hydrophilic glass tube (Borosilicate Glass Tubing, GSC International Inc., Nixa, MO, USA) with an inner diameter of 8.5 mm. After 3 hours in a water bath at 38.6 °C, the tube with newly formed clot inside was moved into refrigeration and stored at 4°C for 7 days to allow for retraction.
After the 7-day incubation, the clot shrank and translucent serum was separated from the clot (Figure 3). The degree of clot retraction was quantified by measuring the serum volume left after taking out the retracted clot (Macfarlane 1939). To ensure a reasonable consistency in degree of retraction, a retracted clot was selected to use only if its serum volume was within a range from 3 to 3.2 mL. The qualified clot usually had a diameter around 6.5 mm and a length around 10 cm. The 10-cm long clot was cut into 2-cm length clots for individual experiments. Prior to each experiment, three steps were followed to place and fix the clot inside the vessel phantom. First, the clot was warmed up to 38.6 °C in fresh bovine blood. Second, the bovine blood with the clot inside was stimulated by calcium chloride with a final concentration of 20 mM/L. Third, the clot with the stimulated blood coating was inserted into the vessel phantom from the 6.5 mm inner-diameter side all the way to the stenosis side. The vessel phantom was then placed in a water bath at 38.6 °C, and after 2 hours the blood coating clotted and cross-linked the retracted clot to the interior of the vessel phantom like glue. The vessel phantom with the clot fixed inside was then connected in-line with the rest of the flow model and the connecting tubes were refilled with saline.
Figure 3.
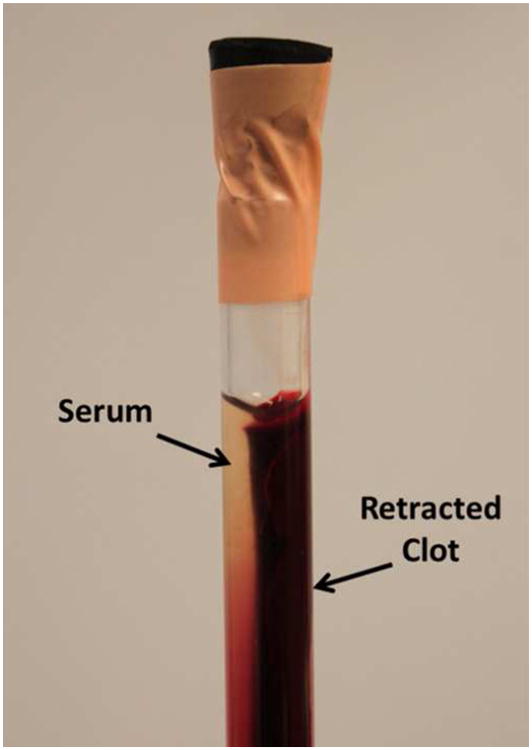
A clot was retracted in a hydrophilic glass tube after 7 days in 4°C incubation. The serum extruded from the clot can be clearly distinguished.
Therapy System
An integrated, portable, ultrasound image-guided microtripsy thrombolysis system was developed in our laboratory (Figure 4). It includes three subsystems: a microtripsy therapy system, an ultrasound imaging system, and a positioning system. The microtripsy therapy subsystem used a 1-MHz 18-element therapy transducer manufactured by Imasonic S.A. (Besancon, France) (Figure 4). The transducer had an effective 9.8 cm (lateral) × 8 cm (elevational) aperture and a 7 cm focal length. It was driven by a pulse amplifier developed in-house to generate very short (< 2 cycles), high-pressure ultrasound pulses. The focal beam volume (−6 dB) of the transducer was measured to be 6.5 mm (axial) × 1.3 mm (lateral) × 1.5 mm (elevational) at a peak negative pressure of 15 MPa using a fiber-optic probe hydrophone (FOPH) (Parsons et al. 2006). Peak negative pressures larger than 20 MPa cannot be directly measured and therefore was estimated by linear summation (P(-)LS) of the peak negative pressure outputs from 3 separate groups of the transducer elements (6 elements per group). The imaging subsystem was developed based on an Ultrasonix imaging machine (SonixTouch; Analogic Ultrasound, Vancouver, Canada). A custom ultrasound imaging probe with compact rectangular housing (L7.5MHz; Vermon, France) was embedded into the central hole of the therapy transducer to guide and monitor microtripsy thrombolysis treatment. The positioning subsystem included a multi-positioning arm and a compact motorized positioner at the end of the arm. The therapy transducer was mounted on the compact positioner. With 6 degrees of freedom and a range around 1 meter, the multi-positioning arm can be manually moved and held using a press/release lock for coarse target localization. With 3 degrees of freedom and a range of 10 cm × 5 cm × 4 cm, the motorized positioner was controlled by both software and joy sticks for much finer localization with a resolution of 0.1 mm. Control software was developed to manage and coordinate the therapy, imaging, and positioning subsystems.
Figure 4.

The integrated microtripsy thrombolysis system is shown in the left picture. It consists of an ultrasound imaging system, a microtripsy therapy system, and a motorized positioning system. The ultrasound therapy transducer is shown in the middle. A linear imaging probe was embedded at the center of the therapy transducer. The arrangement of the 18 elements in the therapy transducer is illustrated in the right picture. (A = Axial, L = Lateral and E = Elevational)
Pre-treatment Planning
Pre-treatment planning was performed prior to each treatment. First, using the multi-positioning arm, the therapy transducer was manually placed above the vessel phantom. The lateral axis of the transducer was oriented perpendicular to the vessel phantom so that the cross section of vessel and clot were imaged during treatment. Second, cavitation was generated in water, and the center of the hyperechoic cavitation region on the ultrasound imaging window was marked as the geometric focus of the transducer. Third, guided by ultrasound imaging, the therapy transducer was moved using the motorized positioner to align the geometric focus at the center of vessel lumen. The transducer was then moved to scan the focus from one end of the clot (close to the pressure reservoir) to the other end (close to the stenosis side). Several locations (spaced around 3 mm) along the scan path were recorded. Fourth, after these locations registered, the control software linearly interpolated these key locations into a scan path of denser treatment locations with a fixed scan interval (SI).
Treatment Strategies
For each treatment, the treatment zone was scanned following the preset treatment path. The therapy system applied a fixed number of microtripsy pulses (doses) at each scan location before moving automatically to the next location. A 1.5-cycle pulse with only one high negative pressure phase and an estimated peak negative pressure (P(-)LS) of 30 MPa was used in this study, as this pressure level was shown to create precise flow channels in our previous microtripsy thrombolysis study (Zhang et al. 2015c). An example waveform of microtripsy pulse is shown in Figure 5. Real-time B-mode ultrasound imaging was used to monitor microtripsy. The cavitation bubble cloud could be clearly distinguished as a bright dynamic region with ultrasound imaging. The ultrasound therapy transducer was moved by step motors to scan the cavitation bubble cloud along the preset treatment path. If the cavitation cloud was slightly off the center of the vessel lumen during the treatment scan according to the real-time ultrasound B-mode image, the location of cavitation bubble cloud was finely adjusted using joysticks to move it back to the center of the vessel lumen. Three treatment strategies were used: single-focus strategy, electronically-steered multi-focus strategy and dual-pass multi-focus strategy. In the following text, they are termed “single-focus”, “multi-focus” and “dual-pass” for short. A pulse repetition frequency (PRF) of 100 Hz was used in all the three strategies, and therefore the energies delivered per second by the three strategies were the same.
Figure 5.
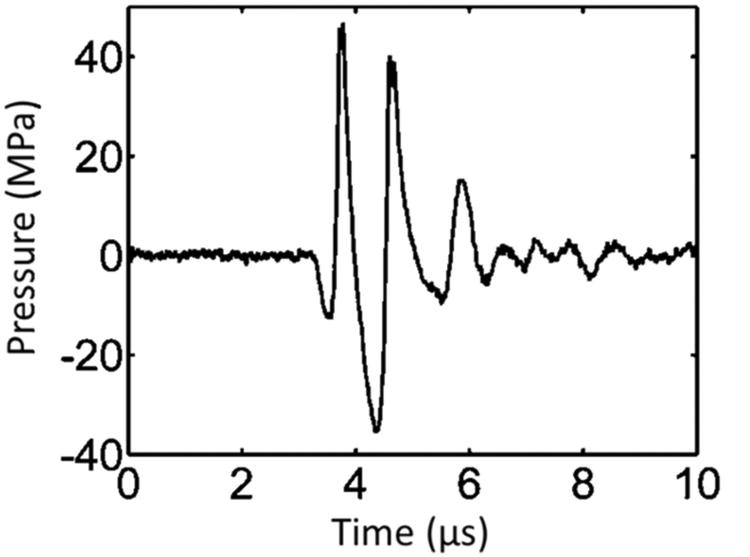
Pressure waveform of a microtripsy pulse. Because peak negative pressure larger than 20 MPa cannot be directly measured, this waveform was estimated by linearly summing the directly-measured waveforms from 6 separate element groups (3 adjacent elements per group).
The single-focus strategy has been used in all the previous microtripsy thrombolysis studies (Zhang et al. 2015a; Zhang et al. 2015c). At each scan location, the treatment zone was only covered by the geometric focus of the therapy transducer (Figure 6). Five groups were treated using the single-focus strategy: four of them used different doses (100, 200, 600, and 1000 pulses) per scan location with a scan interval of 0.3 mm; the other group used a dose of 500 pulses with a scan interval of 0.15 mm. Four clots were treated in each group. The treatment time of each group can be calculated based on the PRF, dose, and scan interval used. The treatment group with the smaller SI (0.15 mm) and the 500-pulse dose was included in this study to see if a finer scan interval can improve the treatment efficacy compared to the groups with the same treatment time. Table 1 summarizes the parameters used for all treatment groups.
Figure 6.
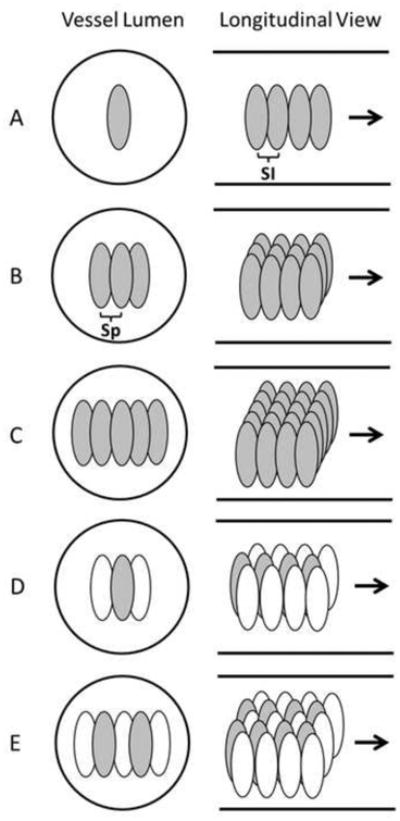
Schematic diagrams of the three treatment strategies in the vessel phantom, with the solid lines outlined the inner vessel lumen. The ellipses in the vessel lumen represent the treatment foci. A illustrates the single-focus strategy. B and C illustrate the 3 foci and 5 foci multi-focus strategies, respectively. D and E illustrate the 1+2 foci and 2+3 foci dual-pass strategies, respectively. In D and E, the gray foci were treated in the first treatment pass and the white foci were treated in the second treatment pass. (SI = Scan Interval, Sp = Separation between foci).
Table 1. Treatment Plan.
| Group | Strategy | # of Foci | PRF (Hz) | Dose (# of pulses) | SI (mm) | Focal Separation (mm) | Treatment Time (min/cm) |
|---|---|---|---|---|---|---|---|
| 1 | Single-focus | 1 | 100 | 100 | 0.3 | / | 0.55 |
| 2 | 1 | 100 | 200 | 0.3 | / | 1.1 | |
| 3 | 1 | 100 | 600 | 0.3 | / | 3.3 | |
| 4 | 1 | 100 | 1000 | 0.3 | / | 5.5 | |
| 5 | 1 | 100 | 500 | 0.15 | / | 5.5 | |
| 6 | Multi-focus | 3 | 100* | 200** | 0.3 | 0.5 | 3.3 |
| 7 | 5 | 100* | 200** | 0.3 | 0.5 | 5.5 | |
| 8 | Dual-pass | 1+2 | 100* | 200** | 0.3 | 0.5 | 3.3 |
| 9 | 2+3 | 100* | 200** | 0.3 | 0.5 | 5.5 |
Frequency from pulse to pulse.
Pulses per focus per treatment location.
Using the multi-focus strategy, the treatment zone at each scan location was covered with multiple foci by electronically steering the focus of the therapy transducer in the lateral direction (Figure 6). This multiple foci strategy was expected to widen the generated flow channel. The steering of the focus alternatively at different treatment foci was also designed to reduce cavitation memory effects at each treatment focus to increase the clot fractionation rate per pulse. The previous study shows that residual nuclei from the previous pulse at the same or nearby location can last for a few hundred milliseconds (cavitation memory effects) and may negatively impact the treatment efficacy when the subsequent pulse arrived before the residual nuclei dissolve (Wang et al. 2012). Two groups were treated using this strategy: one with 3 treatment foci at each scan location and one with 5 treatment foci. A dose of 200 pulses, a scan interval of 0.3 mm and a separation of 0.5 mm between foci were used for both groups. The dose was defined as the number of microtripsy pulses applied at each treatment focus. The treatment times of the 3 foci and 5 foci multi-focus treatments were the same as those of the single-focus 600-pulse (3.3 min/cm) and 1000-pulse (5.5 min/cm) treatments, respectively. Four clots were treated in each group.
The dual-pass strategy essentially divided the multi-focus treatment into two treatment passes. The dual-pass strategy was developed to further address the concern of the cavitation memory effects. In the first pass, the treatment zone was scanned through the clot and covered by one focus or two foci at each scan location. In the second pass, the treatment zone was scanned through the clot again and covered by two or three additional foci, resulting in effective three or five foci treated at each scan location, respectively (termed “1+2” or “2+3” patterns) (Figure 6). The foci treated at each scan location within one pass were separated by 1 mm in the lateral direction without any overlapping of the cavitation zones between foci. The same treatment path was used for both passes but in the second pass the scan locations were shifted 0.15 mm along the length of the clot. A dose of 200 pulses, a scan interval of 0.3 mm, and a separation of 0.5 mm between the closest foci were used for both 1+2 foci and 2+3 foci dual-pass treatments. Because the motorized movement of the therapy transducer from one end of the clot to the other was very fast, the treatment times of the 1+2 foci and 2+3 foci dual-pass treatments were almost the same as the 3 foci (3.3 min/cm) and 5 foci (5.5 min/cm) multi-focus treatments. Four clots were treated in each group.
Elasticity and Porosity Measurements
The elasticity of the retracted clots was characterized to estimate its equivalent age in vivo and to compare with that of unretracted clots. A direct mechanical measurement method, previously described in detail by Xie (Xie et al. 2005), was adopted in this study to measure the Young's modulus of retracted and unretracted clots. The measurements were conducted using a desktop device named MicroElastometer (Artann Laboratories, Lamberville, NJ, USA), which measures the displacement vs. force while a test sample is subject to compression, and the Young's modulus of the sample is estimated based on the strain-stress relationship. The device consists of a step motor, a compression stamp, a sample plate, and a strain gauge. The step motor controls the compression stamp moving in the direction normal to the sample plate, and the compression force is measured by the strain gauge under the sample plate. The minimum travel distance of the stamp is 3 μm and the measurable force range is up to 2 N with a precision of 0.1 mN. Before measurement, the retracted clot was warmed up to room temperature (25 °C) after it was stored in 4 °C for 7 days and cut into 2 cm cylindrical samples (∼ 6.5 mm diameter) for the elastic measurements. The axis of the cylindrical sample was positioned perpendicularly to the long side of the stamp. During measurement, the position of the stamp and the force reading was recorded in real-time by its software, and the Young's modulus was estimated right after the measurement. The detailed algorithm and calculation can be found in the paper by Xie (Xie et al. 2005). The unretracted clots were prepared following the method described previously (Zhang et al. 2015c), and their elasticity were measured using the same protocol as the retracted clots. Ten samples were measured for each clot type. Qualitative and quantitative histological evaluations on porosity (4 samples for each clot type) were conducted following the protocol described by Sutton et al (Sutton et al. 2013).
Flow Channel Measurement
To quantitatively evaluate the flow channels generated using the different microtripsy strategies, each treated clot was scanned using a 20 MHz high-resolution ultrasound probe. The probe was separately mounted onto the motorized positioner before scanning. With the imaging plane perpendicular to the vessel axis, the probe was moved by the positioner from one end to the other end of the clot with a step size of 0.1 mm. One cross-sectional image of the clot was taken after waiting for 2 seconds at each location to allow for image stabilization. 200 scan images were collected in total from each treated clot. Because the fractionated clot region was hypoechoic (low brightness on image) when the flow was restored, in comparison to the hyperechoic (high brightness on image) intact clot region, we applied an intensity threshold to detect the cross section of flow channel on each scan image. Inside the vessel lumen on each scan image, the area with pixel intensity less than 20 (0-255 overall range) was thresholded out as the cross section of the flow channel. The value of 20 was selected according to the intensity histogram of the scan images. To quantify the size of flow channel, the cross-sectional area (Across) of the flow channel region was calculated.
Restored Flow Measurement
Restored flow rate was measured to evaluate the recanalization effectiveness using the different treatment strategies. After the flow channel was created, the volume of downstream saline in the fluid collector within 1 minute was measured. When the flow was very slow, the restored saline was collected for 5 minutes. The restored volume flow rate was then calculated as the volume of the saline collected divided by the time. Due to the brevity of the time period and the small change in reservoir volume, the pressure was assumed to be constant over this time period. A control measurement with no blockage in the flow system was also conducted to compare with the restored flow rate.
Debris Measurement
A method combining macroscopic inspection and Coulter counter analysis was utilized to measure clot debris particle size distribution generated during the treatments. When flow was restored, clot debris was flushed by the restored flow and filtered by a filter sheet with a pore size of 300 μm. Macroscopic inspection was conducted to check for debris particles that may have been trapped on the 300 μm filter. Optical images with a resolution of 20 μm were taken of the filter sheet. The number of distinguishable particles larger than 300 μm was counted and the sizes of individual large debris particles were measured. The filtered fluid with suspended debris particles smaller than 300 μm was then analyzed using a Coulter counter (Multisizer 3; Beckman Coulter, Brea, CA, USA). The measurable range of particles was from 3 to 60 μm using a 100-μm aperture tube and from 60 to 300 μm using a 560-μm aperture tube (Coulter 2000). The measurements using these two aperture tubes were combined to generate a distribution of debris particles from 3 to 300 μm.
Results
Elasticity and Porosity of Retracted and Unretracted Clot
One representative retracted clot after the 7-day incubation is shown in Figure 7. The unretracted clots and the retracted clots were measured to have Young's moduli of 2.31 ± 2.05 kPa (N = 10) and 11.12 ± 1.41 kPa (N = 10), respectively. The retracted clots had a much higher stiffness than the unretracted ones. The Young's moduli of clots at different ages in a rat model were measured ex vivo using the same mechanical method by Xie (Xie et al. 2005). According to their results, the Young's modulus of the retracted clots measured in this study fell between those of the 3-day-old in vivo clots (9.46 ± 0.87 kPa) and the 6-day-old in vivo clots (17.40 ± 5.77 kPa) in the rats, which is when it was expected for the clots to transition from acute phase to chronic phase. This is similar to human clots of 2 weeks of age (Xie et al. 2005). Histology sections showed consistent difference in porosity between the two clot types, similar to those reported by Sutton (Figure 8). Intracellular spacing in retracted clots and unretracted clots were measured to be 0.23 ± 0.20 % and 3.31 ± 1.06 %, respectively. Significant difference was shown by one-sided t-test (P<0.01). The porosity of the retracted clots in this study was lower than what was reported by Sutton et al., indicating that these clots were even more retracted.
Figure 7.
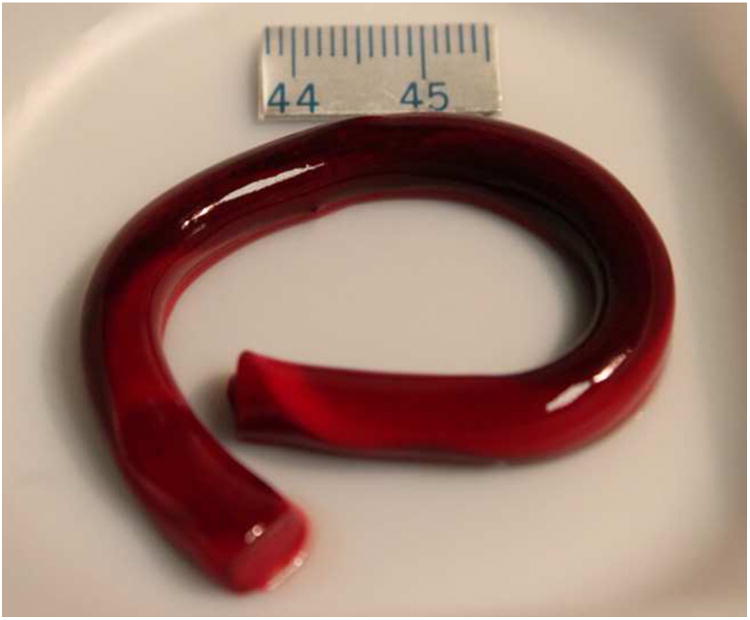
One long retracted clot separated from the serum before being cut into 2-cm segments.
Figure 8.
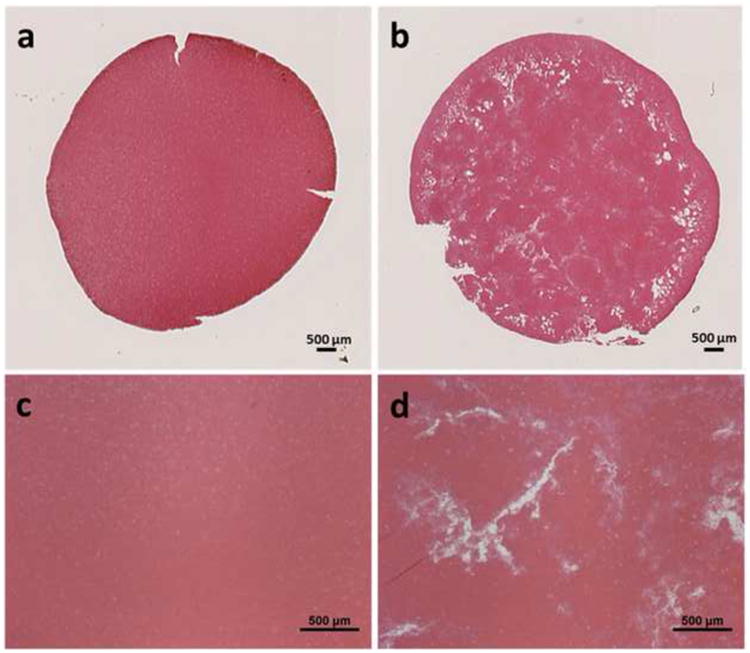
Representative histology sections of retracted (left) and unretracted (right) clots showing a cross section (a, b) and 4× magnification (c, d). Stain: Hematoxylin and Eosin.
Comparison with Unretracted Clot
Microtripsy was effective in treating retracted clots, but the flow channel generated using a single-focus method was significantly smaller than the flow channel formed through unretracted clots. A flow channel was generated through the retracted clot using the single-focus strategy even with a 100-pulse dose. Figure 9 shows the representative cross-sectional ultrasound images of a treated, retracted clot in this study on the left and a treated, unretracted clot from a previous study on the right (Zhang et al. 2015a). The unretracted clots were treated using exactly the same treatment parameters as the 100-pulse single-focus treatment used on the retracted clots. The channels generated in the retracted clots were very small and hard to see from the high-resolution ultrasound scan images, whereas the channels in unretracted clots were large and clear. The mean Across of the channels generated in the retracted clots was 0.0232 ± 0.0506 mm2 (N = 4 × 200), which was about 200 times smaller than that in the unretracted clots (4.6532 ± 0.7761 mm2, N = 6 × 67).
Figure 9.
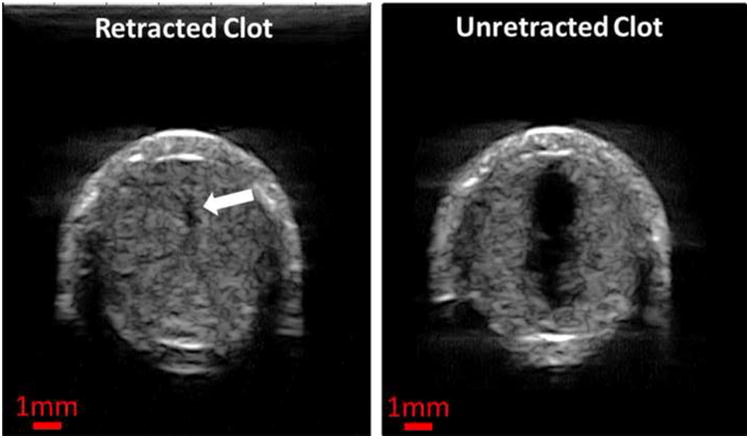
Representative ultrasound images of the cross sections of the flow channels generated using the single-focus strategy in one unretracted clot (left) and one retracted clot (right). The exact same treatment parameters (30 MPa P(-)LS , 0.3 mm Scan Interval and 100 pulses per treatment location) were used in both cases. The generated flow channels show as the hypoechoic zones inside clots (indicated by the block arrow in the left image). Therapeutic ultrasound propagated from the top to the bottom of the images.
Single-focus Treatments
Using the single-focus strategy, a flow channel was successfully generated through retracted clots with all the microtripsy parameters tested. The size of the flow channel increased with increasing dose. The representative scan images of the channels generated by the five treatment groups using the single-focus strategy are shown in Figure 10. As the dose increased from 100 to 1000 pulses, the channels generated using the same 0.3-mm SI became larger (first four images), and the mean Across of the channels increased from 0.02 to 1.11 mm2 (Figure 11). The shape and boundary of the channels became clearer and sharper with the higher doses. The last image of Figure 10 shows a representative channel generated using the smaller 0.15-mm SI and the 500-pulse dose. The channels generated using the 1000-pulse dose and 0.3-mm SI were the largest among the single-focus treatments but the size was still small (1.1099 ± 0.2721 mm2) compared to the 6.5-mm inner-diameter vessel lumen. The Across of channels using the 0.15-mm SI and the 500-pulse dose (0.5269 ± 0.2391 mm2) were only half of those using the 0.3-mm SI and the 1000-pulse dose. This indicates that reducing SI does not improve the treatment efficacy under the same treatment time.
Figure 10.

Representative ultrasound images of the cross sections of the flow channels generated using the single-focus strategy with different doses. The last image shows the flow channel generated with a reduced scan interval (0.15 mm). The generated flow channels show as the hypoechoic zones inside clots (block arrows). Therapeutic ultrasound propagated from the top to the bottom of the images.
Figure 11.
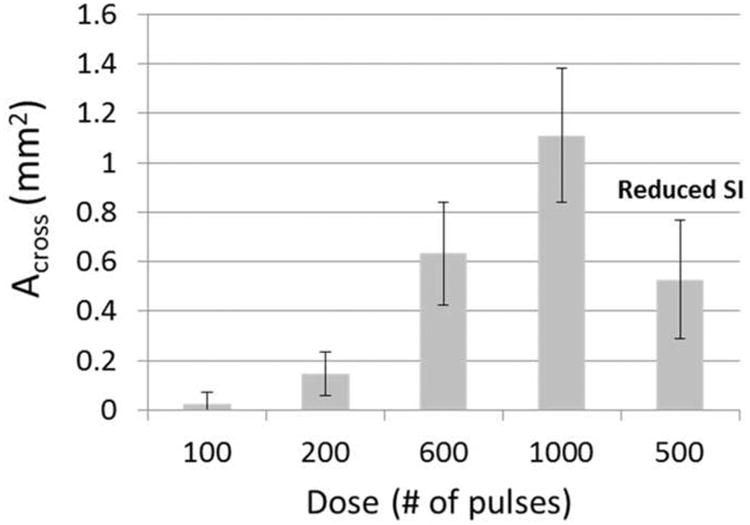
The mean cross-sectional area (Across) of the flow channels generated using the single-focus strategy with different doses. The last bar shows the flow channel generated with a reduced scan interval (SI = 0.15 mm). (N = 4 × 200).
Comparison of Three Strategies
A flow channel was generated through retracted clots using all three strategies tested (Figure 12). Under the same treatment time, microtripsy thrombolysis generated the largest flow channels using the dual-pass strategy and the smallest channels using the single-focus strategy. When comparing the single-focus strategy to the multi-focus strategy, the channel size was increased by 30% under the same 3.3 min/cm treatment time from 0.63 ± 0.21 mm2 to 0.82 ± 0.41 mm2, and the increase was 44% under the same 5.5 min/cm treatment time from 1.11 ± 0.27 mm2 to 1.60 ± 0.75 mm2 (Figure 13). When comparing the multi-focus strategy to the dual-pass strategy, the channel size was increased by 90% under the same 3.3 min/cm treatment time from 0.82 ± 0.41 mm2 to 1.55 ± 0.50 mm2, and under the same 5.5 min/cm treatment time the channel size increased by 160% from 1.60 ± 0.75 mm2 to 4.13 ± 1.09 mm2. Statistical analyses (one-sided Student's t-test) also supported these significant increases of channel size generated using the multi-focus vs. single-focus (P < 0.01) and dual-pass vs. multi-focus strategy (P < 0.001).
Figure 12.
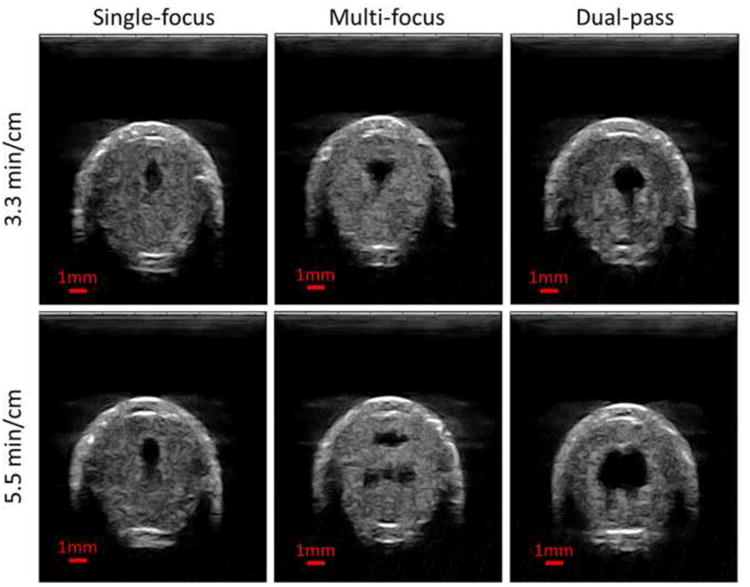
Representative ultrasound images of the cross sections of the flow channels generated using the single-focus strategy (left column), the multi-focus strategy (middle column) and the dual-pass strategy (right column). The treatment times were 3.3 min/cm in the upper row and 5.5 min/cm in the lower row. The generated flow channels show as the hypoechoic zones inside the clot. Therapeutic ultrasound propagated from the top to the bottom of the images.
Figure 13.
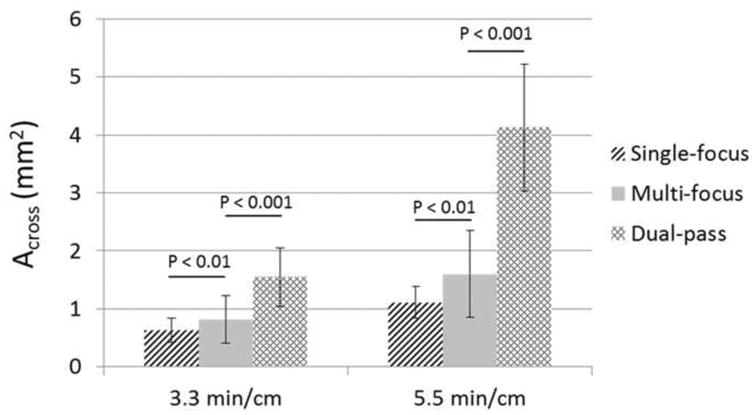
The mean cross-sectional area (Across) of the flow channels generated using the three strategies under the two treatment times (3.3 min/cm and 5.5 min/cm). (N = 4 × 200).
The shapes of the generated flow channels using the three strategies varied. Elliptical-shaped channels were generated using the single-focus strategy. The channels generated using the multi-focus strategy appeared to have two separate lesions with a horizontal orientation, as shown in Figure 12. When using the dual-pass treatment strategy, the channels had a more circular shape than those generated using the other two treatment strategies. With the 1+2 foci dual-pass treatment, one small tail appeared at one side of the circular channel. With the 2+3 foci dual-pass treatment, two tails appeared.
Restored Flow
Prior to any treatment, no flow was observed. After each treatment, flow was successfully restored even with the smallest channel created. Figure 14 shows the mean flow rate restored for the treatment groups presented in Figure 12. With constant pressure (3.7 mm Hg) applied, a larger channel would be expected to permit higher flow rate, which is confirmed by the restored channel cross-sectional area and flow rate results shown in Figures 13 and 14. The restored flow rate was highest when using the dual-pass strategy, while the lowest restored flow rate was generated using the single-focus strategy. The mean flow rate generated by the 2+3 foci treatments was 193.2 ± 47.5 mL/min (maximum at 324 mL/min), which was much higher than the other treatment groups. As a reference, the flow model with no blockage had a flow rate of 640 mL/min under the same 3.7-mmHg pressure.
Figure 14.
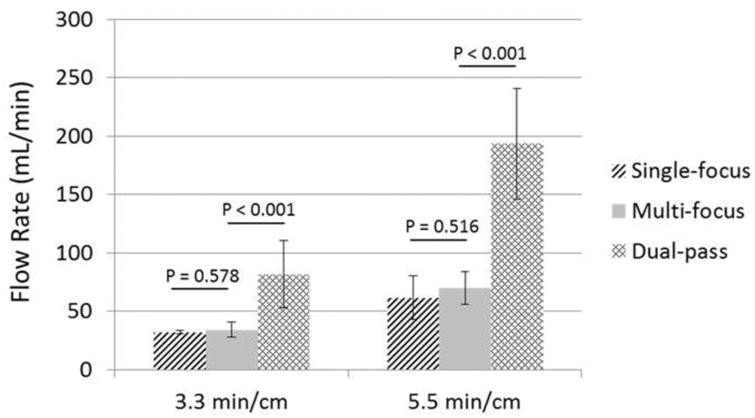
Restored flow rates of the three strategies under the two treatment times (3.3 min/cm and 5.5 min/cm). (N = 4).
Debris
The clot debris distribution was measured in the 600-pulse treatments, the 1000-pulse single-focus treatments, and the 1+2 foci and 2+3 foci dual-pass treatments. The debris size measurement was performed for four selected treatment groups instead of all groups due to the time-consuming nature of the measurement. The dual-pass treatment groups were selected because this strategy achieved the largest flow channel under the same treatment time (i.e., the highest treatment efficacy) among the three strategies. As a comparison and reference, the debris from the single-focus treatments under the same treatment time was measured. Theoretically, the debris generated from the single-focus treatments should be smaller than those using the other two strategies because the single-focus strategy used a three- or five-times higher dose at each treatment focus than the other two strategies, which was expected to break up the clot into smaller particles. For all measured treatments, over 99.9% of the debris particles were less than 10 μm, and the number of debris particles became orders of magnitude less as the size increased from 10 μm to 100 μm. Figure 15 shows the normalized mean distributions of clot debris from the four treatment groups. They all had a similar distributions centered at 4.2 μm, and the only difference was the number of debris particles. The debris particles larger than 100 μm generated using the two different treatment strategies were calculated and summarized in Table 2. In more than half of the treatments, no debris particles greater than 100 μm were observed. Only one debris particle (453 μm) was trapped on the 300-μm filter sheet in the total 24 measured treatments, and it was generated using the dual-pass strategy. In the treatments when particles between 100 and 300 μm were observed, only one or two such particles were observed for each treatment. Other than the single 453 μm particle mentioned above, the largest particle observed was 222.85 μm when using the single-focus strategy and 189.75 μm when using the dual-pass strategy.
Figure 15.
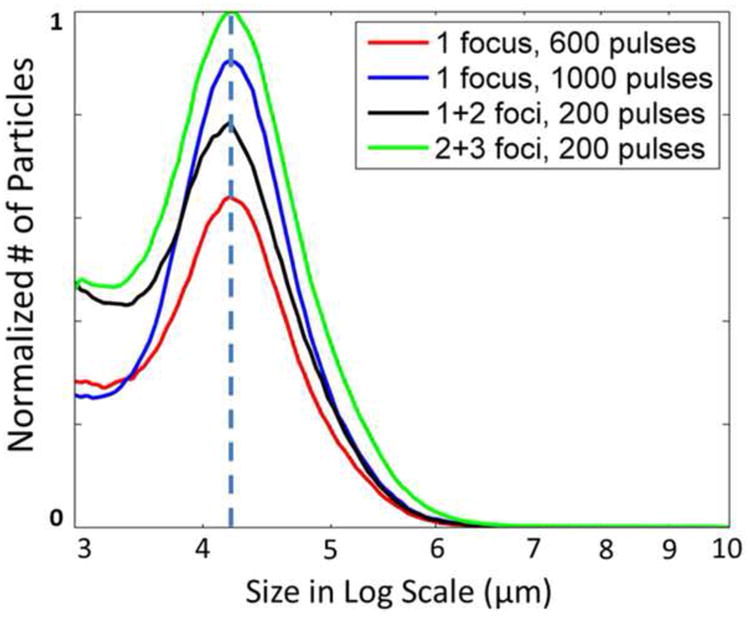
The mean distributions of debris particles (3 to 10 μm) generated using the single-focus and dual-pass strategies (N = 4 × 9). The volumes of the fluids collected from the restored flows were recorded in all the treatments. And the volumes used for Coulter Counter measurements were recorded as well. With this information, the number of the debris particles was first converted to unit volume (mL) for each treatment. Then the mean distributions for each treatment strategy were calculated and normalized by the maximal peak among the mean distributions.
Table 2. Summary of the generated debris larger than 100 μm using the single-focus and dual-pass strategies.
| Single-focus Treatments | Dual-pass Treatments | |
|---|---|---|
| Treatments with particles >100 μm | 3 out of 8 | 4 out of 8 |
| Average No. of particles >100 μm | 1.67 | 1.1 |
| Average Size of particles between 100 and 300 μm | 117.57 μm | 125.72 μm |
| Maximal Particle Size <300 μm | 222.85 μm | 189.75 μm |
| Particles >300 μm | None | 1 (453 μm) |
Discussion
Drug-based thrombolysis methods, including ultrasound-enhanced thrombolysis, have low efficacy for retracted clots or aged clots with low permeability (Carr and Hardin 1987; Blinc et al. 1992; Kunitada et al. 1992; Blinc et al. 1994; Kirchhof et al. 2003; Sutton et al. 2013). The 7-day retracted clots used in this study have Young's moduli similar to the in vivo 3-6 day old rat clots, which were believed to turn from acute phase to chronic phase, similar to human clots of 2 weeks of age (Xie et al. 2005). The results from this study support our hypothesis that microtripsy thrombolysis remains effective for retracted clots, although the treatment efficacy is reduced. Flow channels were generated through all retracted clots when treated using microtripsy and restored flows were consistently observed. The reduced treatment efficacy of microtripsy thrombolysis matched the observations of a previous study by Vlaisavljevich et al, which showed decreased or no histotripsy fractionation for tissues of increased mechanical strength (Vlaisavljevich et al. 2014). Vlaisavljevich's study also showed that increasing tissue stiffness results in a significant decrease in cavitation bubble expansion, leading to reduced strain to tissue and increased resistance to histotripsy-induced tissue damage (Vlaisavljevich et al. 2015). Our elasticity measurement indicates a 5-times higher Young's modulus for retracted clots compared to unretracted clots. In addition, the retracted clots have a denser fibrin structure and less water, which increases the time needed for microtripsy to completely fractionate the increased number of fibrin fibers per unit volume.
The results from the multi-focus and dual-pass treatments support the hypothesis that the microtripsy thrombolysis treatment efficacy for retracted clot can be enhanced by electronic focal steering. The multi-focus treatments showed a statistically significant improvement in channel size from the single-focus treatments. With the electronic focal steering, the treatment zone was covered by multiple cavitation foci. A wider flow channel and less required dose per focus were achieved by using the multi-foci strategy. From Table 3, we can see that the actual widths of channels generated by the multi-focus treatments matched closely with what we expected for both 3 foci and 5 foci cases. For example, with 5 foci side-by-side separated by 0.5 mm and each focus treated with 200 pulses, the flow channel generated by the multi-focus strategy was expected to be 2.45 mm in width (channel width of the 200-pulse single-focus strategy plus 4 times 0.5 mm separation, see Reference in Table 3). The actual width of the flow channels generated by the 5 foci multi-focus treatments was 2.41 mm, similar to the expected channel width. In comparison, the flow channel generated by the 1000-pulse single-focus strategy was only 1.11 mm wide. The height of the channel generated by multi-focus strategy was 2.00 mm, compared to 1.83 mm channel height generated by the 1000-pulse single-focus strategy. However in some treatments, two separate lesions were generated by the multi-focus strategy. The efficacy of the multi-focus strategy was lowered by this two-lesion pattern. Cavitation memory effects may be associated with the two-lesion pattern. As microtripsy pulses were applied with a 100 Hz PRF, a subsequent pulse arrived before the complete dissolution of the residual bubble nuclei from the previous cavitation. The cavitation bubble cloud generated at the proximal side of the focal region might prevent the incident acoustic energy from delivering to the zone right below the proximal cavitation site, forming two discontinuous cavitation clouds separated by a “dead” zone resulting in two separate lesions.
Table 3. Flow channel width and height.
| 3 Foci | 5 Foci | |||||
|---|---|---|---|---|---|---|
| Expected* | Multi-focus | Dual-pass | Expected ** | Multi-focus | Dual-pass | |
| Channel Width | 1.45 ± 0.21 | 1.39 ± 0.30 | 1.59 ± 0.32 | 2.45 ± 0.21 | 2.41 ± 0.39 | 2.78 ± 0.32 |
| Channel Height | 1.36 ± 0.24 | 1.66 ± 0. 37 | 2.68 ± 0.36 | 1.83 ± 0.23 | 2.00 ± 0.40 | 2.63 ± 0.34 |
For 3 foci, expected channel width = channel width by 200-pulse single-focus treatments (0.45 mm) + 2 × foci separation (0.5 mm); and expected channel height = channel width by 600-pulse single-focus treatments (1.36 mm).
For 5 foci, expected channel height = channel height by 200-pulse single-focus treatments (0.45 mm) + 4 × foci separation (0.5 mm); and expected channel height = channel height by 1000-pulse single-focus treatments (1.83 mm).
To further reduce the cavitation memory effects and eliminate the two-lesion pattern encountered in the multi-focus strategy, a dual-pass multi-focus strategy was investigated. With a larger effective separation (1 mm vs. 0.5 mm in the multi-focus strategy) between the steered foci within one treatment pass, the influence of the residual nuclei from the previous focus on the subsequent steered focus was reduced, which, in turn, helps fractionate the dead zone between the two lesions observed in the multi-focus treatments. In addition to reducing the cavitation memory effects, we hypothesize that the key to the dual-pass strategy is that the first treatment pass created “pilot” holes for the second pass. The pilot holes provided empty space and tissue-fluid interfaces for the cavitation in the second pass, and, therefore, resulted in more active cavitation bubble expansions, complete fractionation of the dead zone, and higher fractionation efficacy. The results show that the dual-pass treatments achieved the best thrombolysis outcomes among the three strategies under the same treatment time. The actual widths of channels generated by the dual-pass treatments were even larger than the expected channel width based on the focal separation and size of the lesion generated by the single-focus strategy and those generated by the multi-focus treatments. The mean Across of flow channel generated by the 2+3 foci dual-pass strategy was over two times larger than that by the 5 foci multi-focus strategy, and over three times larger than that by the 1000-pulse single-focus strategy.
The results in this study suggest that the dual-pass microtripsy thrombolysis could be an effective treatment option for in vivo chronic, retracted clots and possibly for other dense tissues, as the retracted clot is a good model for the chronic clot. Using this advanced treatment strategy, the in vitro retracted clots were recanalized successfully with a larger opening. Compared with the other two treatment strategies, the dual-pass treatments achieved much larger openings with the same treatment time. The treatment speed of our noninvasive microtripsy approach is faster compared to current thrombolysis approaches. The current clinical thrombolysis approaches include systemic thrombolytic drug infusion, catheter-directed thrombolysis (CDT), and percutaneous mechanical thrombectomy (PMT). The thrombolytic drug infusion and CDT treatments take from 24 to 56 hours (Goldhaber et al. 1990; Kim et al. 2006) and some PMT treatments can be done within 1 to 3 hours (Popuri and Vedantham 2011). For our approach, a retracted clot (chronic >14 days) with a length of 10 cm (Lip et al.) can be treated within 55 min. The treatment can be faster for unretracted clots (acute < 14days) (Zhang et al. 2015c) and with parameter optimization for retracted clots.
The debris particles generated from the dual-pass treatments were within the safe range and showed no significant difference from those of the single-focus treatments. The largest particle observed overall was 453 μm. In mechanical thrombectomy procedures, clot particles up to 1000 μm are generated and no severe embolism has been reported from human studies (Yasui et al. 1993; Uflacker et al. 1996; MÜLLER-HÜLSBECK et al. 2001). In addition, according to the morphometry of the pulmonary arterial system reported by Singhal et al. (Singhal et al. 1973), 500-μm-level particles may only obstruct one arteriole of order 9 which supplies only 0.016% of total capillary beds. The total number of debris particles larger than 100 μm from one dual-pass treatment was less than 20, which would not be expected to cause massive pulmonary embolism.
This study shows that microtripsy is effective for retracted clots and that electrical steering can enhance the treatment efficacy. Exploration of the effects of changing acoustic parameters, particularly PRF and pressure, is needed to further improve microtripsy thrombolysis. These parameters were not tested in this paper because our current setup limits the range of PRF and pressure for testing. Future work will be conducted in this direction to further improve the treatment efficacy. For example, increasing the treatment PRF has the potential to further shorten the treatment time under the same treatment dose if the cavitation memory effects can be reduced. Cavitation residual nuclei can be consolidated to reduce cavitation memory effects by interweaving low pressure ultrasound pulses with histotripsy pulses (Duryea et al. 2015). Another possible investigation to further reduce cavitation memory effects would be to divide the treatment into more than two treatment passes. Increasing the peak negative pressure can enlarge the lesion size (Lin et al. 2014; Vlaisavljevich et al. 2015; Zhang et al. 2015c) and will be investigated with microtripsy.
Conclusion
After each treatment, regardless of the treatment strategy, a flow channel was successfully generated through the retracted clot and flow was restored. Although the treatment efficacy of the single-focus treatment on retracted clot was reduced, both the multi-focus and the dual-pass treatments incorporating the electronic focal steering showed significant improvements in recanalized channel size when compared to the single-focus treatments. Under the 5.5 min/cm treatment time, the channels generated by the single-focus, multi-focus, and dual-pass treatment had cross-sectional areas of 1.11 ± 0.27 mm2, 1.60 ± 0.75 mm2, and 4.13 ± 1.09 mm2, respectively. The restored flow rate for the dual-pass treatment was 193.25 ± 47.51 mL/min (max 324 mL/min). The debris generated during the dual-pass treatments remained within a safe range. The results in this study show the potential of microtripsy thrombolysis for retracted clot recanalization with the enhancement of electronic focal steering and dual-pass strategy. Due to the much larger flow channels generated with no extra treatment time, the dual-pass treatments were shown to be the most clinically practical and effective among the three strategies.
Acknowledgments
This work is supported by grants from the NIH National Institute of Biomedical Imaging and Bioengineering under Award R01 EB008998, National Institute of Neurological Disorders and Stroke under Award R21 NS093121, and the Focused Ultrasound Foundation.
Footnotes
Publisher's Disclaimer: This is a PDF file of an unedited manuscript that has been accepted for publication. As a service to our customers we are providing this early version of the manuscript. The manuscript will undergo copyediting, typesetting, and review of the resulting proof before it is published in its final citable form. Please note that during the production process errors may be discovered which could affect the content, and all legal disclaimers that apply to the journal pertain.
References
- Adams HP, Brott TG, Furlan AJ, Gomez CR, Grotta J, Helgason CM, Kwiatkowski T, Lyden PD, Marler JR, Torner J. Guidelines for thrombolytic therapy for acute stroke: a supplement to the guidelines for the management of patients with acute ischemic stroke a statement for healthcare professionals from a special writing group of the stroke council, American heart association. Circulation. 1996;94:1167–74. doi: 10.1161/01.cir.94.5.1167. [DOI] [PubMed] [Google Scholar]
- Albrechtsson U, Einarsson E, Eklöf B. Femoral vein pressure measurements for evaluation of venous function in patients with postthrombotic iliac veins. Cardiovascular and interventional radiology. 1981;4:43–50. doi: 10.1007/BF02552407. [DOI] [PubMed] [Google Scholar]
- Alexandrov AV, Molina CA, Grotta JC, Garami Z, Ford SR, Alvarez-Sabin J, Montaner J, Saqqur M, Demchuk AM, Moyé LA. Ultrasound-enhanced systemic thrombolysis for acute ischemic stroke. New England Journal of Medicine. 2004;351:2170–8. doi: 10.1056/NEJMoa041175. [DOI] [PubMed] [Google Scholar]
- Bates SM, Ginsberg JS. Treatment of deep-vein thrombosis. New England Journal of Medicine. 2004;351:268–77. doi: 10.1056/NEJMcp031676. [DOI] [PubMed] [Google Scholar]
- Beckman MG, Hooper WC, Critchley SE, Ortel TL. Venous thromboembolism: a public health concern. American journal of preventive medicine. 2010;38:S495–S501. doi: 10.1016/j.amepre.2009.12.017. [DOI] [PubMed] [Google Scholar]
- Blinc A, Keber D, Lahajnar G, Zupančič I, Zorec-Karlovšek M, Demsar F. Magnetic resonance imaging of retracted and nonretracted blood clots during fibrinolysis in vitro. Pathophysiology of Haemostasis and Thrombosis. 1992;22:195–201. doi: 10.1159/000216319. [DOI] [PubMed] [Google Scholar]
- Blinc A, Kennedy S, Bryant R, Marder V, Francis C. Flow through clots determines the rate and pattern of fibrinolysis. Thrombosis and haemostasis. 1994;71:230–5. [PubMed] [Google Scholar]
- Brown AT, Flores R, Hamilton E, Roberson PK, Borrelli MJ, Culp WC. Microbubbles improve sonothrombolysis in vitro and decrease hemorrhage in vivo in a rabbit stroke model. Investigative radiology. 2011;46 doi: 10.1097/RLI.0b013e318200757a. [DOI] [PMC free article] [PubMed] [Google Scholar]
- Browne J, Ramnarine K, Watson A, Hoskins P. Assessment of the acoustic properties of common tissue-mimicking test phantoms. Ultrasound in medicine & biology. 2003;29:1053–60. doi: 10.1016/s0301-5629(03)00053-x. [DOI] [PubMed] [Google Scholar]
- Burgess A, Huang Y, Waspe AC, Ganguly M, Goertz DE, Hynynen K. High-intensity focused ultrasound (HIFU) for dissolution of clots in a rabbit model of embolic stroke. PloS one. 2012;7:e42311. doi: 10.1371/journal.pone.0042311. [DOI] [PMC free article] [PubMed] [Google Scholar]
- Carr M, Hardin CL. Fibrin has larger pores when formed in the presence of erythrocytes. American Journal of Physiology-Heart and Circulatory Physiology. 1987;253:H1069–H73. doi: 10.1152/ajpheart.1987.253.5.H1069. [DOI] [PubMed] [Google Scholar]
- Coulter B. Coulter Counter Multisizer 3 User's Manual. Hialeah, Florida: Beckman Coulter Incorporated; 2000. [Google Scholar]
- Culp WC, Flores R, Brown AT, Lowery JD, Roberson PK, Hennings LJ, Woods SD, Hatton JH, Culp BC, Skinner RD. Successful microbubble sonothrombolysis without tissue-type plasminogen activator in a rabbit model of acute ischemic stroke. Stroke. 2011;42:2280–5. doi: 10.1161/STROKEAHA.110.607150. [DOI] [PMC free article] [PubMed] [Google Scholar]
- Datta S, Coussios CC, Ammi AY, Mast TD, de Courten-Myers GM, Holland CK. Ultrasound-enhanced thrombolysis using Definity® as a cavitation nucleation agent. Ultrasound in medicine & biology. 2008;34:1421–33. doi: 10.1016/j.ultrasmedbio.2008.01.016. [DOI] [PMC free article] [PubMed] [Google Scholar]
- Duryea AP, Tamaddoni HA, Cain CA, Roberts WW, Hall TL. Removal of residual nuclei following a cavitation event: a parametric study. Ultrasonics, Ferroelectrics, and Frequency Control, IEEE Transactions on. 2015;62:1605–14. doi: 10.1109/TUFFC.2014.006601. [DOI] [PMC free article] [PubMed] [Google Scholar]
- Feghhi S, Sniadecki NJ. Mechanobiology of platelets: techniques to study the role of fluid flow and platelet retraction forces at the micro-and nano-scale. International journal of molecular sciences. 2011;12:9009–30. doi: 10.3390/ijms12129009. [DOI] [PMC free article] [PubMed] [Google Scholar]
- Frenkel V, Oberoi J, Stone MJ, Park M, Deng C, Wood BJ, Neeman Z, Horne IIIM, Li KC. Pulsed High-Intensity Focused Ultrasound Enhances Thrombolysis in an in Vitro Model 1. Radiology. 2006;239:86–93. doi: 10.1148/radiol.2391042181. [DOI] [PMC free article] [PubMed] [Google Scholar]
- Friedman HS, Koroshetz W, Qureshi N. Tissue plasminogen activator for acute ischemic stroke. N Engl J Med. 1996;334:1405. [PubMed] [Google Scholar]
- Goldhaber SZ, Meyerovitz MF, Braunwald E, Green D, Vogelzang RL, Citrin P, Heit J, Sobel M, Wheeler HB, Plante D. Randomized controlled trial of tissue plasminogen activator in proximal deep venous thrombosis. The American journal of medicine. 1990;88:235–40. doi: 10.1016/0002-9343(90)90148-7. [DOI] [PubMed] [Google Scholar]
- Hertzberg B, Kliewer MA, DeLong DM, Lalouche K, Paulson E, Frederick M, Carroll B. Sonographic assessment of lower limb vein diameters: implications for the diagnosis and characterization of deep venous thrombosis. AJR American journal of roentgenology. 1997;168:1253–7. doi: 10.2214/ajr.168.5.9129422. [DOI] [PubMed] [Google Scholar]
- Hitchcock KE, Ivancevich NM, Haworth KJ, Stamper DNC, Vela DC, Sutton JT, Pyne-Geithman GJ, Holland CK. Ultrasound-enhanced rt-PA thrombolysis in an ex vivo porcine carotid artery model. Ultrasound in medicine & biology. 2011;37:1240–51. doi: 10.1016/j.ultrasmedbio.2011.05.011. [DOI] [PMC free article] [PubMed] [Google Scholar]
- Holland CK, Vaidya SS, Datta S, Coussios CC, Shaw GJ. Ultrasound-enhanced tissue plasminogen activator thrombolysis in an in vitro porcine clot model. Thrombosis research. 2008;121:663–73. doi: 10.1016/j.thromres.2007.07.006. [DOI] [PMC free article] [PubMed] [Google Scholar]
- Kim HS, Patra A, Paxton BE, Khan J, Streiff MB. Adjunctive percutaneous mechanical thrombectomy for lower-extremity deep vein thrombosis: clinical and economic outcomes. Journal of vascular and interventional radiology. 2006;17:1099–104. doi: 10.1097/01.RVI.0000228334.47073.C4. [DOI] [PubMed] [Google Scholar]
- Kirchhof K, Welzel T, Mecke C, Zoubaa S, Sartor K. Differentiation of White, Mixed, and Red Thrombi: Value of CT in Estimation of the Prognosis of Thrombolysis—Phantom Study 1. Radiology. 2003;228:126–30. doi: 10.1148/radiol.2273020530. [DOI] [PubMed] [Google Scholar]
- Kunitada S, FitzGerald G, Fitzgerald D. Inhibition of clot lysis and decreased binding of tissue-type plasminogen activator as a consequence of clot retraction. Blood. 1992;79:1420–7. [PubMed] [Google Scholar]
- Laing ST, Moody MR, Kim H, Smulevitz B, Huang SL, Holland CK, McPherson DD, Klegerman ME. Thrombolytic efficacy of tissue plasminogen activator-loaded echogenic liposomes in a rabbit thrombus model. Thrombosis research. 2012;130:629–35. doi: 10.1016/j.thromres.2011.11.010. [DOI] [PMC free article] [PubMed] [Google Scholar]
- Larsson J, Carlson J, Olsson SB. Ultrasound enhanced thrombolysis in experimental retinal vein occlusion in the rabbit. British journal of ophthalmology. 1998;82:1438–40. doi: 10.1136/bjo.82.12.1438. [DOI] [PMC free article] [PubMed] [Google Scholar]
- Lauw MN, Büller HR. Current Approaches to Deep Vein Thrombosis. Future Medicine Ltd; 2014. Treatment of deep vein thrombosis; pp. 136–60. [Google Scholar]
- Lin KW, Kim Y, Maxwell AD, Wang TY, Hall T, Xu Z, Fowlkes JB, Cain C. Histotripsy beyond the intrinsic cavitation threshold using very short ultrasound pulses: Microtripsy. Ultrasonics, Ferroelectrics, and Frequency Control, IEEE Transactions on. 2014;61:251–65. doi: 10.1109/TUFFC.2014.6722611. [DOI] [PMC free article] [PubMed] [Google Scholar]
- Lip GY, Hull RD, Leung LL, Mandel J, Finlay G. Overview of the treatment of lower extremity deep vein thrombosis (DVT) [Google Scholar]
- Macfarlane R. A simple method for measuring clot-retraction. The Lancet. 1939;233:1199–201. [Google Scholar]
- Maxwell AD, Cain CA, Duryea AP, Yuan L, Gurm HS, Xu Z. Noninvasive thrombolysis using pulsed ultrasound cavitation therapy–histotripsy. Ultrasound in medicine & biology. 2009;35:1982–94. doi: 10.1016/j.ultrasmedbio.2009.07.001. [DOI] [PMC free article] [PubMed] [Google Scholar]
- Maxwell AD, Cain CA, Hall TL, Fowlkes JB, Xu Z. Probability of cavitation for single ultrasound pulses applied to tissues and tissue-mimicking materials. Ultrasound in medicine & biology. 2013;39:449–65. doi: 10.1016/j.ultrasmedbio.2012.09.004. [DOI] [PMC free article] [PubMed] [Google Scholar]
- Maxwell AD, Owens G, Gurm HS, Ives K, Myers DD, Xu Z. Noninvasive treatment of deep venous thrombosis using pulsed ultrasound cavitation therapy (histotripsy) in a porcine model. Journal of vascular and interventional radiology. 2011a;22:369–77. doi: 10.1016/j.jvir.2010.10.007. [DOI] [PMC free article] [PubMed] [Google Scholar]
- Maxwell AD, Wang TY, Cain CA, Fowlkes JB, Sapozhnikov OA, Bailey MR, Xu Z. Cavitation clouds created by shock scattering from bubbles during histotripsy. The Journal of the Acoustical Society of America. 2011b;130:1888–98. doi: 10.1121/1.3625239. [DOI] [PMC free article] [PubMed] [Google Scholar]
- Meairs S, Culp W. Microbubbles for thrombolysis of acute ischemic stroke. Cerebrovascular diseases. 2009;27:55–65. doi: 10.1159/000203127. [DOI] [PubMed] [Google Scholar]
- Molina CA, Barreto AD, Tsivgoulis G, Sierzenski P, Malkoff MD, Rubiera M, Gonzales N, Mikulik R, Pate G, Ostrem J. Transcranial ultrasound in clinical sonothrombolysis (TUCSON) trial. Annals of neurology. 2009;66:28–38. doi: 10.1002/ana.21723. [DOI] [PubMed] [Google Scholar]
- Mozaffarian D, Benjamin EJ, Go AS, Arnett DK, Blaha MJ, Cushman M, de Ferranti S, Despres JP, Fullerton HJ, Howard VJ. Heart disease and stroke statistics-2015 update: a report from the american heart association. Circulation. 2015;131:e29. doi: 10.1161/CIR.0000000000000152. [DOI] [PubMed] [Google Scholar]
- Mlller-Hllsbeck S, Brossmann J, Jahnke T, Grimm J, Reuter M, Bewig B, Heller M. Mechanical thrombectomy of major and massive pulmonary embolism with use of the Amplatz thrombectomy device. Investigative radiology. 2001;36:317–22. doi: 10.1097/00004424-200106000-00003. [DOI] [PubMed] [Google Scholar]
- Negus D, Cockett F. Femoral vein pressures in post - phlebitic iliac vein obstruction. British Journal of Surgery. 1967;54:522–5. doi: 10.1002/bjs.1800540605. [DOI] [PubMed] [Google Scholar]
- Park S, Maxwell AD, Owens GE, Gurm HS, Cain CA, Xu Z. Non-invasive embolus trap using histotripsy—an acoustic parameter study. Ultrasound in medicine & biology. 2013;39:611–9. doi: 10.1016/j.ultrasmedbio.2012.11.026. [DOI] [PMC free article] [PubMed] [Google Scholar]
- Parsons JE, Cain CA, Fowlkes JB. Cost-effective assembly of a basic fiber-optic hydrophone for measurement of high-amplitude therapeutic ultrasound fields. The Journal of the Acoustical Society of America. 2006;119:1432–40. doi: 10.1121/1.2166708. [DOI] [PubMed] [Google Scholar]
- Pfaffenberger S, Devcic-Kuhar B, El-Rabadi K, Gröschl M, Speidl WS, Weiss TW, Huber K, Benes E, Maurer G, Wojta J. 2MHz ultrasound enhances t-PA-mediated thrombolysis: comparison of continuous versus pulsed ultrasound and standing versus travelling acoustic waves. Thromb Haemost. 2003;89:583–9. [PubMed] [Google Scholar]
- Popuri RK, Vedantham S. The role of thrombolysis in the clinical management of deep vein thrombosis. Arteriosclerosis, thrombosis, and vascular biology. 2011;31:479–84. doi: 10.1161/ATVBAHA.110.213413. [DOI] [PMC free article] [PubMed] [Google Scholar]
- Rosenschein U, Furman V, Kerner E, Fabian I, Bernheim J, Eshel Y. Ultrasound Imaging–Guided Noninvasive Ultrasound Thrombolysis Preclinical Results. Circulation. 2000;102:238–45. doi: 10.1161/01.cir.102.2.238. [DOI] [PubMed] [Google Scholar]
- Sharafuddin MJ, Sun S, Hoballah JJ, Youness FM, Sharp WJ, Roh BS. Endovascular management of venous thrombotic and occlusive diseases of the lower extremities. Journal of vascular and interventional radiology. 2003;14:405–23. doi: 10.1097/01.rvi.0000064849.87207.4f. [DOI] [PubMed] [Google Scholar]
- Siegel RJ, Luo H. Ultrasound thrombolysis. Ultrasonics. 2008;48:312–20. doi: 10.1016/j.ultras.2008.03.010. [DOI] [PubMed] [Google Scholar]
- Singhal S, Henderson R, Horsfield K, Harding K, Cumming G. Morphometry of the human pulmonary arterial tree. Circulation Research. 1973;33:190–7. doi: 10.1161/01.res.33.2.190. [DOI] [PubMed] [Google Scholar]
- Stone MJ, Frenkel V, Dromi S, Thomas P, Lewis RP, Li KC, Horne M, Wood BJ. Pulsed-high intensity focused ultrasound enhanced tPA mediated thrombolysis in a novel in vivo clot model, a pilot study. Thrombosis research. 2007;121:193–202. doi: 10.1016/j.thromres.2007.03.023. [DOI] [PMC free article] [PubMed] [Google Scholar]
- Sutton JT, Ivancevich NM, Perrin SR, Vela DC, Holland CK. Clot retraction affects the extent of ultrasound-enhanced thrombolysis in an ex vivo porcine thrombosis model. Ultrasound in medicine & biology. 2013;39:813–24. doi: 10.1016/j.ultrasmedbio.2012.12.008. [DOI] [PMC free article] [PubMed] [Google Scholar]
- Tsivgoulis G, Eggers J, Ribo M, Perren F, Saqqur M, Rubiera M, Sergentanis TN, Vadikolias K, Larrue V, Molina CA. Safety and efficacy of ultrasound-enhanced thrombolysis a comprehensive review and meta-analysis of randomized and nonrandomized studies. Stroke. 2010;41:280–7. doi: 10.1161/STROKEAHA.109.563304. [DOI] [PubMed] [Google Scholar]
- Uflacker R, Rajagopalan P, Vujic I, Stutley JE. Treatment of thrombosed dialysis access grafts: randomized trial of surgical thrombectomy versus mechanical thrombectomy with the Amplatz device. Journal of vascular and interventional radiology. 1996;7:185–92. doi: 10.1016/s1051-0443(96)70760-1. [DOI] [PubMed] [Google Scholar]
- Vlaisavljevich E, Kim Y, Owens G, Roberts W, Cain C, Xu Z. Effects of tissue mechanical properties on susceptibility to histotripsy-induced tissue damage. Physics in medicine and biology. 2014;59:253. doi: 10.1088/0031-9155/59/2/253. [DOI] [PMC free article] [PubMed] [Google Scholar]
- Vlaisavljevich E, Lin KW, Warnez MT, Singh R, Mancia L, Putnam AJ, Johnsen E, Cain C, Xu Z. Effects of tissue stiffness, ultrasound frequency, and pressure on histotripsy-induced cavitation bubble behavior. Physics in medicine and biology. 2015;60:2271. doi: 10.1088/0031-9155/60/6/2271. [DOI] [PMC free article] [PubMed] [Google Scholar]
- Wang TY, Xu Z, Hall TL, Fowlkes JB, Cain CA. An efficient treatment strategy for histotripsy by removing cavitation memory. Ultrasound in medicine & biology. 2012;38:753–66. doi: 10.1016/j.ultrasmedbio.2012.01.013. [DOI] [PMC free article] [PubMed] [Google Scholar]
- Wright C, Hynynen K, Goertz D. In vitro and in vivo high intensity focused ultrasound thrombolysis. Investigative radiology. 2012;47:217. doi: 10.1097/RLI.0b013e31823cc75c. [DOI] [PMC free article] [PubMed] [Google Scholar]
- Xie H, Kim K, Aglyamov SR, Emelianov SY, O'Donnell M, Weitzel WF, Wrobleski SK, Myers DD, Wakefield TW, Rubin JM. Correspondence of ultrasound elasticity imaging to direct mechanical measurement in aging DVT in rats. Ultrasound in medicine & biology. 2005;31:1351–9. doi: 10.1016/j.ultrasmedbio.2005.06.005. [DOI] [PMC free article] [PubMed] [Google Scholar]
- Xu Z, Hall TL, Fowlkes JB, Cain CA. Effects of acoustic parameters on bubble cloud dynamics in ultrasound tissue erosion (histotripsy) The Journal of the Acoustical Society of America. 2007;122:229–36. doi: 10.1121/1.2735110. [DOI] [PMC free article] [PubMed] [Google Scholar]
- Xu Z, Owens G, Gordon D, Cain C, Ludomirsky A. Noninvasive creation of an atrial septal defect by histotripsy in a canine model. Circulation. 2010;121:742–9. doi: 10.1161/CIRCULATIONAHA.109.889071. [DOI] [PMC free article] [PubMed] [Google Scholar]
- Xu Z, Raghavan M, Hall T, Mycek MA, Fowlkes JB, Cain C. Evolution of bubble clouds induced by pulsed cavitational ultrasound therapy-histotripsy. Ultrasonics, Ferroelectrics, and Frequency Control, IEEE Transactions on. 2008;55:1122–32. doi: 10.1109/TUFFC.2008.764. [DOI] [PubMed] [Google Scholar]
- Yasui K, Qian Z, Nazarian GK, Hunter DW, Castañeda-Zúñiga WR, Amplatz K. Recirculation-type Amplatz clot macerator: determination of particle size and distribution. Journal of vascular and interventional radiology. 1993;4:275–8. doi: 10.1016/s1051-0443(93)71853-9. [DOI] [PubMed] [Google Scholar]
- Zhang X, Jin L, Vlaisavljevich E, Owens GE, Gurm HS, Cain CA, Xu Z. Noninvasive thrombolysis using microtripsy: a parameter study. Ultrasonics, Ferroelectrics, and Frequency Control, IEEE Transactions on. 2015a;62:2092–105. doi: 10.1109/TUFFC.2015.007268. [DOI] [PMC free article] [PubMed] [Google Scholar]
- Zhang X, Miller RM, Lin KW, Levin AM, Owens GE, Gurm HS, Cain CA, Xu Z. Real-Time Feedback of Histotripsy Thrombolysis Using Bubble-Induced Color Doppler. Ultrasound in medicine & biology. 2015b;41:1386–401. doi: 10.1016/j.ultrasmedbio.2014.12.006. [DOI] [PMC free article] [PubMed] [Google Scholar]
- Zhang X, Owens GE, Gurm HS, Ding Y, Cain C, Xu Z. Noninvasive thrombolysis using histotripsy beyond the intrinsic threshold (microtripsy) Ultrasonics, Ferroelectrics, and Frequency Control, IEEE Transactions on. 2015c;62:1342–55. doi: 10.1109/TUFFC.2015.007016. [DOI] [PMC free article] [PubMed] [Google Scholar]


