

Abstract
Myocardial contrast echocardiography (MCE) for perfusion imaging can induce microscale bioeffects during intermittent high Mechanical Index (MI) scans. The dependence of MCE induced bioeffects on the ultrasonic frequency was examined in rats at 1.6, 2.5 and 3.5 MHz. Premature complexes were counted in the ECG, petechial hemorrhages (PH) with microvascular leakage on the heart surface were observed at the time of exposure, plasma troponin elevation was measured after 4 h and cardiomyocyte injury was detected at 24 h. Increasing response to exposure above an apparent threshold was observed for all endpoints at each frequency. The effects decreased with increasing ultrasonic frequency, and the thresholds increased. Linear regressions for frequency dependent thresholds indicated coefficients and exponents of 0.6 and 1.07 for PH, respectively, and 1.02 and 0.8 for cardiomyocyte death, compared to 1.9 and 0.5 (square root) for the guideline limit of the MI. The results clarify the dependence of cardiac bioeffects on frequency, and should allow development of theoretical descriptions of the phenomena and improved safety guidance for MCE.
Keywords: diagnostic ultrasound adverse effects, ultrasonic cavitation biology, cardiomyocyte injury, myocardial contrast echocardiography
INTRODUCTION
During initial considerations of the dosimetry and safety guidance for diagnostic ultrasound in the 1980s, a considerable body of research indicated that a wide range of bioeffects could be caused by ultrasound exposure in animals (Nyborg et al. 2002). The most prominent effects resulted from heating or the nonthermal mechanism of ultrasonic cavitation. Two indices were created to provide real time indicators of relative bioeffects potential for the wide range of diagnostic ultrasound exposure levels arising for the various imaging modes: a Thermal Index for heating, and a Mechanical Index (MI) for nonthermal bioeffects. The philosophy of the MI as a dosimetric parameter was that the threshold for cavitation microbubble collapse could be modeled and used as a worst case surrogate for detailed bioeffects information, which was lacking at the time. That is, the bioeffect potential should be related to the MI, and the thresholds for cavitational bioeffects should fall at a constant value of the MI for different frequencies.
In subsequent research, the only diagnostic ultrasound mode for which cavitational bioeffects have been demonstrated in vivo (for exposure below the guideline upper limit of MI=1.9) is contrast enhanced diagnostic ultrasound. In the absence of ultrasound contrast agents (UCA), essentially no evidence has been found for cavitation or its bioeffects in mammalian tissue (Church et al. 2008). UCA microbubbles are confined to the blood vessels. The salient bioeffect of contrast enhanced diagnostic ultrasound reported for various tissues, including muscle, heart, brain, and kidney, is capillary rupture producing a petechial hemorrhage (Miller et al. 2008a). This significant mechanical bioeffect is clearly observable in most soft tissues, and can serve as the incipience of concern for patient risk. For example, glomerular capillary hemorrhage (GCH) has been observed in rat kidney (Wibble et al. 2002; Miller et al. 2007a), and a threshold was observed at a level equivalent to MI=0.78 at 1.5 MHz (Miller et al. 2008b). The frequency (f) dependence of the rare factional pressure threshold (pt) was approximately given by pt=0.5f in MPa. This is a substantial deviation from the square-root dependence of the MI, which would relatively underestimate risk at low frequencies and over-estimate risk at higher frequencies, if used for safety guidance in contrast enhanced diagnostic ultrasound.
Heart is another organ for which contrast enhancement is valuable. For myocardial contrast echocardiography (MCE), increased numbers of premature complexes (PCs) in the ECG were reported in humans with an experimental contrast agent by van der Wouw et al. (2000). MCE for perfusion imaging utilizes UCA infusion and intermittent triggering of ultrasound at relatively high MIs from the ECG signal at a range of intervals (Wei et al. 1998). The UCA microbubbles are destroyed for each scan and the interval allows refill of the tissue with blood containing microbubbles, with the rate of refill indicative of tissue perfusion. Subsequently, the PC-effect of MCE has been reported independently (confirming the observation) in humans using experimental contrast agents (Chapman et al. 2005), in dogs using a commercial agent (Okazaki et al. 2004, Miller et al. 2006), and also in rats with various contrast agents (e. g. Li et al. 2003; Li et al. 2004; Vancraeynest et al. 2009). The PCs from MCE are important because these provide a clinically observable indication of myocardial perturbation. Reported microvascular effects of MCE include microvascular leakage, and petechial hemorrhage (Li et al. 2003; Li et al. 2004). Other findings related to cardiomyocyte injury include elevation of the cardiac enzyme troponin in blood (Chen et al. 2002; Vancraeynest et al. 2007), and histologically defined micro-lesions with inflammatory cell infiltration (Miller et al. (2005a). Lethal cardiomyocyte injury was also found to occur and could be characterized through use of Evans blue dye as a vital stain (Miller et al. 2005b).
The MCE perfusion imaging concept has clinically useful applications (Porter and Xie, 2015), although MCE has not gained wide clinical acceptance (Pathan and Marwick, 2015). In addition, the bioeffects and their implications for the MI concept present fundamental problems for medical ultrasound dosimetry and safety guidance. The purpose of this present study was to examine the frequency dependence of MCE induced bioeffects. A cardiac ultrasound platform was used for MCE at 1.6, 2.5 and 3.5 MHz. PCs and subsequent petechiae were observed at the time of exposure, troponin elevation was measured after 4 h and cardiomyocyte injury was detected at 24 h. The results clarify the dependence of cardiac bioeffects on ultrasonic frequency, and should allow development of theoretical descriptions of the phenomena and improved safety guidance for MCE.
METHODS
Animal preparation
This in vivo research was conducted with the approval of the University Committee on the Use and Care of Animals at the University of Michigan. Male hairless rats (CD hairless, Charles River Laboratories, Wilmington MA) were used in this study, as detailed below. Six were lost from the study due to anesthetic death or technical problems. The rats were anesthetized via intraperitoneal injection of ketamine (91 mg/kg) plus xylazine (9 mg/kg). This is the recommended anesthetic for rats. The outcome of some bioeffect experiments can depend on anesthetic techniques, as well as on physical parameters. For example, ketamine plus xylazine can reduce thresholds for pulmonary capillary hemorrhage induced by diagnostic ultrasound relative to anesthesia with ketamine only or other anesthetic formulations (Miller et al. 2015b). However, recent research indicates that the threshold for glomerular capillary hemorrhage by contrast enhanced diagnostic ultrasound is about the same for ketamine only or ketamine plus xylazine (Miller et al. 2016). A 24 gauge cannula was inserted into a tail vein for intravenous injections and infusion of contrast agent. The anesthetized rats were mounted on a plastic board in the right lateral decubitus position (right side toward the board). This mount was then placed vertically in a 38°C temperature controlled water bath filled with degassed water for scanning of the heart from the left side. This scanning method allows for free positioning of the probe relative to the rat for consistent exposure, and provides excellent temperature support for the anesthetized animal. Shaving was not needed for preparation, because the rats were nearly hairless. Each rat was checked for body temperature and SpO2 (percentage of oxygen saturation of hemoglobin in peripheral blood) when mounted on the board. ECG needle electrodes were placed in the forelegs and left hind leg, and the signal was amplified (Model ECGA amplifier with Model RWT trigger module, Hugo Sachs Electronik, March FRG) and digitized (Powerlab 4/30, ADInstruments Inc. Colorado Springs, CO USA) for analysis of arrhythmia with the aid of software (Chart Pro 5, v. 5.5.5, ADInstruments Inc. Colorado Springs, CO USA). The TTL trigger-out signal from the trigger module was used to supply an ECG-derived signal to the ECG input of the ultrasound machine for triggering the images.
Diagnostic Ultrasound
The general procedure for diagnostic ultrasound exposure of rats with contrast agent has been described previously (Li et al. 2004). Phased array probes (S3 and S5, GE Vivid 7 Dimension, GE Vingmed Ultrasound, Horten, Norway) were used for MCE. The probes were clamped in the water bath to image the approximate middle of the heart between ribs. The two dimensional B mode images display the intensity of echoes as the brightness of a spot positioned at the angular position of the transmitted beam and the transit time (image depth) of the echo. Blood is normally dark, but the strong response of contrast agent microbubbles enhances blood filled regions in the image, for example to allow better definition of the left ventricular border. The S3 probe was operated at the 1.6 MHz setting in the “Octave” mode (a type of B mode designed to improve resolution by emphasizing echoes received at twice the transmitted ultrasound frequency), with the anterior left ventricular (LV) wall at 3.8 cm image depth. The S5 probe was operated at the 2.2 MHz setting in “Octave” mode, or at the 4.0 MHz setting in B mode, both with the anterior left ventricular wall at 4.2 cm image depth. The pulse pressure waveforms were assessed in the water bath using a calibrated hydrophone with 0.2 mm sensitive spot (HGL0200, Onda, Sunnyvale, CA, USA), and the position of the peak rare factional pressure amplitude (PRPA) was determined. The −6 dB beam width was determined by moving the hydrophone perpendicular to the scan plane and measuring the difference between the position giving one-half the PRPA above and below the scan plane. The approximate PRPA at the LV was measured by inserting rat chest wall samples between the probe and the hydrophone. These attenuated pressure amplitude measurements are presented here as the in situ exposure PRPA. Exposure parameters are listed in Table 1 for measurements using five different chest wall samples. The fundamental frequencies and pulse repetition frequencies were determined on an oscilloscope from the pulse waveforms using the time between two peak rarefactional amplitudes or two pulses, respectively. The observed center fundamental frequencies of 1.6, 2.5 and 3.5 MHz are used to describe the exposures. Pulse durations were calculated from the time-intensity integral. Scanning exposures were performed at power settings (shown on-screen) of 0 dB, −2 dB, −4 dB and −6 dB for the S5 probe and additionally at −8 dB for the S3 probe. The corresponding on-screen MI values were 1.3, 1.0, 0.8, 0.6 and 0.5 at 1.6 MHz for 0 dB, −2 dB, −4 dB, −6 dB, and −8 dB, respectively, and were the same at 2.2 MHz and 4.0 MHz for the same power settings, except the MI was 1.2 for 0 dB. An example of the pulse waveform transmitted through a chest wall sample is plotted in Fig. 1 for each frequency. The position of the samples was adjusted before measurement to obtain maximal PRPA, in order to assure that the beam path was between ribs. For exposure, the ECG-derived signal was directed to the ultrasound machine and used to time-trigger dual frames at end of systole, each 4 heartbeats. The dual frames were 20–30 ms apart, and showed some change due to the microbubble destruction for the higher power settings, see Fig. 2. The intermittent triggering allowed refill of the myocardium with contrast agent between triggered dual images.
Table 1.
Exposure parameters for the 5 exposure power settings used with the S3 probe and 4 settings with the S5 probe. The frequencies were determined from the waveforms and the PRPAs were the mean ± standard deviation for measurements with 5 different chest wall samples. The frame rates indicate the scan speeds for continuous imaging; the frames at this speed were actually triggered intermittently from the ECG each 4 heartbeats (approximately a 1 fps rate). PRF: pulse repetition frequency. The −6 dB width refers to the approximate thickness of the scan plane. Approximate in situ peak rarefactional pressure amplitudes (mean ± standard deviation) for each condition are listed in MPa.
| Parameter | S3 at 1.6 setting | S5 at 2.2 setting | S5 at 4.0 setting |
|---|---|---|---|
| Frequency (MHz) | 1.6 | 2.5 | 3.5 |
| Frame rate (fps) | 56.3 | 43.2 | 31.6 |
| PRF (kHz) | 4.1 | 3.0 | 3.1 |
| Pulse Duration (ns) | 1,520 | 690 | 390 |
| −6 dB width (mm) | 5.0 | 3.7 | 3.0 |
|
| |||
| 0 dB (MPa) | 2.61 ± 0.16 | 3.11 ± 0.19 | 4.03 ± 0.20 |
| −2 dB (MPa) | 2.06 ± 0.11 | 2.42 ± 0.15 | 3.07 ± 0.18 |
| −4 dB (MPa) | 1.66 ± 0.11 | 1.92 ± 0.10 | 2.44 ± 0.16 |
| −6 dB (MPa) | 1.31 ± 0.12 | 1.64 ± 0.0.08 | 1.87 ± 0.18 |
| −8 dB (MPa) | 1.05 ± 0.06 | - | - |
Figure 1.

Plots of the attenuated acoustic pressure for the maximum pulses at each frequency after passage through a chest wall sample. The machine was operated at the 0 dB (maximum power) setting and the calibrated hydrophone was placed at the depth position of the anterior wall of the left ventricle which coincided with the position of the peak rarefactional pressure amplitude.
Figure 2.

Ultrasound dual images 30 ms apart for 2.5 MHz scanning at −4 dB. For the dual image before contrast was infused (top), both images are essentially the same, with the left ventricle (arrow) appearing as a dark area. The dual image after contrast infusion (bottom) shows the reduction in contrast echoes from the left to the right image (the blood-filled left ventricle appears as a bright central area). The traces across the bottom of the images were the ECG-derived signal used to trigger the images; the lower trace shows a premature complex with compensatory pause just after the dual trigger (two red markers on the signal trace) with microbubble destruction evident in the myocardium. The depth scale on the left side of the image is in cm.
Ultrasound Contrast Agent
The ultrasound contrast agent was a laboratory replacement for Definity® (perflutren lipid microsphere injectable suspension, Lantheus Medical Imaging, Inc., N. Billerica, MA USA), which is no longer sold for research purposes. A replacement contrast agent (RCA) for Definity was created using a formula set as close as possible to the Definity formula, as described previously (Miller et al. 2015a). The lipid mixture was sterilized and aliquoted into empty sterile Definity vials with the headspace filled with octafluoropropane (HC-218, Purity Plus, Metro Welding Supply, Detroit MI USA). The vials were shaken for 45 s in a VialMix (DuPont Pharmaceuticals Co., Billerica MA USA) before use to produce the suspensions of stabilized microbubbles. The RCA microbubbles were slightly larger at 1.8 ± 0.11 μm diameter than actual Definity microbubbles at 1.6 ± 0.04 μm diameter, as measured using a Coulter counter (Multisizer 4, Beckman Coulter, Inc. Indianapolis In USA) (Miller et al. 2016). The concentration of the RCA derived from the Coulter counter results was 3.7 ± 0.3 109 ml−1, which was not significantly different from Definity. In a separate test, the in vivo performance of the RCA relative to Definity was checked by measuring the left ventricular echogenicity with the S10 probe on the same diagnostic system, as described previously (Miller et al. 2015a). Briefly, images were obtained during infusion of the agents at 5 μl/kg/min, and the echogenicity of a small region of interest inside the left ventricle was measured (acoustical units) from a time-intensity curve. Eight rats were tested with both the RCA and Definity infused in each rat, separated by a 15 min pause to allow the echogenicity to return to baseline. The order of the agent use was alternated to average any bias related to the order of infusion. Results are listed in Table 2. There was no significant difference between the two agents after 1, 3 or 5 min of infusion, which indicated that the in vivo doses of microbubbles from the agents were essentially the same throughout the infusion duration.
Table 2.
A comparison of the echogenicity from the left ventricle for replacement and clinical Definity for three time points during the 5 min infusion. The p values resulted from Student’s t-tests of the comparison (n=8).
| Agent | Echogenicity Acoustical Units | ||
|---|---|---|---|
| 1 min | 3 min | 5 min | |
| Definity | 0.019 ± 0.011 | 0.022 ± 0.014 | 0.023 ± 0.013 |
| Replacement | 0.027 ± 0.015 | 0.027 ± 0.013 | 0.022 ± 0.013 |
|
| |||
| p value | 0.25 | 0.52 | 0.94 |
For infusion, the RCA was diluted by adding 30 μl or 60 μl of prepared agent to 3 ml of sterile saline. The dilution was infused at 0.5 ml/kg/min, to deliver 5 or 10 μl/kg/min of agent for different parts of the study described below. These agent infusion rates were approximately equal to 1.35 or 2.7 times the maximum recommended infusion rate for Definity (10 ml/min of 1.3 ml Definity diluted in 50 ml of saline, from the package insert (Lantheus Medical Imaging, 2013), assuming a 70 kg human). The contrast infusion was started with the ultrasound on and timed for 5 min after the contrast enhancement appeared in the image. Scanning was continued for 1 min after stopping the infusion. For sham exposure, the rat was scanned for 5 min using the maximum ultrasound (0 dB) setting, and then the contrast agent was infused for 5 min with the ultrasound off.
Experimental Plan and Measured Endpoints
The study was conducted in three parts for determination of different endpoints with sacrifice at 5 min, 4 h or 1 d after scanning. The weight and percent oxygen saturation (%SpO2, SurgiVet V3395 TPR, Smiths Medical Inc. St Paul, MN USA) were measured for each rat. Heart rate was checked before and after water-bath scanning. A trend for increasing heart rate from the beginning to the end of the procedure appeared to be unrelated to treatment, and likely resulted from trends in body temperature or depth of anesthesia. These general parameters are listed in Table 3. Heart rate is important for the exposures in this study, because scans were triggered 1:4 heartbeats, but the entire exposure was timed for 5 min. The overall average heart rate was 280 ± 26 beats per minute (bpm), which would yield 350 ± 7 triggered scans in 5 min for perfectly consistent triggering. In addition, the number of premature complexes (PCs) that occurred during scanning was determined from the digitized ECG record for each rat.
Table 3.
The results for the general physiological measurements of the rats in each part of the study (mean ± standard deviation). The SpO2 and rectal temperature readings were taken just prior to placement in the water bath. The difference between the pre-test and post-test heart rate (HR) values was statistically significant. However, this difference was not significantly different for shams compared to exposed groups, and the values given include both sham and exposure results.
| Study part | Weight | SpO2 | Temperature | HR pre-test | HR post-test | |
|---|---|---|---|---|---|---|
| n | g | % | C | bpm | bpm | |
| 1 – 5 min | 80 | 290 ± 40 | 82 ± 7 | 36.7 ± 0.5 | 266 ± 19 | 278 ± 25 |
| 2 – 4 h | 30 | 278 ± 30 | 82 ± 5 | 36.5 ± 0.4 | 272 ± 19 | 280 ± 22 |
| 3 – 1 d | 72 | 293 ± 23 | 83 ± 4 | 36.6 ± 0.4 | 274 ± 23 | 308 ± 21 |
The first part of the study was planned to determine the numbers of petechiae and the area of capillary leakage of Evans blue dye on the surface of the hearts collected at sacrifice 5 min after exposure. The capillary rupture effect of contrast aided ultrasound was reported by Skyba et al. (1998), and the characterization by petechiae counting and Evans blue leakage was described in skeletal muscle by Miller and Quddus (2000). Surface counts of petechiae were used in this study, because no method was available to quantify the capillary ruptures inside the myocardium. This cardiac procedure was similar to that used in Li et al. (2004). A total of 83 rats were used with 3 lost from the study due to anesthetic death or procedural errors. Sixteen test groups of 5 rats each included one group at each of the exposure settings in Table 1 plus one sham group at each frequency. The RCA infusion was at 10 μl/kg/min. Evans blue dye was prepared at 25 mg/ml and injected IV 5 min before exposure to give 50 mg/kg. The PH were counted during visual inspection of the hearts with a stereo microscope on both the anterior and posterior surfaces of the hearts. The count was estimated for the reddish areas with many petechiae, but for near threshold conditions individual petechiae, which were about 25 μm wide by 100 μm long, could be counted accurately. The hearts were photographed (Spot Flex, Diagnostic Instruments Inc., Sterling Heights, MI USA) during inspection with the stereo microscope and the surface areas of evident blue dye leakage into the interstitium were measured with the aid of image analysis software (Spot v. 5.1, Diagnostic Instruments, Inc., Sterling Heights, MI USA), which provided the areas of manually drawn regions in the images. Evans blue binds to albumin, so that its presence outside of the vascular space indicates abnormal microvascular permeability (including capillary rupture).
The second part of the study was designed to assess plasma troponin (a marker for cardiomyocyte injury, O’Brien et al. 2006), and to view tissue injury by microscopy 4 h after exposure. Thirty rats were used for this part of the study in 6 groups of 5 rats each. Groups with sham and 0 dB exposure were performed for each frequency. The RCA infusion was at 10 μl/kg/min during exposure. No Evans blue was used. In addition, PCs and surface petechiae were counted. Plasma troponin I was measured with an assay kit (Rat Cardiac Troponin-1 ELISA, Life Diagnostics, Inc. West Chester, PA USA). Heart samples were collected and fixed for histology in 10% neutral buffered formalin, which was applied by immersion and by filling the left ventricle at a pressure of 20 cm H2O. Three sets of slides were made within the scan plane, with one slide of each set stained with hematoxylin and eosin (H&E). The H&E slides were used to select the set with the greatest apparent effect, and a companion slide was stained by immunohistochemistry for fibrin/fibrinogen to show possible fibrin formation. These paraffin sections were rehydrated with water and heat induced epitope retrieval was performed with FLEX TRS Low pH Retrieval buffer (6.10) for 20 min (K8005, Dako N.A., Carpenteria CA, USA). After peroxidase blocking, the sections were incubated for 60 min at room temperature with polyclonal sheep anti-rat fibrinogen antibody (1:8000 dilution, ab118533, abcam, Cambridge MA, USA). A section of human placenta was used as a control for fibrin staining. Background staining was minimized using a proprietary background reducing diluent (S3022, Dako N.A.). Next, sections were incubated for 30 min with a biotin-conjugated rabbit anti-sheep secondary antibody (1:200 dilution, BA6000, Vector Laboratories, Burlingame CA, USA) followed by a 20 min incubation with streptavidin peroxidase (abcam, ab64269). F inally, sections were incubated with DAB chromagen for 10 minutes and then counterstained with Harris Hematoxylin for 5 seconds. Isotype negative control antibody (1:8000 dilution, ab37385, abcam) was used on additional sections with identical immunohistochemical conditions, which yielded no significant staining.
The third part of the study was conducted to assess the extent of lethal cardiomyocyte injury after 24 h. A total of 75 rats were used for this part of the study, with three rats lost due to procedural problems. There were 12 groups of 6 rats each, including groups for the 5 exposure settings (Table 1) at 1.6 MHz and groups for 0 dB, −2 dB and −4 dB at 2.5 MHz and 3.5 MHz, plus 1 sham group. The RCA infusion was at 5 μl/kg/min. Evans blue dye was prepared at 20 mg/ml and slowly injected IV 5 min before exposure to give 100 mg/kg. This procedure was similar to that used in Miller et al. (2005b). Briefly, the hearts were removed the day after exposure and were trimmed to remove the atria. These samples were frozen on dry ice in freezing compound (Tissue-Tek, Sakura Finetek USA Inc. Torrance CA USA). Up to 40 frozen sections were made of each heart sample at 10 μm thickness and 200 μm intervals (i. e. a 5% sampling). The slides were scored blindly using fluorescence microscopy for approximate numbers of fluorescent Evans Blue stained cardiomyocytes, an indication of lethal injury (Miller et al. 2005a). The final stained cardiomyocyte score (SCS) for each heart was calculated as the sum of the scores for the individual slides. The Evans blue staining was indicative of cardiomyocyte necrosis (Miller et al 2005b, Miller et al. 2007b). This method also has proven useful for characterizing and measuring the impact of high power treatments investigated for therapeutic myocardial reduction (Miller et al. 2014; Zhu et al. 2015).
RESULTS
The endpoints for the first part of the study were the PCs, noted above, petechiae counts on the heart surface and measurement of blue areas indicative of microvascular leakage after 5 min. The counts of PCs for all test scans are plotted in Fig. 3. For the higher frequencies, the PC response was evident only for higher PRPAs, and at much lower numbers than for 1.6 MHz. Examples of the macroscopic appearance of the hearts are shown in Figure 4. The petechiae appeared individually as small red spots, which could accumulate into a larger red region. An example of petechiae from a 1.6 MHz, 0 dB scan is shown in Figure 5. The petechiae count results are shown in Figure 6. The exposure-response trends are similar for the three frequencies, with an increasing threshold and decreasing magnitude for the higher frequencies. The PCs counted in the ECG signal during exposure were included in Fig. 2, and are of interest as a possible non-invasive indicator of cardiac injury. The PH count results are plotted against the PC counts in Figure 7. Some relationship is expected between the two bioeffects, because these display similar exposure response trends. The linear regressions shown in Figure 7 indicate some correlation, but with intercepts for zero PCs of 73 (r2= 0.87), 80 (r2= 0.50) and 109 (r2= 0.54 ). The non-zero intercepts imply that the two effects are not directly related (i. e., the PH can occur in the absence of PCs). The Evans blue leakage imparts a blue coloration to a region centered with the scan plane (other areas, such as the atria also appear blue), see Fig. 4. This local coloration gradually spreads and dissipates (apparently much like intramuscular delivery of a drug). The width of the blue regions is widest for the lowest frequency and narrowest at the higher frequencies due to the scan plane thickness (beam width, see Table 1). Exposure response data for the blue leakage areas are plotted in Fig 8. The induced permeability to the Evans blue is correlated with the petechiae counts, as shown in Figure 9. The linear regression had a slope of 0.091 mm2 per petechiae, with a small intercept of 2.3 mm2 (r2=0.76), which suggests the two effects are directly related, and that little or no dye leakage occurs without PH.
Figure 3.

The number of premature complexes observed during MCE for the range of attenuated peak rarefactional pressure amplitudes measured at each frequency. There were approximately 350 triggered scans for each 5 min of scanning-exposure, which sets the maximum possible number of PCs.
Figure 4.

Stereo microscope photographs of the anterior heart surface for a heart scanned at the maximum PRPA (top row) or sham (bottom row) at each frequency for the first part of the study. The petechial hemorrhages are evident as the reddish areas (but not individually distinct at this magnification), while the microvascular leakage is indicted by the extravasated Evans blue dye. Scale bars: 2 mm for all photographs.
Figure 5.

An example of petechiae on the surface of a heart scanned at 1.6 MHz, 0 dB, which had a petechiae count of 532. The upper photograph shows the effect in the scan plane (scale bar 2 mm) and the lower photograph at higher magnification (scale bar 1 mm) shows individual petechiae (arrows).
Figure 6.
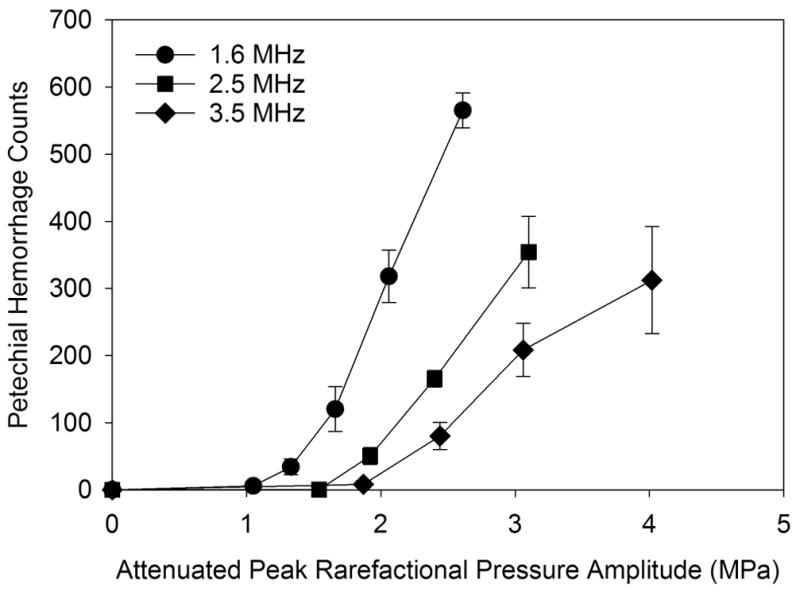
The numbers of petechial hemorrhages counted on the heart surface after exposure. The PRPA-response trend was an increase above an apparent threshold for each frequency with a relatively stronger response at the higher frequencies than the PC response shown in Fig. 2.
Figure 7.

The relationship between the petechial hemorrhage counts (PH) (Fig. 6) and the numbers of premature complexes (PCs) in the ECG (Fig. 3) for the rats with PH counts. The linear regressions on the data for the different frequencies have a nonzero intercept, indicating that PH can occur without PCs.
Figure 8.

The observed areas of microvascular leakage of the Evans blue dye after exposure. The exposure response trends appear similar to the petechial hemorrhage trends (Fig. 6).
Figure 9.

A scatter plot of all the Evans blue leakage areas against the numbers of petechial hemorrhages (PH). The approximately zero intercept of the linear regression (slope of 0.091 mm2 per petechiae, intercept of 2.3 mm2, r2=0.76) implies that little leakage occurs without PH.
For the second part of the study, plasma and heart samples were taken at 4 h post exposure. Sham and scanned groups of 5 rats were competed at each frequency. The PCs occurring during exposure were included in Fig. 3. In addition, petechial hemorrhages were counted, but were not included in Fig. 6, because the counting may have been effected by the 4 h time delay, and by the lack of Evans blue which was present for the exposure-response tests in part 1. The petechiae for the 0 dB tests were 524 ± 80 at 1.6 MHz, 295 ± 30 at 2.5 MHz, and 201 ± 75 at 3.5 MHz. No petechiae were seen in the shams. Plasma troponin I results are plotted in Fig. 10. Each mean was highly statistically significantly different from its respective sham (P<0.01). The log-log plot was used to illustrate the very strong negative dependence (exponent −3.24, r2=0.77) of plasma troponin on ultrasonic frequency.
Figure 10.

Plasma troponin results for the 0 dB maximal exposure at each frequency plotted as a log-log presentation. The regression shows a very strong negative correlation (exponential -3.24, r2=0.77) of plasma troponin I with ultrasonic frequency.
The histology of the 4 h heart samples prepared with H&E staining did not reveal any qualitatively new information about the nature of the microlesions that was previously reported (Miller et al. 2005a). The unit of injury was a capillary rupture with injured cardiomyocytes, and appeared to be the same for the three different frequencies. Immunohistochemical staining for fibrin/fibrinogen did not reveal any extensive thrombus formation, but appeared to stain scattered cardiomyocytes, as shown in Fig. 11. The same cells showed indications of hypercontraction in the companion H&E stained slide. The scattered distribution of the fibrinogen stained cells was similar to that of Evans blue stained cardiomyocytes found after 1 day (see below), which suggests that the fibrinogen staining identified lethally injured cardiomyocytes. The darkly stained cells detectable above the lighter background staining were scored blindly by counting the positive cells. The sham and test slides had 0 and 725 ± 259 (p<0.001) fibrinogen-stained cells, respectively, at 1.6 MHz, 50 ± 28 and 213 ± 198 (p<0.05) fibrinogen-stained cells, respectively at 2.5 MHz and 28 ± 36 and 95 ± 65 (p>0.05) fibrinogen-stained cells, respectively at 3.5 MHz. The unexpected stained cells scored in some shams likely were false-positive counts due to the relatively high background staining in some slides.
Figure 11.

Examples of histology results for H&E staining (Top) and fibrinogen immunohistochemistry (Bottom). Injured cardiomyocytes can be identified in the H&E staining by hypercontraction (disruption of the myocyte striations), and also appear to be stained by the fibrin/fibrinogen antibody. Scale bar: 50 μm.
The third part of this research characterized Evans blue vital staining of cardiomyocytes at 24 h in response to the MCE for a range of power settings at each frequency (Table 1). The unit of injury for Evans blue staining was a single stained cardiomyocyte in fluorescence microscopy, as described previously (Miller et al. 2005b), and was the same for the three different frequencies (i. e., cells were necrotic or not). The tests had groups of 6 rats, including sham tests for infusion of contrast without ultrasound, and for scanning without contrast. Both sham tests were negative for stained cells. The stained cell counts increased rapidly above apparent thresholds and were strongly dependent on ultrasonic frequency, as shown in Figure 12. This strong dependence was commensurate with the troponin I results, Fig. 10, that were presumably indicative of the overall level of cardiomyocyte death. The PCs during MCE exposure were similar to those shown in Fig. 3 for the first part of the study, but slightly less due to the reduced RCA dose. The stained cell scores are plotted against the PCs observed during MCE exposure in Figure 13. Interestingly, the 1.6 MHz PC data appears to have a clear relationship to the stained cells scores, with a near-zero score intercept of 39 cells, and a linear regression coefficient of determination of r2=0.86, while the small values of the 2.5 MHz and 3.5 MHz data apparently do not.
Figure 12.

The Evans blue stained cell scores increased above apparent thresholds for each frequency. These trends are similar in appearance to the premature complex trends shown in Fig. 3.
Figure 13.

A direct comparison of the stained cell scores at 24 h with the premature complexes during MCE for the third part of the study. The linear regression on the 1.6 MHz data shows a clear relationship between the two endpoints (r2=0.86). However, there was no clear relationship for the higher frequencies.
Apparent thresholds for the PH and stained cell scores were determined as the mean of the lowest PRPA setting with a statistically significant result and the next lower level. The thresholds are plotted in Figure 14 using a log-log scaling, and listed in Table 4. The regression lines were calculated to characterize the frequency (f) dependence of the PRPA thresholds (Pt) in terms of a coefficient (a) and exponent (b) (as for the MI):
| (1) |
Figure 14.

Thresholds for petechial hemorrhages and stained cells scores (cardiomyocyte necrosis) presented as a log-log plot against ultrasonic frequency. The linear regressions gave frequency-dependence exponents (see text) of 1.07 for petechial hemorrhages and 0.8 for the stained cell scores. For comparison, the dependence of cavitation nucleation for optimum nuclei in plasma (Apfel and Holland, 1991) is shown as the lower dotted line. The guideline upper limits MI=1.9 and MI=0.8 for diagnostic ultrasound and Definity contrast imaging are shown as the upper and lower dashed lines, respectively.
Table 4.
Peak rarefactional pressure amplitude (PRPA) thresholds for the PH and stained cell score endpoints. The values are the mean and standard deviation (of the mean) of lowest exposure PRPA with statistically significant effect relative to shams, and the next lower PRPA (i. e. from Table 1). Linear regression was used with the log-log plot (Fig. 13) to determine the coefficient (Coef.) and exponent (Expo.) of the frequency dependence of the thresholds (see text).
| Endpoint | 1.6 MHz | 2.5 MHz | 3.5 MHz | Coef. | Expo. | r2 |
|---|---|---|---|---|---|---|
| Petechial hemorrhages | 0.95±0.08 | 1.78±0.09 | 2.15±0.17 | 0.60 | 1.07 | 0.997 |
|
|
||||||
| Cardiomyocyte staining | 1.48±0.12 | 2.17±0.13 | 2.76±0.17 | 1.02 | 0.80 | 0.952 |
In the log-log plot, the linear regression provides the values of a and b as:
| (2) |
The values of a and b are also given in Table 4. The guideline upper limit on the MI=1.9 for diagnostic ultrasound is also plotted in Fig. 14, for which a equals 1.9 and b equals 0.5. For contrast enhanced imaging, the Definity package insert (Lantheus Medical Imaging, 2013) instructs the user to set the MI at or below MI=0.8 (i. e., a=0.8 and b=0.5), which is also displayed in Fig. 14.
DISCUSSION
In this study, the dependence of bioeffects on ultrasonic frequency was investigated for myocardial contrast echocardiography in rats. Contrast infusion was continuous with intermittent scans at relatively high MI, to simulate destruction-refill imaging of perfusion. Premature complexes (PC) in the ECG, petechial hemorrhages (PH) and Evans blue leakage on the surface of the hearts, plasma troponin I and staining of lethally injured cardiomyocytes were investigated for 1.6 MHz, 2.5 MHz and 3.5 MHz diagnostic ultrasound scanning. Increasing exposure response above an apparent threshold was observed for all endpoints, as is typical for ultrasound induced bioeffects. The effects strongly decreased with increasing ultrasonic frequency (Figs. 3, 6, 8, 10 and 12). The Evans blue leakage was associated with the petechial hemorrhage. The troponin I release was probably due to the lethal injury of cardiomyocytes that was shown by Evans blue staining the next day. Interestingly, immunohistochemistry demonstrated fibrin/fibrinogen staining within some cardiomyocytes after 4h. Possibly, capillary rupture and cardiomyocyte injury allowed plasma fibrinogen to enter the injured cells. The extravascular fibrinogen might bind to cellular antigens, such as intercellular adhesion molecule 1 (ICAM-1) related to early immune responses to injury (Boyd, et al. 2008), and would then be labeled immunohistochemically. There were no apparent regions with extensive thrombus formation, such as were seen for contrast enhanced diagnostic ultrasound of rat kidney in Bowman’s capsule (Miller et al. 2009) and pancreas around the effected islets (Miller et al. 2011a).
This decrease in effects with frequency was reflected in the increased thresholds (Fig. 14). The coefficient of the threshold frequency dependence was 0.6 for PH and 1.02 for cardiomyocyte death. The threshold frequency exponent was 1.07 for PH and 0.8 for cardiomyocyte death, compared to 0.5 (square root) for the MI. A limitation of this study was the narrow range (1.6–3.5 MHz, due to limitations of the diagnostic ultrasound machine) of frequencies tested, since greater confidence in the frequency dependence would be gained by a wider range. Nevertheless, the findings are relevant to safety issues. The limiting values of MI=1.9 for general diagnostic ultrasound, a nd MI=0.8 from the Definity package insert are also displayed in Fig. 14. Note that following the MI≤0.8 instruction allows a sonographer to largely avoid risk of the cardiac injury reported here. Previous research on contrast-enhanced diagnostic ultrasound in rat kidney demonstrated a similar picture for hemorrhage into the urinary space from glomerular capillaries. The coefficient and exponent of the frequency dependence were 0.49 and 1.05, respectively for diagnostic ultrasound (Miller et al. 2008b), slightly less than the result for PH in this study. Interestingly, the theoretical minimal threshold for cavitation in blood, calculated in support of the MI concept, gave a coefficient of 0.29 and an exponent of 0.76, which is much less than the thresholds for cavitational bioeffect reported here, see Fig. 14.
Previously, we noted that the stained cell score was strongly correlated with the induction of PCs in research with 1.5 MHz diagnostic ultrasound (Miller et al. 2005b) and with a 1.55 MHz laboratory ultrasound system (Miller et al. 2011b). This correlation was considered important because the PCs are clearly discernable clinically and might serve as a warning signal of a risk for myocardial injury. In this study, the PCs were indicative of the cardiomyocyte killing at 1.6 MHz, but not clearly so for the higher frequencies (Fig. 13). This suggests that the correspondence of PCs with myocyte injury might be limited, although the occurrence of stained cells and PCs was generally much smaller for the higher frequencies and a correspondence might become apparent for higher PRPAs and larger magnitudes of the effects. The occurrence of PH seemed to be less directly related to PCs (Fig. 7), suggesting that capillary extravasation effects, which might be exploited for drug delivery, can occur without concomitant parenchymal cell injury.
The measured unit of injury, capillary rupture or cardiomyocyte death, remained the same regardless of ultrasonic frequency. However, as frequency increases, the size of the optimum microbubble for cavitation nucleation becomes smaller. The MI was based on calculation of the dependence of the cavitation nucleation threshold on frequency (Apfel and Holland, 1991), without regard for bioeffects. The deviation from the frequency dependence of the MI seen here and in the previous study of kidney (Miller et al. 2008b) may reflect a requirement for a fixed volume of perturbation in order to produce a given unit of injury. Research investigation is ongoing to explain this dependence in terms of theoretical analysis of contrast microbubble behavior (Patterson et al. 2012). Recent progress in threshold concepts may yield improved theoretical insights (Church and Miller, 2016). The findings of this study should aid in creating a general theoretical model of microvascular injury, and in development of more cogent safety guidance in contrast enhanced diagnostic ultrasound.
Acknowledgments
This work was supported by PHS grant HL110990 awarded by the United States National Heart Lung and Blood Institute, DHHS. The information contained herein does not necessarily reflect the position or policy of the US government, and no official endorsement should be inferred.
Footnotes
Publisher's Disclaimer: This is a PDF file of an unedited manuscript that has been accepted for publication. As a service to our customers we are providing this early version of the manuscript. The manuscript will undergo copyediting, typesetting, and review of the resulting proof before it is published in its final citable form. Please note that during the production process errors may be discovered which could affect the content, and all legal disclaimers that apply to the journal pertain.
References
- Apfel RE, Holland CK. Gauging the likelihood of cavitation from short-pulse, low-duty cycle diagnostic ultrasound. Ultrasound Med Biol. 1991;17:179–85. doi: 10.1016/0301-5629(91)90125-g. [DOI] [PubMed] [Google Scholar]
- Boyd JH, Chau EH, Tokunanga C, Bateman RM, Haljan G, Davani EY, Wang Y, Walley KR. Fibrinogen decreases cardiomyocyte contractility through an ICAM-1-dependent mechanism. Crit Care. 2008;12(1):R2. doi: 10.1186/cc6213. [DOI] [PMC free article] [PubMed] [Google Scholar]
- Chapman S, Windle J, Xie F, McGrain A, Porter TR. Incidence of cardiac arrhythmias with therapeutic versus diagnostic ultrasound and intravenous microbubbles. J Ultrasound Med. 2005;24:1099–1107. doi: 10.7863/jum.2005.24.8.1099. [DOI] [PubMed] [Google Scholar]
- Chen S, Kroll MH, Shohet RV, Frenkel P, Mayer SA, Grayburn PA. Bioeffects of myocardial contrast microbubble destruction by echocardiography. Echocardiography. 2002;19:495–500. doi: 10.1046/j.1540-8175.2002.00495.x. [DOI] [PubMed] [Google Scholar]
- Church CC, Carstensen EL, Nyborg WL, Carson PL, Frizzell LA, Bailey MR. The risk of exposure to diagnostic ultrasound in postnatal subjects: nonthermal mechanisms. J Ultrasound Med. 2008;27:565–92. doi: 10.7863/jum.2008.27.4.565. [DOI] [PubMed] [Google Scholar]
- Church CC, Miller DL. Ultrasound Med Biol. 2016 in press. [Google Scholar]
- Lantheus Medical Imaging. Definity vial for perflutren lipid microsphere injectable suspension. Package Insert, NDC 11994–011. 2013 [Google Scholar]
- Li P, Cao LQ, Dou CY, Armstrong WR, Miller DL. Impact of myocardial contrast echocardiography on vascular permeability: An in vivo dose response study of delivery mode, ultrasound power and contrast dose. Ultrasound Med Biol. 2003;29:1341–1349. doi: 10.1016/s0301-5629(03)00988-8. [DOI] [PubMed] [Google Scholar]
- Li P, Armstrong WF, Miller DL. Impact of myocardial contrast echocardiography on vascular permeability: comparison of three different contrast agents. Ultrasound Med Biol. 2004;30:83–91. doi: 10.1016/j.ultrasmedbio.2003.09.004. [DOI] [PubMed] [Google Scholar]
- Nyborg WL, Carson PL, Carstensen EL, Dunn F, Miller MW, Miller DL, Thompson HE, Ziskin MC. Exposure Criteria for Medical Diagnostic Ultrasound: II. Criteria Based on All Known Mechanisms. (Report No. 140) National Council on Radiation Protection and Measurements; Bethesda Md: 2002. [Google Scholar]
- Miller DL, Quddus J. Diagnostic ultrasound activation of contrast agent gas bodies induces capillary rupture in mice. Proc Natl Acad Sci U S A. 2000;97:10179–84. doi: 10.1073/pnas.180294397. [DOI] [PMC free article] [PubMed] [Google Scholar]
- Miller DL, Li P, Gordon D, Armstrong WF. Histological characterization of microlesions induced by myocardial contrast echocardiography. Echocardiography. 2005a;22:25–34. doi: 10.1111/j.0742-2822.2005.03184.x. [DOI] [PubMed] [Google Scholar]
- Miller DL, Li P, Dou C, Gordon D, Edwards CA, Armstrong WF. Influence of contrast agent dose and ultrasound exposure on cardiomyocyte injury induced by myocardial contrast echocardiography in rats. Radiology. 2005b;237:137–143. doi: 10.1148/radiol.2371041467. [DOI] [PubMed] [Google Scholar]
- Miller DL, Driscoll EM, Dou C, Armstrong WF, Lucchesi BR. Microvascular permeabilization and cardiomyocyte injury provoked by myocardial contrast echocardiography in a canine model. J Am Coll Cardiol. 2006;47:1464–1468. doi: 10.1016/j.jacc.2005.09.078. [DOI] [PubMed] [Google Scholar]
- Miller DL, Dou C, Wiggins RC, Wharram BL, Goyal M, Williams AR. An in vivo rat model simulating imaging of human kidney by diagnostic ultrasound with gas-body contrast agent. Ultrasound Med Biol. 2007a;33:129–135. doi: 10.1016/j.ultrasmedbio.2006.07.033. [DOI] [PubMed] [Google Scholar]
- Miller DL, Li P, Dou C, Armstrong WF, Gordon D. Evans blue staining of cardiomyocytes induced by myocardial contrast echocardiography in rats: evidence for necrosis instead of apoptosis. Ultrasound Med Biol. 2007b;33:1988–1996. doi: 10.1016/j.ultrasmedbio.2007.06.008. [DOI] [PMC free article] [PubMed] [Google Scholar]
- Miller DL, Averkiou MA, Brayman AA, Everbach EC, Holland CK, Wible JH, Jr, Wu J. Bioeffects considerations for diagnostic ultrasound contrast agents. J Ultrasound Med. 2008a;27:611–632. doi: 10.7863/jum.2008.27.4.611. [DOI] [PubMed] [Google Scholar]
- Miller DL, Dou C, Wiggins RC. Frequency dependence of kidney injury induced by contrast-aided diagnostic ultrasound in rats. Ultrasound Med Biol. 2008b;34:1678–1687. doi: 10.1016/j.ultrasmedbio.2008.03.001. [DOI] [PMC free article] [PubMed] [Google Scholar]
- Miller DL, Dou C, Wiggins RC. Glomerular capillary hemorrhage induced in rats by diagnostic ultrasound with gas-body contrast agent produces intratubular obstruction. Ultrasound Med Biol. 2009;35:869–77. doi: 10.1016/j.ultrasmedbio.2008.10.015. [DOI] [PMC free article] [PubMed] [Google Scholar]
- Miller DL, Dou C, Sorenson D, Liu M. Histological observation of islet hemorrhage induced by diagnostic ultrasound with contrast agent in rat pancreas. PLoS One. 2011a;6(6):e21617. doi: 10.1371/journal.pone.0021617. [DOI] [PMC free article] [PubMed] [Google Scholar]
- Miller DL, Dou C, Lucchesi BR. Are ECG premature complexes induced by ultrasonic cavitation electrophysiological responses to irreversible cardiomyocyte injury? Ultrasound Med Biol. 2011b;37:312–320. doi: 10.1016/j.ultrasmedbio.2010.11.012. [DOI] [PMC free article] [PubMed] [Google Scholar]
- Miller DL, Dou C, Owens GE, Kripfgans OD. Optimization of ultrasound parameters of myocardial cavitation microlesions for therapeutic application. Ultrasound Med Biol. 2014;40:1228–1236. doi: 10.1016/j.ultrasmedbio.2014.01.001. [DOI] [PMC free article] [PubMed] [Google Scholar]
- Miller DL, Dou C, Lu X, Zhu YI, Fabiilli ML, Owens GE, Kripfgans OD. The use of theranostic strategies in myocardial cavitation-enabled therapy. Ultrasound Med Biol. 2015a;41:1865–75. doi: 10.1016/j.ultrasmedbio.2015.03.019. [DOI] [PMC free article] [PubMed] [Google Scholar]
- Miller DL, Dou C, Raghavendran K. Anesthetic techniques influence the induction of pulmonary capillary hemorrhage during diagnostic ultrasound scanning in rats. J Ultrasound Med. 2015b;34:289–297. doi: 10.7863/ultra.34.2.289. [DOI] [PMC free article] [PubMed] [Google Scholar]
- Miller DL, Lu X, Fabiilli M, Dou C. Do anesthetic techniques influence the threshold for glomerular capillary hemorrhage induced in rats by contrast enhanced diagnostic ultrasound? J Ultrasound Med. 2016;35:373–380. doi: 10.7863/ultra.15.05015. [DOI] [PMC free article] [PubMed] [Google Scholar]
- Pathan F, Marwick TH. Myocardial perfusion imaging using contrast echocardiography. Prog Cardiovasc Dis. 2015;57:632–43. doi: 10.1016/j.pcad.2015.03.005. [DOI] [PubMed] [Google Scholar]
- Patterson B, Miller DL, Johnsen E. Theoretical microbubble dynamics in a viscoelastic medium at capillary breaching thresholds. J Acoust Soc Am. 2012;132:3770–3777. doi: 10.1121/1.4763993. [DOI] [PubMed] [Google Scholar]
- Porter TR, Xie F. Contrast echocardiography: latest developments and clinical utility. Curr Cardiol Rep. 2015;17:569. doi: 10.1007/s11886-015-0569-9. [DOI] [PubMed] [Google Scholar]
- O’Brien PJ, Smith DE, Knechtel TJ, Marchak MA, Pruimboom-Brees I, Brees DJ, Spratt DP, Archer FJ, Butler P, Potter AN, Provost JP, Richard J, Snyder PA, Reagan WJ. Cardiac troponin I is a sensitive, specific biomarker of cardiac injury in laboratory animals. Lab Anim. 2006;40:153–171. doi: 10.1258/002367706776319042. [DOI] [PubMed] [Google Scholar]
- Okazaki J, Ishikura F, Asanuma T, Otani K, Beppu S. Premature ventricular contraction during myocardial contrast echocardiography: relationship with imaging method, acoustic power and dose of contrast agent. J Cardiol. 2004;43:69–74. [PubMed] [Google Scholar]
- Skyba DM, Price RJ, Linka AZ, Skalak TC, Kaul S. Direct in vivo visualization of intravascular destruction of microbubbles by ultrasound and its local effects on tissue. Circulation. 1998;98:290–293. doi: 10.1161/01.cir.98.4.290. [DOI] [PubMed] [Google Scholar]
- Vancraeynest D, Kefer J, Hanet C, Fillee C, Beauloye C, Pasquet A, Gerber BL, Philippe M, Vanoverschelde JL. Release of cardiac bio-markers during high mechanical index contrast-enhanced echocardiography in humans. Eur Heart J. 2007;28:1236–41. doi: 10.1093/eurheartj/ehm051. [DOI] [PubMed] [Google Scholar]
- Vancraeynest D, Havaux X, Pasquet A, Gerber B, Beauloye C, Rafter P, Bertrand L, Vanoverschelde JL. Myocardial injury induced by ultrasound-targeted microbubble destruction: evidence for the contribution of myocardial ischemia. Ultrasound Med Biol. 2009;35:672–9. doi: 10.1016/j.ultrasmedbio.2008.10.005. [DOI] [PubMed] [Google Scholar]
- van Der Wouw PA, Brauns AC, Bailey SE, Powers JE, Wilde AA. Premature ventricular contractions during triggered imaging with ultrasound contrast. J Am Soc Echocardiogr. 2000;13:288–294. doi: 10.1067/mje.2000.103865. [DOI] [PubMed] [Google Scholar]
- Wible JH, Jr, Galen KP, Wojdyla JK, Hughes MS, Klibanov AL, Brandenburger GH. Microbubbles induce renal hemorrhage when exposed to diagnostic ultrasound in anesthetized rats. Ultrasound Med Biol. 2002;28:1535–1546. doi: 10.1016/s0301-5629(02)00651-8. [DOI] [PubMed] [Google Scholar]
- Wei K, Jayaweera AR, Firoozan S, Linka A, Skyba DM, Kaul S. Quantification of myocardial blood flow with ultrasound-induced destruction of microbubbles administered as a constant venous infusion. Circulation. 1998;97:473–83. doi: 10.1161/01.cir.97.5.473. [DOI] [PubMed] [Google Scholar]
- Zhu YI, Miller DL, Dou C, Kripfgans OD. Characterization of macrolesions induced by myocardial cavitation-enabled therapy. IEEE Trans Biomed Eng. 2015;62:717–727. doi: 10.1109/TBME.2014.2364263. [DOI] [PMC free article] [PubMed] [Google Scholar]