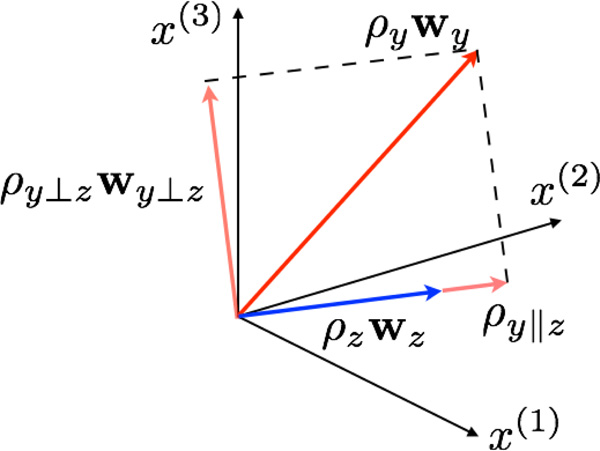
Figure 1.
Regressing-out procedure in the multivariate setting. The effect of z is regressed out to determine the z-normalized effect of y. The axes represent the three diffusion parameters in this toy example. The red vector is the effect of y when z is ignored and the blue vector is the effect of z when y is ignored. The parallel and orthogonal components of the z-normalized effect of y are shown in pale red.

