Abstract
Diagnostic ultrasound can induce pulmonary capillary hemorrhage (PCH) in rats and display this as “comet-tail” artifacts (CTA) after a time delay. To test the hypothesis that no PCH occurs for brief scans, anesthetized rats were scanned using a 6 MHz linear array for different durations. PCH was characterized by ultrasound CTAs, micro-computed tomography (µCT) and measurements of fixed lung tissue. The µCT images showed regions of PCH, sometimes penetrating the entire depth of a lobe, which were reflected in the fixed tissue measurements. At −3 dB power, PCH was substantial for 300 s scans but not significant for 25 s scans. At 0 dB, PCH was not strongly dependent on scan durations of 300 s to 10 s. Contrary to the hypothesis, CTAs were not evident during most 10 s scans (p>0.05), but PCH was significant (p=0.02), indicating that PCH could occur without evidence of the injury in the images.
Keywords: Pulmonary ultrasound, Comet tail artifact, Pulmonary capillary hemorrhage, Pulmonary micro-computed tomography, Diagnostic ultrasound safety
Introduction
Diagnostic ultrasound can induce capillary hemorrhage in mammalian lung, depending on physical and biological conditions. Pulmonary capillary hemorrhage (PCH) induced by ultrasound has been studied intermittently since its discovery by Child et al. (1990). Over this period, the use of trans-thoracic ultrasound for pulmonary examination has grown to be an important tool for diagnosis in the point of care settings of emergency and intensive care (Volpicelli, 2013; Lichtenstein, 2014). Features in the diagnostic images, such as comet-tail artifacts (CTAs), are indicative of diseases involving the alveolar-interstitial interphase, pulmonary edema and pulmonary effusion, among other problems. When PCH occured, the causative diagnostic ultrasound image displayed the development of PCH during scanning in rats as the initiation and growth of CTAs (Miller, 2012), a remarkable exhibition of the power of the ultrasonic energy transmitted into the chest and of the sensitivity of ultrasonic imaging to detect pulmonary injury. The PCH bioeffect is not yet fully understood relative to the complex mix of clinical diagnostic ultrasound modes and patient conditions examined. More information is urgently needed to develop the best possible safety advice for sonographers.
Early research showed that the ultrasonically induced PCH occurs in mice, rats and pigs (American Institute of Ultrasound in Medicine, 2000; Church et al. 2008). PCH can be characterized by a threshold value of the ultrasonic pulse pressure amplitude in MPa (or other relevant exposure metric) for a specific set of experimental conditions. PCH thresholds have been assessed for variations in pulsed ultrasound beam width, pulse length, frequency, total on-time and exposure duration (Church and O’Brien, 2007). The age of the subject has also been evaluated as a risk factor, with some indication of increased sensitivity with age (Dalecki et al. 1997; Obrien et al. 2003). Recently, we discovered that the PCH was strongly influenced by anesthesia methods in our animal tests (Miller et al. 2015a), which adds complex biological parameters into the mix of physical parameters relevant to the PCH problem. Most early studies were performed using laboratory pulsed ultrasound systems configured for relevance to diagnostic ultrasound. The results of a comparison between PCH from diagnostic and laboratory systems indicated that the diagnostic scanning results were comparable with the earlier findings, which provides a large and reasonably consistent data base (Miller et al. 2015b). The diagnostic ultrasound frequency does not strongly influence the threshold for PCH (Miller et al. 2015c), which questions the use of the on-screen Mechanical Index as a safety index for gauging the likelihood of PCH.
In addition to the dose-response trends for ultrasonic output parameters, the exposure duration appears to be a key dosage parameter (Miller et al. 2015b). For example, a 2.0 MPa threshold for 2.8 MHz, 11.6 µs pulses, 1 ms interval and 10 s exposure duration (O’Brien et al. 2003) was substantially higher than our 0.75 MPa threshold at 1.5 MHz for 10 µs pulses, 25 ms interval and 300 s exposure duration, even though the numbers of pulses delivered and total on-time were similar. This observation suggests an important role for the exposure duration in the PCH threshold, an unexpected finding because the longer duration greatly reduced the average intensity of the energy delivered. However, for constant pulsing parameters, Raeman et al. (1996) found that the threshold for PCH in mice was about the same for 20 s to 300 s exposures. Interestingly, for diagnostic ultrasound, the influence of exposure duration on outcome may be directly determinable during scanning, based on the observation of the initiation and growth of CTAs in the ultrasound image. Previous work (Miller, 2012) showed variation of the time delay between the start of scanning and the initiation of CTAs in the image for 5 min scans, which suggests that brief scans might allay the risk of injury. There may be an exposure-scan duration threshold for PCH. Indeed, monitoring the ultrasound image itself for CTA initiation might be a plausible safety strategy. However, for different ultrasonic frequencies, the detection of CTAs was found to be somewhat difficult for lower frequencies with lower resolution (Miller et al. 2015c).
This study was undertaken to provide information on the dependence of PCH on different exposure-scan durations, rather than just the time of CTA initiation during 5 min scans. PCH areas on the lung surface were measured as before, but were considered inadequate to fully describe the PCH impact. The severity of some pulmonary conditions may be indicated by the length of the comets (Gargani et al. 2009; Weitzel et al. 2015). Also, the number of CTAs (also called “B lines”) appears to have a correlation with the extent of parenchymal changes in CT images (Martelius et al. 2016). However, the CTAs do not actually provide quantitative data on PCH depth. The nature and depth of the PCH regions inside the lung were evaluated in the current study. Histological evaluations can provide information on depth, but do not clarify the nature of the PCH. To clarify the precise extent of the PCH relative to its appearance in radiological observation, micro-computed tomography (µCT) images were obtained. In addition, PCH depths and volumes were measured in fixed tissue samples and confirmed as realistic for assessment of in situ PCH by comparison to the µCT images.
Materials and Methods
All in vivo animal procedures were conducted with the approval and guidance of the University Committee on Use and Care of Animals (UCUCA) of the University of Michigan. In this study, a total of 46 female rats (Sprague Dawley, Charles River, Wilmington, MA, USA) weighing an average of 257± 23 gm were tested, with one rat lost from the study due to anesthetic death. Anesthesia was induced by intraperitoneal injection (IP) of Ketamine (75 mg/kg) plus dexmedetomidine (0.5 mg/kg). The specific anesthesia techniques can be an important factor in studies of ultrasound induced PCH (Miller et al. 2015a). Most PCH studies in rodents have used ketamine and xylazine (a veterinary sedative) for anesthesia. Here, dexmedetomidine, a common human clinical sedative and anxiolytic (Mason et al. 2011) which gives similar PCH results even in the normal human dose range (Miller et al. 2016), replaced xylazine in the anesthetic mixture. The right thorax of all rats was shaved and depilated for ultrasound transmission. The rats were mounted on a plastic board and partly immersed in a 38 °C degassed water bath together with the ultrasound probe. This exposure method has reliable ultrasound coupling, and maintains the body temperature of the rats. Physiological data was collected at the time of ultrasound scanning using a pulse oximeter (SurgiVet V3395 TPR, Smiths Medical Inc. St Paul, MN USA), and visual observation of respiration. The average values were: 244 ± 12 bpm heart rate, 80 ± 4 % SpO2, and 73 ± 15 breaths per minute. Anesthesia was maintained until sacrifice for sample collection 1 h after scanning.
Ultrasound scanning
A GE Vivid 7 Dimension (GE Vingmed Ultrasound, Horten NO) ultrasound machine was used for imaging and exposure scanning. The 7L probe was used in B Mode at the 6.0 MHz setting with 4 cm depth, 1.56 cm focus and 63.1 frames per s (fps). For one group of rats, the frames were triggered intermittently at 5 fps. The probe was aimed with a −20 dB power setting approximately horizontally at the right side of the rat to position the lung surface at an image depth of 1.25–1.75 cm at the level of the cranial or middle lobes, and avoiding ribs as much as possible.
For a test scan, the power setting was raised to the desired level of 0 dB or −3 dB, and timed for the desired duration. To accurately time 10 s scans, a paddle was inserted between the probe and the rat while the power was raised, and then quickly removed for scanning with the ultrasound stopped by the freeze control after 10 s. The in situ exposure parameters at the depth of the lung surface were estimated for the different power settings by measurements with calibrated hydrophone (HGL0200, Onda, Sunnyvale, CA, USA). Measurements were made of the ultrasound pulses attenuated by five different rat chest wall samples, and are listed in Table 1. The center frequency was estimated from the duration of one cycle at −20 dB to be 5.8 MHz. The pulse repetition frequency was 12.2 kHz for the 350 ns duration pulses. The active width of the probe was 4.8 cm and the – 6dB thickness (beam width) of the scan plane was 2.2 mm.
Table 1.
In situ exposure parameters for the three power settings used: PCPA, peak compressional pressure amplitude, PRPA, peak rarefactional pressure amplitude, PMPA, peak mean pressure amplitude, and ISPPA, spatial peak, pulse peak intensity, MIos on screen Mechanical Index.
| Setting dB |
MIos | PCPA MPa |
PRPA MPa |
PMPA MPa |
ISPPA W cm−2 |
|---|---|---|---|---|---|
| 0 | 1.2 | 5.4 ± 1.5 | 3.3 ± 0.43 | 4.38 ± 0.94 | 473 ± 161 |
| −3 | 0.8 | 3.4 ± 1.1 | 2.4 ± 0.34 | 2.92 ± 0.71 | 220 ± 87 |
| −20 | 0.12 | 0.36 ± 0.08 | 0.34 ± 0.06 | 0.35 ± 0.07 | 3.0 ± 1.2 |
Micro-Computed Tomography
Although ultrasound is useful for examining the surface of the lung, plane film x-rays or CT scanning remains the gold-standard for evaluation of pulmonary contusion (see, for example, Miller (2006)). µCT was performed at the University of Michigan Center for Molecular Imaging using a SkyScan1176 scanner (Bruker microCT, 2550 Kontich, Belgium). The µCT produced stacks of 1,360 images that were 1016 by 1016 pixels with 35 µm resolution, and 35 µm spacing. µCT Imaging was performed on the thorax of 12 rats, including 2 shams, 5 scanned for 100s at 0 dB and 5 scanned for 300 s at 0 dB, as listed in Table 1. The ultrasound-scanned rats were transported to the University of Michigan Center for Molecular Imaging for the µCT scanning, which introduced a time delay of about 1 h between ultrasound and µCT imaging. The rats were sacrificed a few min before µCT scanning and the trachea was intubated. During scanning the lungs were minimally inflated with 20 cm H2O of air. At the conclusion of scanning, the tracheal tube was tied off to prevent alveolar collapse and maintain lung morphology.
The µCT data was processed to determine the approximate size of the PCH lesions using image analysis software (CT Analyzer V.1.14.1, Bruker microCT, 2550 Kontich, Belgium). The 16 bit per pixel images were first converted to 8 bit, including limiting the range of Hounsfield units to −500 to −1000 (from −1,000 to +1,000) in order to display the lung tissue with good contrast. The PCH was depicted clearly for the two groups, and its identification was verified by comparison to shams, which helped in the appraisal of light and dark artifacts of the µCT images. The artifacts produced some uncertainty in the precise localization of the PCH, especially near ribs and sternum, and precluded the use of the µCT imaging for low-effect (threshold) conditions. The right lung volume containing the PCH was localized to within a rectangular box, typically 20 mm by 20 mm (x,y) in each image and 24 mm (z) deep. At 20 slice (0.69 mm) intervals, the center of the PCH at the chest wall was located by x,y,z coordinates, and then the depth, surface width and area of the PCH in the slice was measured. This allowed calculation of the approximate area of the PCH on the lung surface as the sum (for all the slices measured) of the surface width times 0.69 mm, and the volume of the PCH as the sum of the area times 0.69 mm. This process was repeated for each identifiable PCH volume, for both the cranial and medial lobes if needed.
Lung Sample Fixation and Scoring
For rats not receiving µCT scanning, sacrifice as delayed for 1 h to approximate the delay-to-sacrifice for the µCT scanned rats. For all rats, the trachea was tied off with an air pressure of 20 cm H2O and the entire closed thorax was isolated and immersed in neutral buffered formalin. This procedure was intended to fix the lungs as closely as possible in the positions and volumes they occupied during ultrasound and µCT scanning. However, this was not entirely successful, due to some re-arrangement of the lungs between the vertical mounting in the water bath for ultrasound and the horizontal position in the µCT machine.
After fixation the lungs were dissected from the thorax and placed into 70% ethanol for subsequent handling. The lungs were photographed with a stereo microscope and camera (Spot Flex, Diagnostic Instruments Inc., Sterling Heights, MI USA). The surface length, width and area of the PCH was then measured with image analysis software (Spot v. 5.1, Diagnostic Instruments, Inc., Sterling Heights, MI USA). The PCH regions could be identified readily by visual inspection with the stereo microscope. Each lobe with PCH was isolated and the length of the PCH was sliced into ~ 2 mm thick cross-sections. Each cross section was photographed and measured to obtain the depth of hemorrhage visible in the section. These data were used to determine the mean depth of the PCH and then to calculate the PCH volume as the product of mean depth and surface area. This method for depth and volume determination was similar to that used by Zachary et al. (2001), except multiple measurements were needed here to characterize the long narrow PCH produced by B mode scanning, compared to a single fixed beam exposure. In addition, the PCH here seemed to remain about the same width with depth, rather than forming a conical shape (Zachary et al, 2001). A few sections were selected for histology and were processed as paraffin sections with hematoxylin and eosin staining.
Measured endpoints and experimental plan
The testing was arranged in 8 groups of 5 rats, see Table 2. The conditions were set to observe the PCH produced by the maximum power setting (0 dB) for exposure durations of 300 s (i. e., the 5 min duration used previously), 100 s, 25 s and 10 s. The influence of duration was also assessed for 300 s and 25 s durations at −3 dB. In addition, a 300 s duration scan condition utilized intermittent imaging at 5 fps (Group H). This condition delivered 1,500 frames at 0 dB over 300 s, compared to 1,577 frames (i. e. approximately the same number) at 0 dB over 25 s for Group E, and 18,900 at 0 dB over 300 s for Group B. These tests were intended to assess the relative influence of the total number of frames delivered and the overall scan duration. µCT scanning was conducted to assess the appearance of the PCH in CT imaging and to provide in situ measurements of the PCH shape and volume for comparison to the fixed lung samples. The µCT scanning was conducted only for 0 dB for 300 s and 100 s, because the sensitivity of the µCT was less than that of simple visual observation of the effected lungs. Two shams were also scanned to aid in identification of image features or artifacts not associated with PCH. Statistical comparisons between groups were performed using SigmaPlot for Windows V. 11.0 (Systat Software Inc., San Jose CA, USA), with statistical significance assumed at P<0.05.
Table 2.
Conditions set for the eight groups of 5 rats. The power setting was in dB on the machine (exposure parameters are listed in Table 1). The setting for frames per second (fps) was the normal B mode value, except the intermittent trigger feature was used to set the 5 fps condition.
| Group | Power decibels |
Durations | fps s−1 |
µCT n |
|---|---|---|---|---|
| A | sham | 300 | 63.1 | 2 |
| B | 0 | 300 | 63.1 | 5 |
| C | −3 | 300 | 63.1 | - |
| D | 0 | 100 | 63.1 | 5 |
| E | 0 | 25 | 63.1 | - |
| F | −3 | 25 | 63.1 | - |
| G | 0 | 10 | 63.1 | - |
| H | 0 | 300 | 5 | - |
Results
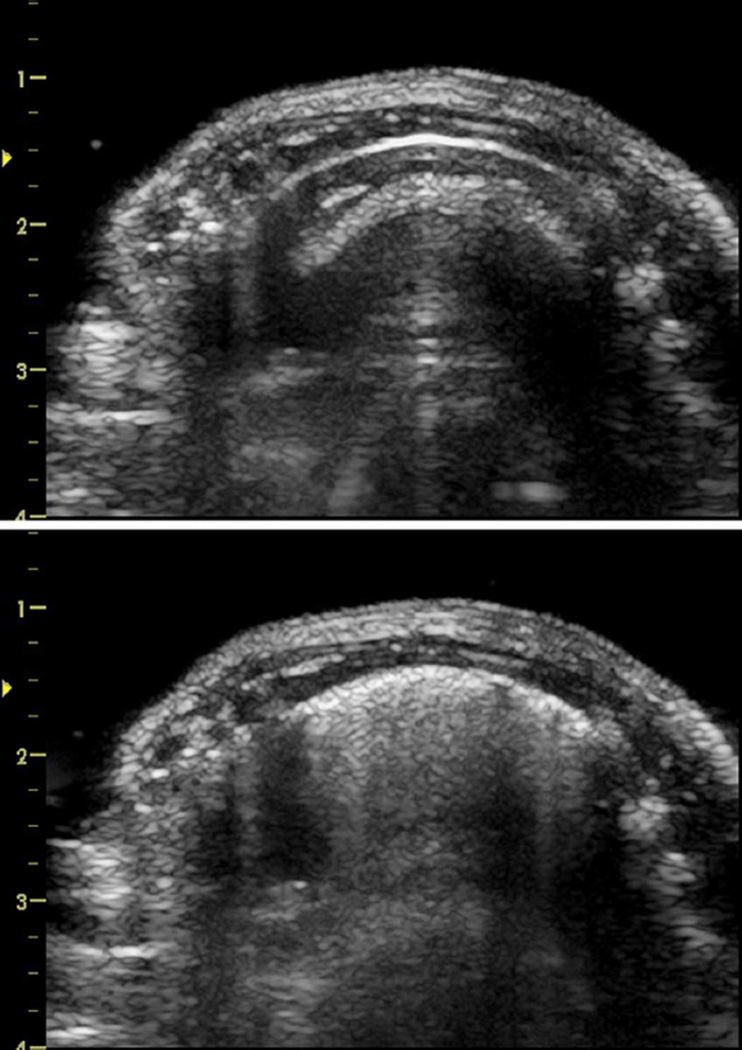
The ultrasound images displayed the progression of the PCH, for which the length of CTAs across the image approximated the length of the PCH on the lung surface. An example of the ultrasound images before and after a 0 dB scan for 100 s (Group D) are shown in Fig. 1. The mean widths of the bright-line lung surface image are listed in Table 3 for all groups.
Figure 1.
Ultrasound images of the right side of a rat before (top) and after (bottom) scanning at 0 dB for 100s (group D). The sternum and spine are on the left and right of the images, respectively. The bright curved line about 5 mm deep into the thorax is the lung surface, and the deeper features in the images are multiple reflection artifacts. The bottom image shows the comet tail artifacts which grow downward from the bright surface image during scanning and represent multiple scattering from regions with pulmonary capillary hemorrhage.
Table 3.
Data for the length of the PCH on the lung surface from the width of comet tail artifacts (CTA) on the bright line (BL) image of the lung surface and from macroscopic measurement of the PCH seen on the fixed lung.
| Group | BL mm |
CTA width mm |
PCH Length mm |
p |
|---|---|---|---|---|
| A | 16.3 ± 2.9 | 0 | 0 | - |
| B | 20.5 ± 2.3 | 19.1± 3.1* | 18.4 ±3.7* | nsd |
| C | 19.7 ± 2.3 | 15.2 ± 2.3* | 16.2 ± 6.6* | nsd |
| D | 20.4 ± 1.7 | 19.0 ± 1.5* | 16.1 ± 2.8* | nsd |
| E | 18.2 ± 1.6 | 14.1 ± 3.4* | 13.0 ± 5.3* | nsd |
| F | 15.8 ± 1.7 | 0.6 ± 1.3 | 1.7 ± 2.0 | nsd |
| G | 16.3 ± 3.2 | 2.4 ± 2.5 | 12.7 ± 2.8* | <0.001 |
| H | 18.8 ± 3.6 | 10.5 ± 7.4* | 10.6 ± 6.3* | nsd |
Values which were significantly different from shams (p<0.05) are marked *. In addition, the statistical p value of comparisons of the CTA width and PCH length are listed, with no significant difference (nsd) for p>0.05.
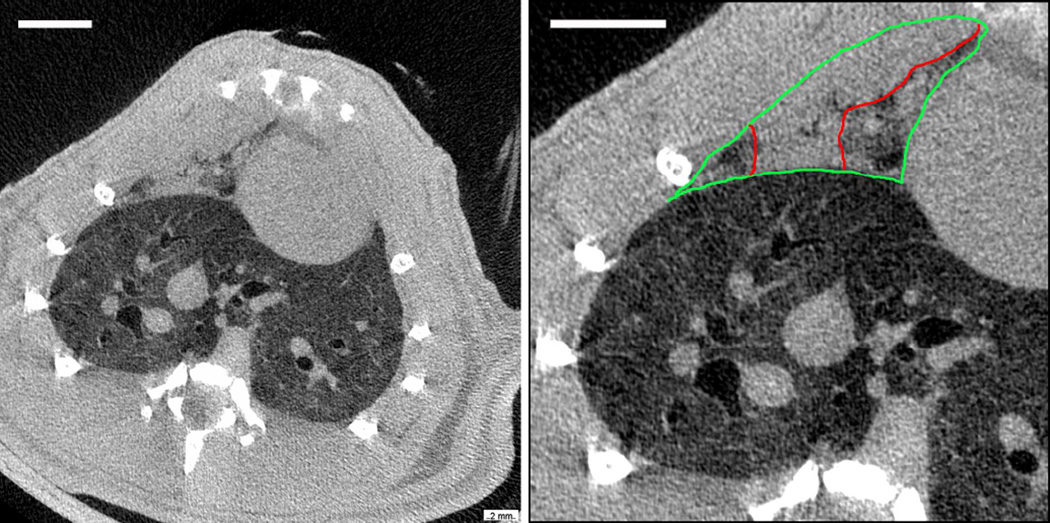
A µCT image is shown in Fig. 2 of the same lung shown in Fig. 1 by ultrasound. The µCT images are shown in the radiology configuration (the right lung is on the left side of the image). The PCH is evident in the right medial lobe at the anterior chest wall, while the caudal lobe appears to be free of PCH. The PCH image level and texture was similar to the heart or chest wall. The medial lobe is outlined to show the indistinct pleural boundary between the heart and chest wall and the perceived borders of the PCH are also shown. Although airways often were apparent within the PCH area, the blood vessels were not. The µCT images included the entire lung volume and some tissue above and below the lungs; however, volume rendering of the PCH lesions was found to be difficult, due to the lack of contrast difference between the PCH, blood and tissue, and was not used for quantification. A video made up of µCT images containing the entire PCH shown in Fig. 2 is presented as Supplemental Data 1 so that the variation of its appearance with axial position can be appreciated. The appearance of PCH in the µCT images was not unlike clinical CT images of post-traumatic human pulmonary contusion.
Figure 2.
Micro-computed tomography (µCT) images of the same rat shown in Fig. 1, presented in radiology format (i. e. the right side of the rat is on the left). The left image is a cross section of the thorax showing bone in white, tissue as light grey and lung as dark grey (air is black, scale bar 5 mm). The right image shows a close up of the right lung with the large caudal lobe appearing normal. The medial lobe (outlined in green) shows pulmonary capillary hemorrhage (outlined in red) throughout most of the lobe (scale bar 5 mm).
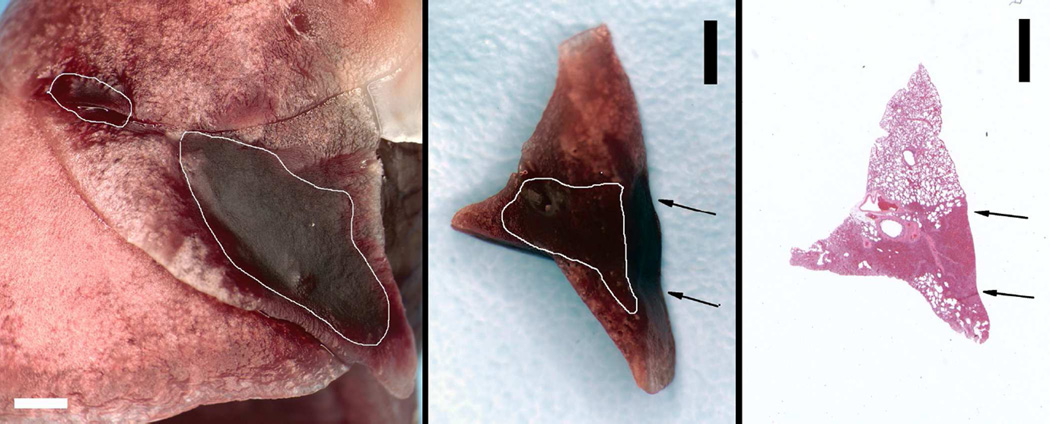
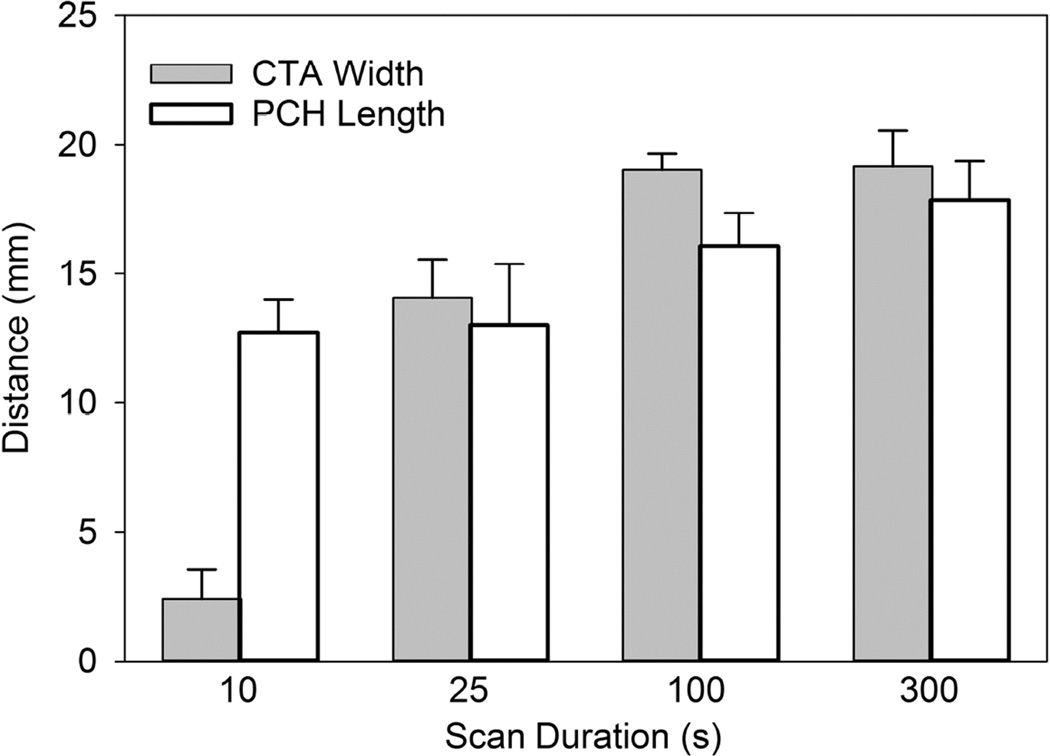
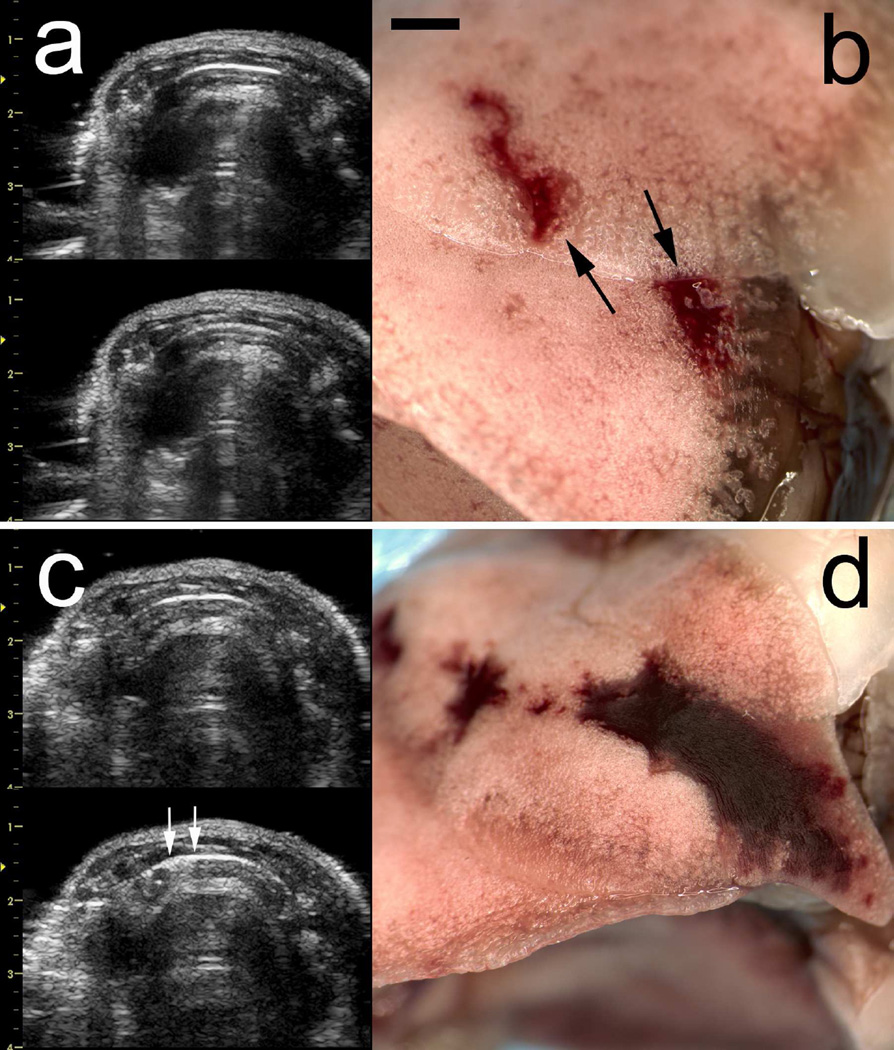
The fixed lung sample for the same test as shown in Fig. 1 and 2 is shown in Fig. 3. The PCH is outlined to more clearly display the two surface areas. The PCH lengths were measured on the photographs and summed to obtain total lengths for comparison to the lengths of CTAs in the ultrasound images and are listed in Table 3. Figure 4 compares the CTA and PCH lengths for the 0 dB tests at different durations. The CTAs appeared to be diagnostic for the length of PCH on the lung surface, except for the brief 10 s scans (group G). All of the lungs from group G showed clear PCH, but only three of the ultrasound images contained clear CTAs. Two examples of group G are shown in Fig. 5, for which the smaller PCH did not appear in the ultrasound image. A video clip recorded during a 10 s scan is presented as Supplemental Data 2 to illustrate the CTA development.
Figure 3.
The fixed lung sample for the tissues shown in Fig. 1 and Fig. 2. The left image of the lung surface shows the large pulmonary capillary hemorrhage (PCH) in the medial lobe, and a smaller PCH area in the cranial lobe outlined in white (scale bar 2 mm). A cross-section slab of the medial lobe PCH is shown in the middle picture with the area of apparent hemorrhage outlined in white (scale bar 2 mm). The slab was about 2 mm thick and the front surface is visible in the image. The arrows show the incident direction of the ultrasound. The right picture shows a histological section with hematoxylin and eosin staining made from the cross section slab with the PCH area clearly visible (scale bar 2 mm).
Figure 4.
The length of the comet tail artifacts across the bright line image (see Fig. 1) is compared to the length of the pulmonary capillary hemorrhage (PCH) region measured along the scan plane seen in the fixed tissue (see Fig. 3). The ultrasound image was accurately diagnostic of the PCH seen on the surface except for the 10 s duration scans, for which the PCH was not always detected.
Figure 5.
A comparison of two results for 10 s scans (scale bar 2 mm). The end-of-scan image (a, left-bottom) does not show any discernable comet tail artifacts relative to the start-of-scan image (a, left-top) associated with the pulmonary capillary hemorrhage (PCH) in (b). The PCH (a, right) was partly on the cranial and partly on the medial lobes, which shifted slightly during handling as indicated by the arrows. The PCH (b right) was sufficiently large to appear in the end-of-scan ultrasound image (b, right-bottom) as CTAs (indicated by the arrows).
The PCH volume was also characterized by measurements of the fixed lungs. Measurements of the depth, area and calculated volume of the PCH are listed in Table 4 for all groups. The surface length and area of PCH were measured on photographs and totaled for each sample. The PCH area was not significantly different from shams for group F (−3 dB, 25 s), with only 3 of the 5 tests giving any detectable PCH, but was significantly different for all the other groups, including group G (0 dB, 10 s). The depth of the PCH regions was obtained by cutting thick cross sections and measuring the apparent hemorrhage depth in photographs. An example of a slab-cross section cut from the medial lobe PCH is shown in Fig. 3, together with a histological image made from the slab. The ultrasound scan impinged upon the surface with the outlined PCH penetrating essentially the entire depth of the lobe for this example.
Table 4.
Data for the PCH surface area, depth and volume (mean depth times surface area) from measurement of fixed lung tissue. These parameters as derived from µCT images are also given for Groups B and D. The µCT and fixed tissue measurements were in approximate agreement, with no significant differences.
| Fixed Tissue Measurements | µCT Measurements | |||||
|---|---|---|---|---|---|---|
| Group | Depth mm |
Area mm2 |
Volume mm3 |
Depth mm |
Area mm2 |
Volume mm3 |
| A | 0 | 0 | 0 | - | - | - |
| B | 1.46 ± 0.29 | 46.6 ± 16.5 | 69.3 ± 45.7 | 1.29 ± 0.23 | 49.3 ± 16.1 | 65.9 ± 32.9 |
| C | 2.24 ± 0.52 | 37.4 ± 15.7 | 77.7 ± 26.4 | - | - | - |
| D | 2.43 ± 0.51 | 41.0 ± 16.5 | 96.7 ± 33.8 | 2.41 ± 0.89 | 65.0 ± 25.9 | 128 ± 71.1 |
| E | 1.89 ± 0.62 | 27.1 ± 13.5 | 47.2 ± 19.1 | - | - | - |
| F | 0.53 ± 0.50 | 3.1 ± 2.9 | 3.1 ± 3.3 | - | - | - |
| G | 1.84 ± 1.04 | 18.9 ± 5.4 | 38.5 ± 29.8 | - | - | - |
| H | 1.89 ± 0.93 | 21.4 ± 15.6 | 43.4 ± 35.6 | - | - | - |
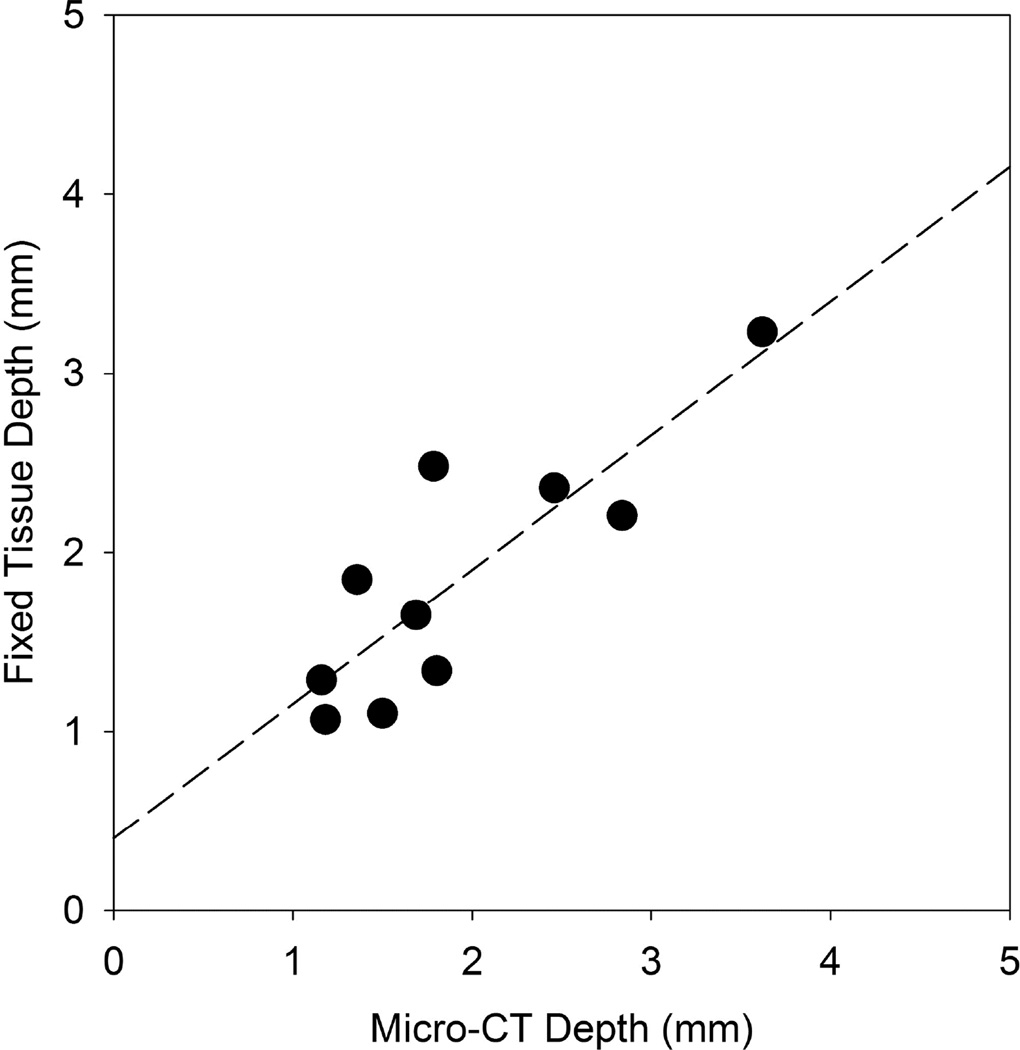
The findings from the µCT images and fixed tissue photographs were in approximate agreement, with no significant differences between depth, area and volume measurements. The measurements were quite variable; for example, the mean PCH volume for the 100 s duration was paradoxically larger than for the 300 s duration (although not significantly different). Some of the variability was due to chance variations in the scanned region. The PCH depth often penetrated the entire thickness of the lobe but this occurred in thin or thick regions of the lobes, yielding low or high volume values even though the impact might be considered to be the same (i. e. penetration of the lobe). The observation of the bright red PCH areas on the lung surface was the most sensitive method to detect the bioeffect (e. g. for threshold determinations), and small PCH regions would not be identifiable in the µCT images. The depth measurements were the important new parameter for this study. The depths found from the µCT and tissue are compared in Fig. 6 and have a slope of 0.75 and coefficient of determination r2=0.72.
Figure 6.
A comparison of the pulmonary capillary hemorrhage depths determined from the fixed tissue samples and from the micro-computed tomography (µCT) images. The two measurements were in reasonable agreement: the linear regression has a slope of 0.75 and coefficient of determination r2=0.72.
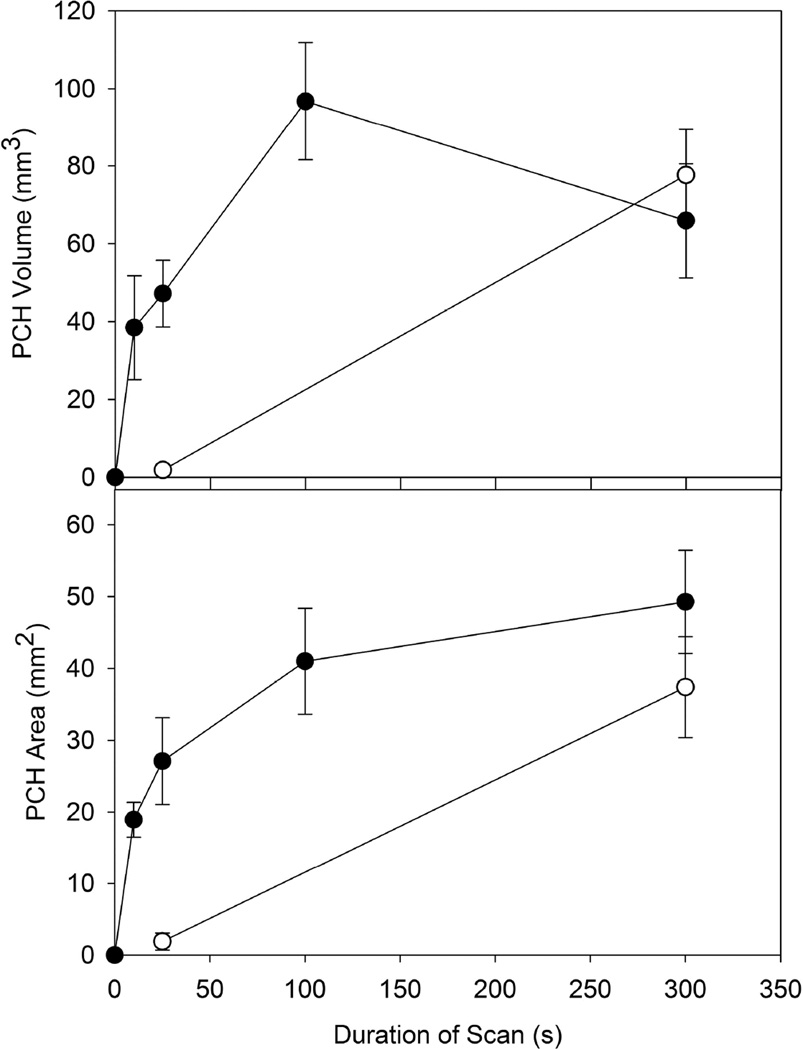
The PCH area for group G (0 dB, 10 s) was significantly smaller (p<0.001) than that of group B (0 dB, 300 s). However, as shown in Fig. 7, the variation of PCH with scan duration was small in the context of the 30 fold duration range. The depths and volumes were not significantly different for group G and B. Group E (0 dB, 25 s) and group H (0 dB, intermittent scan for 300 s) did not have significantly different depths, areas or volumes, which indicated that scan duration was not important for approximately equal numbers of frames. Group H had a significantly smaller PCH area than group B, suggesting that the total number of frames was important in the result. Comparing group B with group C (−3 dB, 300 s), the mean depth was significantly greater (p<0.01), but the areas and volumes were not. This again reflects the relatively low result for group B (also less than group D, with a shorter duration as noted above). However, group F (−3 dB, 25 s) had significantly lower (p<0.05) results than group E and group C. The different trends for the −3 dB tests compare to the 0 dB tests is illustrated in Fig. 7. The lower power setting had a greatly reduced impact for the 25 s scan duration and the PCH was not significantly different from shams. Two way ANOVA for power (0 dB, −3 dB) and duration (25s, 300s) indicated no significant interaction between power and duration for the area results, but a significant interaction (p=0.014) for the volume results.
Figure 7.
The results for pulmonary capillary hemorrhage (PCH) area and volume obtained from measurements of the fixed tissue samples. The results for 0 dB scans (filled circles) and −3 dB scans are compared for different scan durations. While the PCH was not significant for 25 s scans at −3 dB, even the 10 s scans produced significant PCH at 0 dB.
Discussion and Conclusions
This study was undertaken to provide information on the nature of the diagnostic ultrasound induced PCH lesions and to determine the dependence of PCH on exposure-scan durations. CTAs in the ultrasound images and PCH areas on the lung surface were measured as before, but were considered inadequate to fully characterize the PCH. Hence, the nature and depth of the PCH regions inside the lung were evaluated using µCT imaging and measured in fixed lung samples to provide data on depth of the lesions.
The ultrasound images displayed the progression of the PCH, for which the width of CTAs approximated the length of the PCH on the lung surface, see Figure 1 and Table 3, but did not provide data on the depth of the hemorrhages. The µCT provided detailed images of the PCH. An example of the µCT images is shown in Fig. 2 of the same lung shown in Fig. 1 by ultrasound. A video clip showing the progression of the CTAs during a 10 s scan, and a set of µCT images (presented as a video clip) containing an entire PCH volume are also provided as supplemental data.
Figure 4 compares the CTA widths and PCH lengths for the 0 dB tests at different durations. The CTAs appeared to be diagnostic for the length of PCH on the lung surface, except for the brief 10 s scans (group G). The 10 s scans all produced PCH that was clearly evident on the lung surface, but only three were detected by the presence of clear CTAs. The lack of detection for some lesions seems likely to be related to the ultrasound image resolution and the size of the PCH lesions. The two 10 s scans without CTAs produced PCH 1.2 and 1.6 mm (Fig.5a) in width, while the 10 s scans with CTAs produced PCH 3.1, 2.5 (Fig. 5b) and 2.2 mm in width. The smaller PCH lesions apparently were too small to be resolved by the machine and displayed on screen as CTAs.
Measurements of the depth, area and calculated volume of the PCH are listed in Table 4 for all groups. The findings from the µCT images and fixed tissue photographs were in approximate agreement (e. g. see Fig. 6), confirming the use of the in situ fixation method for realistic appraisal of the in situ configuration of the PCH (aside from some shifting of the lung lobes). The PCH area for 0 dB, 10 s scans was smaller than that of 0 dB, 300 s scans but much greater than might have been expected for the 30 fold reduction in duration. The result for the intermittent 5 Hz frame rate was the same as for the normal frame rate when the same total number of frames was delivered.
The dependence of PCH area on duration for 0 dB scans, shown in Fig. 7, is a steep linear increase to a plateau. This trend was probably due to the surface PCH filling the beam-scanned area. The average bright lung surface image was 18.5 mm long, and the beam width was 2.2 mm, giving 41 mm2 for the maximum PCH area (without taking lung sliding into account, which would widen the PCH), which is achieved in Fig. 7. Likewise the PCH volume can achieve a maximum value approximated by the maximum area times the thickness of the effected lung lobe, typically in the range of 1–4 mm, giving 41–164 mm3 (again neglecting lung sliding or migration of the hemorrhage outside the beam), which is reflected in Fig. 7 as a mean of about 100 mm3 and large error bars. The −3 dB scans for 25 s were greatly reduced (to insignificance) compared to the −3 dB, 300 s scans and 25 s scans, see Figure 7. This finding suggests that the threshold power setting for 25 s scans would be less than that for 300 s scans, and that a duration threshold greater than 25s may be definable for the lower power setting. For the 0 dB scanning, there did not appear to be a duration threshold, at least down to 10 s scans.
Overall, these results show that the diagnostic ultrasound induced PCH was visualized by computed tomography and was similar in appearance to reported observations of lung contusion. For the 0 dB power setting, the dependence of PCH on scan duration was minimal from 300 s down to 10s. The 10 s scans produced a significant PCH effect which was not always discernable in the image as CTAs. Thus, monitoring the image for CTAs may not be a reliable means to gauge the occurrence of PCH. The −3 dB scans did not produce significant PCH for the 25 s scan duration. During normal clinical scanning, PCH may be avoidable simply by reduction of the ultrasound power setting on the machine. Further work is needed to understand the basic biophysical mechanism of action leading to PCH, and to translate these findings to human clinical relevance.
Supplementary Material
Acknowledgments
We thank Prof. Craig Galban, Carlos Espinoza, and Amanda Fair of the University of Michigan Center for Molecular Imaging for performing the µCT scans and helping with their interpretation. This study was supported by the National Institutes of Health, National Heart Lung and Blood Institute, via grant number HL116434.
Footnotes
Publisher's Disclaimer: This is a PDF file of an unedited manuscript that has been accepted for publication. As a service to our customers we are providing this early version of the manuscript. The manuscript will undergo copyediting, typesetting, and review of the resulting proof before it is published in its final citable form. Please note that during the production process errors may be discovered which could affect the content, and all legal disclaimers that apply to the journal pertain.
References
- American Institute of Ultrasound in Medicine. Section 4--bioeffects in tissues with gas bodies. J Ultrasound Med. 2000;19:97–108. 154–168. doi: 10.7863/jum.2000.19.2.97. [DOI] [PMC free article] [PubMed] [Google Scholar]
- Child SZ, Hartman CL, Schery LA, Carstensen EL. Lung damage from exposure to pulsed ultrasound. Ultrasound Med Biol. 1990;16:817–825. doi: 10.1016/0301-5629(90)90046-f. [DOI] [PubMed] [Google Scholar]
- Church CC, O'Brien WD., Jr Evaluation of the threshold for lung hemorrhage by diagnostic ultrasound and a proposed new safety index. Ultrasound Med Biol. 2007;33:810–818. doi: 10.1016/j.ultrasmedbio.2006.11.006. [DOI] [PMC free article] [PubMed] [Google Scholar]
- Church CC, Carstensen EL, Nyborg WL, Carson PL, Frizzell LA, Bailey MR. The risk of exposure to diagnostic ultrasound in postnatal subjects: nonthermal mechanisms. J Ultrasound Med. 2008;27:565–592. doi: 10.7863/jum.2008.27.4.565. [DOI] [PubMed] [Google Scholar]
- Dalecki D, Child SZ, Raeman CH, Cox C, Penney DP, Carstensen EL. Age dependence of ultrasonically induced lung hemorrhage in mice. Ultrasound Med Biol. 1997;23:767–776. doi: 10.1016/s0301-5629(97)00071-9. [DOI] [PubMed] [Google Scholar]
- Gargani L, Doveri M, D'Errico L, Frassi F, Bazzichi ML, Delle Sedie A, Scali MC, Monti S, Mondillo S, Bombardieri S, Caramella D, Picano E. Ultrasound lung comets in systemic sclerosis: a chest sonography hallmark of pulmonary interstitial fibrosis. Rheumatology (Oxford) 2009;48:1382–1387. doi: 10.1093/rheumatology/kep263. [DOI] [PubMed] [Google Scholar]
- Lichtenstein D. Lung ultrasound in the critically ill. Curr Opin Crit Care. 2014;20:315–322. doi: 10.1097/MCC.0000000000000096. [DOI] [PubMed] [Google Scholar]
- Martelius L, Heldt H, Lauerma K. B-Lines on pediatric lung sonography: Comparison with computed tomography. J Ultrasound Med. 2016;35:153–157. doi: 10.7863/ultra.15.01092. [DOI] [PubMed] [Google Scholar]
- Mason KP, Lubisch NB, Robinson F, Roskos R. Intramuscular dexmedetomidine sedation for pediatric MRI and CT. AJR Am J Roentgenol. 2011;197:720–725. doi: 10.2214/AJR.10.6134. [DOI] [PubMed] [Google Scholar]
- Miller DL. Induction of pulmonary hemorrhage in rats during diagnostic ultrasound. Ultrasound Med Biol. 2012;38:1476–1482. doi: 10.1016/j.ultrasmedbio.2012.04.004. [DOI] [PubMed] [Google Scholar]
- Miller DL, Dou C, Raghavendran K. Anesthetic techniques influence the induction of pulmonary capillary hemorrhage during diagnostic ultrasound scanning in rats. J Ultrasound Med. 2015a;34:289–297. doi: 10.7863/ultra.34.2.289. [DOI] [PMC free article] [PubMed] [Google Scholar]
- Miller DL, Dou C, Raghavendran K. Pulmonary capillary hemorrhage induced by fixed-beam pulsed ultrasound. Ultrasound Med Biol. 2015b;41:2212–2219. doi: 10.1016/j.ultrasmedbio.2015.03.030. [DOI] [PMC free article] [PubMed] [Google Scholar]
- Miller DL, Dou C, Raghavendran K. Dependence of thresholds for pulmonary capillary hemorrhage on diagnostic ultrasound frequency. Ultrasound Med Biol. 2015c;41:1640–1650. doi: 10.1016/j.ultrasmedbio.2015.01.016. [DOI] [PMC free article] [PubMed] [Google Scholar]
- Miller DL, Dou C, Dong Z, Raghavendran K. The influence of dexmedetomidine on ultrasound-induced pulmonary capillary hemorrhage in rats. Ultrasound Med Biol. 2016;42:964–970. doi: 10.1016/j.ultrasmedbio.2015.12.004. [DOI] [PMC free article] [PubMed] [Google Scholar]
- Miller LA. Chest wall, lung, and pleural space trauma. Radiol. Clin. N. Am. 2006;44:213–224. doi: 10.1016/j.rcl.2005.10.006. [DOI] [PubMed] [Google Scholar]
- O'Brien WD, Jr, Simpson DG, Ho MH, Miller RJ, Frizzell LA, Zachary JF. Superthreshold behavior and threshold estimation of ultrasound-induced lung hemorrhage in pigs: role of age dependency. IEEE Trans Ultrason Ferroelectr Freq Control. 2003;50:153–169. doi: 10.1109/tuffc.2003.1182119. [DOI] [PubMed] [Google Scholar]
- Raeman CH, Child SZ, Dalecki D, Cox C, Carstensen EL. Exposure-time dependence of the threshold for ultrasonically induced murine lung hemorrhage. Ultrasound Med Biol. 1996;22:139–141. doi: 10.1016/0301-5629(95)02036-5. [DOI] [PubMed] [Google Scholar]
- Volpicelli G. Lung sonography. J Ultrasound Med. 2013;32:165–171. doi: 10.7863/jum.2013.32.1.165. [DOI] [PubMed] [Google Scholar]
- Weitzel WF, Hamilton J, Wang X, Bull JL, Vollmer A, Bowman A, Rubin J, Kruger GH, Gao J, Heung M, Rao P. Quantitative lung ultrasound comet measurement: method and initial clinical results. Blood Purif. 2015;39:37–44. doi: 10.1159/000368973. [DOI] [PubMed] [Google Scholar]
- Zachary JF, Sempsrott JM, Frizzell LA, Simpson DG, O'Brien WD., Jr Superthreshold behavior and threshold estimation of ultrasound-induced lung hemorrhage in adult mice and rats. IEEE Trans Ultrason Ferroelectr Freq Control. 2001;48:581–592. doi: 10.1109/58.911741. [DOI] [PubMed] [Google Scholar]
Associated Data
This section collects any data citations, data availability statements, or supplementary materials included in this article.


