
Figure 4. In vivo transgene expression following CED of DNA-NP.
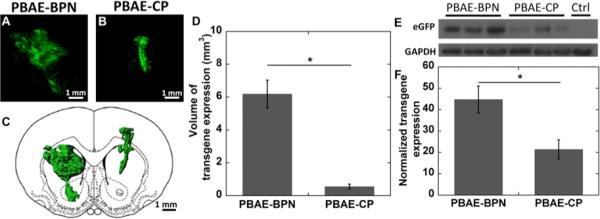
Representative stacked and aligned confocal images of enhanced green fluorescent protein (eGFP) expression (green) following CED of (A) PBAE-BPN and (B) PBAE-CP in the rat striatum. Scale bar = 1mm. (C) Representative 3D-rendered image of distribution of in vivo eGFP expression of respective PBAE-based DNA-NP. Scale bar = 1 mm (D) Image-based MATLAB quantification of the volume of eGFP expression (N = 4-6 rats). *p < 0.05. (E) Representative western blot of brain striatum samples following CED of respective DNA-NP. (F) Normalized transgene expression following CED of DNA-NP in the rat striatum. The expression level of eGFP was normalized to a non-treated control brain. Data represents the mean ± SEM (N = 8 rats).