

Summary
Influenza causes significant morbidity and mortality annually. Although vaccination offers a considerable amount of protection, it is far from perfect, especially in aging populations. This is due to age‐related defects in immune function, a process called immunosenescence. To date, there are no assays or methods to predict or explain variations in an individual's level of response to influenza vaccination. In this study, we measured levels of several immune cell subsets at baseline (Day 0) and at Days 3 and 28 post‐vaccination using flow cytometry. Statistical modelling was performed to assess correlations between levels of cell subsets and Day 28 immune responses – haemagglutination inhibition (HAI) assay, virus neutralizing antibody (VNA) assay, and memory B cell ELISPOT. Changes in several groups of cell types from Day 0 to Day 28 and Day 3 to Day 28 were found to be significantly associated with immune response. Baseline levels of several immune cell subsets, including B cells and regulatory T cells, were able to partially explain variation in memory B‐cell ELISPOT results. Increased expression of HLA‐DR on plasmacytoid dendritic cells after vaccination was correlated with increased HAI and VNA responses. Our data suggest that the expression of activation markers (HLA‐DR and CD86) on various immune cell subsets, as well as the relative distribution of cell subsets, both have value in predicting immune responses to influenza vaccination in older individuals.
Keywords: Adaptive immunity, influenza, influenza vaccine, regulatory T cells, vaccination
Abbreviations
- APC
antigen‐presenting cell
- DC
dendritic cell
- HAI
haemagglutination inhibition
- IL
interleukin
- mDC
myeloid dendritic cell
- NK
natural killer cell
- PBMC
peripheral blood mononuclear cell
- pDC
plasmacytoid dendritic cell
- Treg
regulatory T cell
- VNA
virus neutralizing antibody
Introduction
Influenza is a segmented, negative‐strand ssRNA virus with three species (A, B and C), each of which are human pathogens and members of the Orthomyxovirus family. The vast majority of human cases involve influenza A, with the next‐highest number of cases being caused by influenza B. Influenza C is much less common and typically results in mild disease, predominantly in children.1 Although many influenza infections are subclinical, they can cause debilitating illness lasting for weeks. Seasonal outbreaks of influenza affect tens of millions of Americans annually, with mortality rates ranging from 3000 to 49 000 (Centers for Disease Control and Prevention).2 Influenza has an even greater public health impact worldwide.
Genetic mutation and antigenic drift lead to the regular occurrence of influenza epidemics. These epidemics are marked by relatively high mortality in older individuals (≥ 65 years of age) and are the reasons behind the reformulation of a new vaccine each season. During these outbreaks, influenza infection results in more severe disease in the very young and in the elderly.3 The greater morbidity and mortality among older individuals is due, in part, to immunosenescence. The information needed to explain and predict the level of protection that individuals will receive from the influenza vaccine is lacking. 4, 5, 6
Recombination events between various influenza strains (antigenic shift) result in more dramatic changes in viral antigenicity and can lead to influenza pandemics, which have far greater public health consequences. Examples of these include the H1N1 ‘Spanish Flu’ in 1918, the H2N2 ‘Asian Flu’ in 1957, the H3N2 ‘Hong Kong Flu’ in 1968, the H5N1 ‘Bird Flu’ in 2004, as well as the more recent H1N1 ‘Swine Flu’ pandemic in 2009.7 Mortality patterns during influenza pandemics do not necessarily match those observed during epidemics or yearly outbreaks. During the 1918 influenza pandemic, almost half of all deaths occurred in healthy adults aged 20–40 years.8 Although the reasons for this increased pathogenesis are not fully understood, it is believed that inappropriate host inflammatory responses are partially responsible.9
Innate immune responses serve not just as an early warning system and first line of host defence, but also initiate the more powerful, antigen‐specific adaptive responses characterized by cytotoxic T lymphocytes, B cells and antibody production. The latter role of innate immunity is mediated by professional antigen‐presenting cells (APCs), including dendritic cells (DCs), macrophages and B cells. Regulatory T (Treg) cells also play a role in regulating the adaptive immune response, and are another aspect of immune function affected by aging.10 Therefore, it can be hypothesized that the specific composition of immune cell subsets that a patient possesses may have a significant effect on the immune response to influenza infection and vaccination.
In this study, we examine the contribution of several immune cell subsets to both innate and adaptive immune responses following influenza vaccination. Both APCs and natural killer (NK) cells were studied because of their role as mediators of innate responses and because of their contributions to the development of adaptive immunity. Additionally, T and B cells were studied because of their role as the main mediators of cellular and humoral immune responses. B cells also serve as APCs initiating T‐cell responses. Lastly, we examined Treg cells (defined as CD4+ CD25+ CD127– cells present in the peripheral blood). This population probably corresponds to the prototypical Foxp3+ Treg cell subset involved in peripheral tolerance and suppression of self‐reactive T‐cell responses.11 Our results show that the contributions of specific immune cell subsets to influenza vaccine‐induced immunity can, indeed, be quantified in older individuals. This information could help to identify low vaccine responders and provide avenues for improved vaccine strategies or design for this population.
Materials and methods
The following methods are similar or identical to previously published studies using this cohort.6, 12, 13, 14, 15, 16, 17
Participant recruitment
Our sample population consists of a previously described cohort of 159 generally healthy people, aged 50–74 years, recruited from Mayo Clinic, Rochester, MN, who received the 2010/11 seasonal trivalent inactivated influenza vaccine (TIV; Fluarix) containing the A/California/7/2009 NYMC X‐191 (H1N1), A/Victoria/210/2009 NYMC X‐187 (H3N2) (an A/Perth/16/2009‐like virus), and B/Brisbane/60/2008 viral strains.12, 18 Blood samples (100 ml each) were collected before vaccination (Day 0) and at Days 3 and 28 post‐vaccination.12 Written informed consent was obtained from each participant and the Mayo Clinic Institutional Review Board approved all study parameters.
Isolation of peripheral blood mononuclear cells
Peripheral blood mononuclear cells (PBMCs) were isolated from each blood sample using BD Vacutainer® CPT™ Cell Preparation Tubes with sodium citrate, resuspended and split into aliquots, and cryopreserved until use, as described previously.16, 19
Growth of influenza virus
The Centers for Disease Control and Prevention (Atlanta, GA) provided the influenza A/California/7/2009/H1N1‐like strain used in this study. The virus was propagated in embryonated chicken eggs, harvested from the allantoic fluid, and titrated, as described previously.14, 16
Flow cytometry
Flow cytometry was used to immunophenotype immune cell subsets. Frozen PBMCs from Days 0 (baseline), 3 and 28 were thawed according to standard procedures and stained in the dark at 4° for 30 min. Cells were stained with the following fluorochrome‐conjugated antibodies: CD‐11c‐V450, CD3‐V500, CD86‐fluorescein isothiocyanate (FITC), CD‐56‐phycoerythrin (PE), CD123‐allophycocyanin (APC), CD20‐Peridinin chlorophyll protein complex (PerCP)‐Cy5·5, HLA‐DR‐Alexa Fluor (AF) 700, CD16‐PE‐Cy7, CD14‐APC‐Cy7, CD28‐BV421, HLA‐DR‐V500, CD25‐BV605, CD45RO‐FITC, CD38‐PE, CD194‐PE‐Cy7, CD127‐AF647, CD4‐AF700, and CD3‐APC‐Cy7 (all from BD Biosciences, San Jose, CA). All cells were fixed with 4% paraformaldehyde before analysis on a BD LSR II Flow Cytometer with FACSdiva software (BD Biosciences). Cell population gating was performed using flowjo (FlowJo, LLC, Ashland, OR).
Measurement of influenza vaccine immune response
Participants’ influenza A/H1N1‐specific haemagglutination inhibition assay (HAI) titres were measured from sera at each time‐point pre‐ and post‐vaccination, using a standard protocol, as previously described.13, 14, 16
A cell‐based microneutralization assay was performed with influenza A/H1N1 virus stimulation (200 plaque‐forming units per 5 µl), as described previously,6, 13 to determine influenza A/H1N1‐specific neutralizing antibody titres from subject sera at each time‐point pre‐ and post‐vaccination.
Influenza A/H1N1‐specific B cells (memory‐like IgG B cells) were quantified in subjects’ PBMCs using the Mabtech Human IgG ELISpotPLUS Kit (Mabtech, Inc., Cincinnati, OH), according to the manufacturer's specifications (with some modifications). Influenza A/H1N1 stock was diluted 1 : 10 (50 000 TCID50 per well) before coating ELISPOT plates as previously described.14
Statistical methods
The Wilcoxon signed‐rank test (with continuity correction) was used to test for changes between time‐points in the cell subset distributions for the flow cytometry panels, and the Wilcoxon rank‐sum test was used to test for differences in these variables between men and women. A P‐value threshold of P < 0·01 was used to determine significance. Spearman's rank correlation was used to calculate all correlation coefficients and to test for significant associations between two variables. Linear regression was used to estimate the association of the immune cell subsets (at each time‐point, as well as for differences between the time‐points) on each Day 28 immune response [HAI, VNA, and memory B‐cell ELISPOT, all on the log2 scale), after adjusting for the baseline level of response variables and gender as covariates to address the univariate impact of each of the cell subset variables. Multivariable models were developed for each of the immune response variables using elastic‐net penalized regression implemented via glmnet in the R‐Statistical Program.20, 21 Specifically, to identify correlates predictive of the Day 28 immune response variables, we used the glmnet package in R, with 10‐fold cross‐validation and a penalized α‐parameter of 0·90. All models included gender and the baseline level of the immune response. The model with the minimum mean square error was selected. Results for these models are reported as standardized penalized coefficients from the model that achieved the minimum mean square error. Throughout the article, we use the term ‘predictive’ in the sense of a significant independent variable in the regression model, not in the sense of classification.
Results
Study demographics
The study cohort comprised 159 people, 50–74 years of age, of whom 98 were women and 61 were men (Table 1). Participants self‐reported racial/ethnic classifications, yielding the following cohort composition: 98·75% White, 0·6% Asian, and 0·6% more than one race.
Table 1.
Study demographics
| Variable | No. of subjects | Value |
|---|---|---|
| Age in years (median, IQR) | 159 | 59·5 (55·3–66·3) |
| Gender, n (%) | ||
| Female | 159 | 98 (61·6%) |
| Male | 61 (38·4%) | |
| Race, n (%) | ||
| Caucasian | 159 | 157 (98·7%) |
| Asian | 1 (0·6%) | |
| More than one race | 1 (0·6%) | |
IQR, interquartile range.
Distribution of APC and Treg cell subsets
Few statistically significant changes were seen in cell subset distributions across the studied time‐points, with the exception of B cells and plasmacytoid DCs (pDCs). The median percentage of B cells decreased significantly from Day 0 to Day 3 [3·6%, interquartile range (IQR) 2·6–10·0% to 3·1%, IQR 2·3–4·1%; P = 1·2 × 10−6] and Day 0 to Day 28 (3·6%, IQR 2·6–10·0% to 3·2%, IQR 2·3–4·2%; P = 2·7 × 10−5). The percentages of pDCs increased modestly, but significantly, from Day 0 to Day 28 (0·13%, IQR 0·1–0·28% to 0·14%, IQR 0·19–0·2%; P = 0·001). Minor variations occurred in other immune cell subsets, but these did not reach significance.
CD86 and HLA‐DR surface expression
To examine the activation status of B cells, myeloid DCs (mDCs), pDCs and monocytes, we measured the surface expression of HLA‐DR and CD86 (Table 2). The mDCs had approximately half the level of expression of HLA‐DR compared with pDCs across all time‐points. B cells and monocytes also expressed high levels of HLA‐DR. Among the monocyte subsets, expression was lower on classical monocytes compared with non‐classical and intermediate monocytes. The pDCs exhibited a 4·0% increase in HLA‐DR expression from Day 3 to Day 28 (P = 0·01), whereas HLA‐DR levels on the other cell types did not change significantly at any of the post‐vaccination time‐points.
Table 2.
HLA and CD86 expression
| Cell subset | Day 0 | Day 3 | Day 28 | Day 0–3 P‐value | Day 0–28 P‐value | Day 3–28 P‐value |
|---|---|---|---|---|---|---|
| Median MFI (IQR) | Median MFI (IQR) | Median MFI (IQR) | ||||
| CD86 expression | ||||||
| B cells: CD86 | 60·3 (53·3–67·7) | 62·5 (55·6–68·7) | 61·0 (53·3–68·3) | 0·033 | 0·42 | 0·11 |
| mDCs: CD86 | 372·5 (333·9–420·1) | 366·1 (327·4–412·2) | 349·1 (317·8–402·4) | 0·24 | 0·00034 | 0·01 |
| pDCs: CD86 | 134·3 (121·4–144·8) | 139·1 (125·2–151·4) | 134·3 (119·5–146·8) | 0·0022 | 0·71 | 0·00093 |
| Classical monocytes: CD86 | 552·0 (493·6–617·4) | 559·3 (513·0–618·8) | 527·3 (480·5–610·4) | 0·084 | 0·0046 | 0·000015 |
| Intermediate monocytes: CD86 | 713·5 (646·0–774·9) | 737·9 (650·5–823·9) | 692·5 (611·9–788·6) | 0·028 | 0·0092 | 0·0000073 |
| Non‐classical monocytes: CD86 | 624·7 (549·0–694·9) | 597·9 (547·5–689·3) | 579·3 (513·6–654·8) | 0·74 | 0·00011 | 0·000028 |
| HLA‐DR Expression | ||||||
| B cells: HLA‐DR | 3160·8 (2591·2, 3878·3) | 3280·0 (2774·3, 3935·4) | 3313·9 (2797·9, 3997·3) | 0·15 | 0·034 | 0·67 |
| mDCs: HLA‐DR | 1854·6 (1435·0, 2424·0) | 1837·8 (1390·9, 2299·6) | 1865·1 (1444·3, 2242·6) | 0·47 | 0·97 | 0·96 |
| pDCs: HLA‐DR | 3520·3 (2701·0, 4946·4) | 3485·8 (2682·1, 4715·6) | 3625·7 (2792·7, 4843·3) | 0·14 | 0·13 | 0·0099 |
| Classical monocytes: HLA‐DR | 2250·9 (1722·9, 2967·7) | 2344·5 (1786·2, 2893·8) | 2213·9 (1695·8, 2788·8) | 0·51 | 0·3 | 0·01 |
| Intermediate monocytes: HLA‐DR | 6950·1 (5175·6, 9167·0) | 7388·2 (5900·4, 9388·7) | 7403·8 (5855·0–9147·8) | 0·088 | 0·1 | 0·71 |
| Non‐classical monocytes: HLA‐DR | 3064·1 (2542·3–4103·1) | 3248·5 (2485·0–4011·8) | 3147·4 (2498·3–3960·5) | 0·41 | 0·41 | 0·05 |
IQR, interquartile range; MFI, median fluorescent intensity.
Median fluorescent intensity is shown for CD86 and HLA‐DR expression at each time‐point, along with the P‐values showing the significance of changes between time‐points. P values were calculated using the Wilcoxon Signed Rank Test.
Overall, CD86 expression was lowest on B cells; at intermediate levels on both DC subsets; and at the highest levels on monocyte populations, where it paralleled HLA‐DR class II expression. CD86 expression did not change appreciably on B cells after vaccination; however, it was up‐regulated on pDCs from Day 0 to Day 3 (3·6% increase, P = 0·002) before making a 3·4% decrease from Day 3 to Day 28 (P = 0·0009). It was decreased on mDCs on Day 28 (6·3% decrease, P = 0·0003). All monocyte subsets exhibited a significant decrease in CD86 expression from Day 0 to Day 28 (classical monocytes: 4·5% decrease, P = 0·005; intermediate monocytes: 2·9% decrease, P = 0·009; non‐classical monocytes: 7·3% decrease, P = 0·0001) and Day 3 to Day 28 (classical monocytes: 5·7% decrease, P = 1·5 × 10−5; intermediate monocytes: 6·2% decrease, P = 7·3 × 10−6; non‐classical monocytes: 3·1% decrease, P = 2·8 × 10−5).
Gender differences
Significant gender‐specific differences were found in the proportions of NK cells (27·1% higher in men), T cells (10·0% higher in women), and memory DR+ Treg (20·0% higher in men) cells present at baseline in the cohort (Table 3). We saw similar gender‐specific differences in these cell types at Day 28 post‐vaccination; however, the differences were slightly above our threshold for statistical significance (P‐values ranged from 0·02 to 0·05; data not shown). Distributions of the remaining cell subsets (monocyte subsets, pDCs, mDCs, NK T cells, and Treg cell subsets) were similar between men and women after vaccination, with one exception: levels of naive CD8 T cells were 9·6% higher in women compared with men.
Table 3.
Gender differences in cell subsets
| Cell subset | Timepoint | Males (median) % | Females (median) % | P‐value |
|---|---|---|---|---|
| NK cells (% of live cells) | Baseline | 14·4 | 10·5 | 0·005 |
| T cells (% of live cells) | Baseline | 43·8 | 48·2 | 0·002 |
| Treg memory DR+ (% of CD4+) | Baseline | 0·5 | 0·4 | 0·003 |
| CD8+ naive DR– (% CD8+) | Day 28 | 62·4 | 68·4 | 0·005 |
NK, natural killer; Treg, regulatory T.
Percentages of cell subtypes with significant differences between genders. Cell subsets are defined as follows: NK cells (CD56+ and CD3–); T cells (CD3+); Treg cells (CD4+ CD25+ CD127–), CD4+ T cells (CD4+ CD127+); naive T cells (CD8+ or CD4+ and CD45RO–), memory T cells (CD4+ or CD8+ and CD45RO+). The cell subsets for which there were no significant gender differences included CD3+ T cells, CD4+ T cells, naive CD4+, Treg cells (CD4+ CD25+ CD45+ CD127–), and CD8+ T cells.
Correlations between cell subsets
Correlations between cell types were analysed to further explore the effect of influenza vaccination on lymphocyte subsets. Results showed that monocyte populations are highly correlated with one another (classical and intermediate monocytes: r = 0·65; classical and non‐classical monocytes: r = 0·49; intermediate and non‐classical monocytes: r = 0·58) and also exhibit a fairly strong correlation with pDCs (classical monocytes: r = 0·40; intermediate monocytes: r = 0·35; non‐classical monocytes: r = 0·37). In contrast, T cells are inversely correlated with most other cell types (NK cells: r = −0·56; mDCs: r = −0·07; pDCs: r = −0·32; classical monocytes: r = −0·48; intermediate monocytes: r = −0·37; non‐classical monocytes: r = −0·45). Interestingly, there was also a negative correlation between NK and NK T cells within our participants (r = −0·42). These correlations remained stable across each time‐point studied. In addition, the percentage of CD28high CD4 T cells was positively correlated with the percentage of CD4 T cells (r = 0·28); however, the opposite was true of the CD28high CD8 T cells with the percentage of CD8 T cells (r = −0·31). CD28 expression on the CD4 and CD8 T cells was also highly correlated (r = 0·47).
Associations with immune response
Influenza vaccine‐induced immune responses for this cohort have been previously reported.14, 16 As expected, there were statistically significant increases in influenza A/H1N1‐specific HAI titre (P = 3·9E‐15), VNA titre (P = 1·5E‐17), and B‐cell ELISPOT response (P = 8·2E‐22) 28 days after influenza vaccination. The intraclass correlation coefficients for the HAI, VNA and B‐cell ELISPOT assays were 0·91, 0·83 and 0·88, respectively.
Univariate linear regression modelling was performed to identify single‐variable associations between each vaccine‐induced immune response at Day 28 and each cell subset at baseline, Day 28–Day 0, and Day 28–Day3. Five cell subset parameters at baseline were found to be significantly associated with memory B‐cell ELISPOT response results, including the percentage of B cells and their activation state (CD86) and several CD4+ T‐cell subsets (Table 4). No baseline cell subsets were found to be associated with HAI or VNA responses. The increase in HLA‐DR expression on pDCs between Day 3 and Day 28 was predictive of both HAI (coefficient = 1·27, P = 0·00008) and VNA (coefficient = 1·01, P = 0·001) responses, and the decrease in CD86 expression on classical monocytes was negatively associated with the memory B‐cell ELISPOT (coefficient = −1·77, P = 0·002). None of the humoral immune responses were associated with any cell subset when looking at Day 0 versus Day 28 changes.
Table 4.
Associations of cell subsets with influenza‐specific immune response (P < 0·01)
| Immune response | Cell subset | Coeff. | Standard error | P‐value |
|---|---|---|---|---|
| Baseline | ||||
| Memory B‐cell ELISPOT | B cells (% of live cells) | 0·64 | 0·20 | 0·0021 |
| Memory B‐cell ELISPOT | B cells: CD86 | 0·95 | 0·34 | 0·0061 |
| Memory B‐cell ELISPOT | CD4+ CD127+ memory DR– (% of CD4+) | 0·35 | 0·11 | 0·0022 |
| Memory B‐cell ELISPOT | CD4+ CD127+ naive (% of CD4+) | −0·67 | 0·20 | 0·0012 |
| Memory B‐cell ELISPOT | CD4+ Treg naive (% of Treg) | −0·35 | 0·12 | 0·0051 |
| Day 28–Day 3 | ||||
| HAI | pDCs: HLA‐DR | 1·27 | 0·31 | 0·000082 |
| HAI | mDCs (% of live cells) | −0·38 | 0·17 | 0·024 |
| HAI | Naive CD4+ Treg cells (% of live cells) | −0·60 | 0·27 | 0·026 |
| VNA | pDCs: HLA‐DR | 1·01 | 0·31 | 0·0013 |
| VNA | mDCs (% of live cells) | −0·33 | 0·16 | 0·042 |
| VNA | mDCs: HLA‐DR | 0·57 | 0·24 | 0·021 |
| VNA | Naive CD4+ Treg cells (% of live cells) | −0·60 | 0·26 | 0·023 |
| Memory B‐cell ELISPOT | Classical monocytes: CD86 | −1·77 | 0·55 | 0·0016 |
| Memory B‐cell ELISPOT | Non‐classical monocytes (% of live cells) | 0·69 | 0·27 | 0·013 |
HAI, haemagglutination inhibition; mDCs, myeloid dendritic cells; NK, natural killer; pDCs, plasmacytoid dendritic cells; Treg, regulatory T; VNA, virus neutralizing antibody.
Bold associations meet our statistical significance threshold.
Multivariate associations with immune response
We used penalized generalized linear models to identify the collections of flow variable(s) that best predicted the aforementioned influenza vaccine‐induced immune responses (Fig. 1). No predictions of immune response to influenza vaccination could be made based on the model as a function of baseline levels of cell subsets; however, modelling changes in flow variables between time‐points (Days 3 and 28 and Days 0 and 28) showed multiple predictors of immune response. Several similarities were observed between the Day 0 to Day 28 HAI and VNA predictor combinations, as well as between the Day 3 to Day 28 HAI and VNA predictor combinations. Changes in the level of expression of CD86 on classical monocytes was part of both groups of variables found to be predictive of the memory B‐cell ELISPOT response (the group of variables changing from Days 0 to 28 and the group of variables changing from Days 3 to 28).
Figure 1.
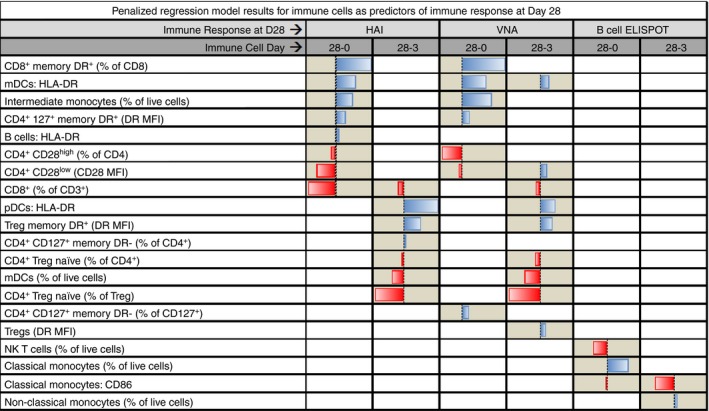
The bars in the figure represent the standardized coefficients from the elastic net penalized regression models. A bar increasing to the right indicates that the cell subset variable has a positive association in the model with the Day 28 immune response. A bar increasing to the left indicates the variable was associated with a decrease in the Day 28 immune response. Two separate models were fitted for each of the immune response variables. The columns labelled ‘28‐0’, show the changes from Day 0 to Day 28 in the cell subset variables in the model; likewise, the columns labelled ‘28‐3’ show the changes from Day 3 to Day 28.
Discussion
Here, we report changes in immune cell phenotype and frequency following immunization with the TIV vaccine in an older cohort. Our results indicate that influenza vaccination does not result in global changes in the distribution of immune cell subsets. As this is a split‐virion vaccine that lacks live or even inactivated viral particles, this result is perhaps not surprising. We observed gender differences in some lymphocyte populations, with women having a higher percentage of CD3+ T cells and naive CD8+ T cells. This has been attributed to the effect of androgens, which have been linked to decreased proliferation and increased apoptosis of thymic T cells.22, 23, 24 Furthermore, consistent with studies suggesting that testosterone levels may play a role in the increased levels of interleukin‐1β (IL‐1β) producing monocytes commonly seen in men,25, 26 our studies showed that men had a significantly larger proportion of non‐classical monocytes than women. The women also had a lower percentage of NK cells and memory phenotype Treg cells. Consistent with these data, a review of the sex differences in immune response to viral vaccines reported a study showing that women responded to a half‐dose of the influenza vaccine as robustly as men who received a full dose,27, 28 along with several studies showing consistently higher humoral responses to influenza vaccination in women than in men.27, 28, 29, 30, 31 Elevated CD4+ counts and higher CD4 : CD8 ratios have also been described in women.32, 33, 34, 35 These findings are similar to ours; however, differences in age, counting techniques and parameters, and underlying medical conditions make direct comparisons difficult.
Our data indicated that pDCs had significantly higher HLA class II expression than their myeloid counterparts, which are typically associated with more robust antigen processing and presentation capabilities than pDCs.36 Our results indicate that this is not due to sub‐optimal levels of surface HLA and may be related to differential cytokine secretion and/or co‐stimulatory molecule expression. With respect to cellular activation, HLA‐DR expression was relatively stable on all cell types, with the exception of pDCs, which exhibited a transient decrease in HLA‐DR expression on Day 3. We observed more variation in CD86 expression on major APC subsets. In particular, pDCs experienced a small, but statistically significant, up‐regulation of CD86 on Day 3, which returned to baseline levels by Day 28. This transient increase in CD86 was also observed on classical and intermediate monocytes. In contrast, mDCs progressively lost expression of CD86 across the time‐points. By Day 3, non‐classical monocytes also exhibited a reduction in CD86 expression, which remained lower through Day 28. Others have also noted that variations in co‐stimulatory molecules on APCs may be linked to immune responsiveness to influenza. Van Duin et al. noted that each 10% decrease in CD86+ monocytes after Toll‐like receptor stimulation was associated with an increased humoral response to influenza strains.37 Viral immune evasion strategies may alter APC activation, leading to dysregulation of co‐stimulatory markers, as has been noted for influenza infection of mDCs.38 Additional activation markers exist (CD40, CD54, CD80, CD83, OX40L, etc.), and a more detailed examination of the kinetics of APC activation (including these additional markers, as well as additional time‐points) would enhance our understanding of influenza vaccine responses, especially given the newly approved MF59‐adjuvanted influenza vaccine, FluAd.
Linear regression modelling of our results revealed five baseline parameters associated with Day 28 memory B‐cell ELISPOT response. Three of these parameters – the level of CD86 expression on B cells, and the percentages of B cells (of live cells) and CD4+ CD127+ memory DR cells (of CD4+ cells) – were positively correlated with B‐cell response and may respectively represent a more activated state, a larger pool of influenza‐specific B cells, and a greater availability of T‐cell help. The remaining two parameters – the percentages of CD4+ T cells that are naive CD127+ T helper cells (of CD4+ and of CD127+ cells) and percentages of naive Treg cells (of CD4+ and of CD127+ cells) – were negatively correlated with B‐cell response. Linear modelling did not identify any baseline correlates of Day 28 HAI or VNA response; however, it did detect a significant positive correlation between the change in level of expression of HLA‐DR on pDCs from Day 3 to Day 28 and both HAI and VNA responses. Interestingly, compared with mDCs, it has been demonstrated that pDCs experience a reduction in virus‐induced apoptosis and an increase in influenza protein expression after infection, leading to the conclusion that these cells may be resistant to the apoptotic effects of influenza virus infection, allowing for sustained presentation of viral antigens. In support of this hypothesis, pDCs were shown to induce the proliferation and differentiation of anti‐influenza cytotoxic T lymphocytes and T helper type 1 CD4+ T cells after processing influenza antigens in the context of influenza infection.39
We also performed predictive modelling using penalized regression, but failed to identify any individual baseline predictor of Day 28 immune response (HAI, VNA or B‐cell ELISPOT). Despite the relatively small changes in cell subset numbers after vaccination, several of these changes were collectively predictive of both the HAI and VNA outcomes. The percentages of HLA‐DR+ memory CD8 T cells, DR+ memory CD4 T cells, and intermediate monocytes, along with HLA‐DR expression on mDCs, all positively contributed to HAI and VNA results. Conversely, the percentage of CD28‐expressing CD4 T cells and the level of CD28 on the CD28low T helper cells negatively impacted HAI and VNA results. These data suggest that the expansion of the memory T‐cell compartment (both CD4+ and CD8+) is beneficial in terms of the humoral immune response, presumably through the provision of cytokines and co‐stimulatory receptor–ligand interactions. Similarly, increased numbers of intermediate monocytes, as well as increased HLA‐DR expression on mDCs – perhaps indications of robust innate immunity – are also beneficial. It is more difficult to determine how the negative parameters fit into humoral immune responses, which suggests that more data and further investigation are warranted. The current vaccine is a split‐virion, non‐adjuvanted product; comparative studies on the innate response elicited by this and newly approved adjuvanted vaccines may provide important insights into innate immune responses to influenza vaccination.
Reasoning that the first few days after vaccination would be dominated by innate responses, we also examined changes in cell subsets between Day 3 and Day 28 in order to focus on the adaptive portion of the vaccine response. As expected, the penalized regression modelling identified a number of different parameters predictive of both HAI and VNA outcomes. HLA‐DR expression on pDCs and the proportion of Treg cells that were DR+ and of the memory phenotype both positively impacted humoral immune responses, while the percentage of mDCs and the proportions of CD4+ T cells and Treg cells with a naive phenotype were negatively associated with humoral response. Although initially thought of as simply an ‘activation marker’, expression of HLA‐DR on human T cells confers antigen presentation capability to T cells. In fact, T‐cell presentation of class I‐restricted antigens drives the development of a central memory phenotype in the responding T cells.40 Similarly, T‐cell presentation of class II‐restricted antigens can induce a state of tolerance or anergy in the responding T cell.41 Like their CD4+ counterparts, a significant percentage of Treg cells also express HLA‐DR.42 These DR+ Treg cells are functionally distinct from DR– Treg cells and can inhibit T‐cell proliferation and cytokine secretion through a mechanism involving cell contact.43 Our model indicates a correlation between a larger population of memory phenotype Treg cells and higher HAI/VNA titres. One possible explanation is that cytokine secretion by Treg cells (IL‐10, transforming growth factor‐β, and perhaps IL‐9) contributes to the enhanced humoral immune responses. The provision of IL‐10 to B cells following their initial activation prevents apoptosis and promotes plasma cell differentiation.44, 45 Transforming growth factor‐β regulates B‐cell proliferation, differentiation and survival.46 Interleukin‐9 is known to enhance IgG, IgM and IgE production in human B cells.47
In terms of the B‐cell ELISPOT response, decreases in the percentage of NK T cells and level of expression of CD86 on classical monocytes, along with an increase in the percentage of classical monocytes – all from Day 0 to Day 28 – were correlated with increased response according to glmnet models. Linear modelling verified the inverse correlation between a change in the level of CD86 expression (from Day 3 to Day 28) on classical monocytes and memory B‐cell ELISPOT response. CD86 expression on monocytes may represent enhanced innate responses, which favour more robust B‐cell responses. The NK T cells have also been shown to influence B‐cell responses through both IL‐4‐dependent and CD1d‐dependent mechanisms.48, 49, 50, 51 Furthermore, NK T cells support plasma cell responses and antibody production,52 and they may also act indirectly through their effect on CD4 and CD8 T cells.53, 54 The different set of variables associated with the memory B‐cell ELISPOT response should not necessarily be surprising. The B‐cell ELISPOT outcome is far more complex than an HAI titre. Each influenza‐specific B cell may make variable quantities of influenza‐specific antibodies, and each B cell may make antibodies directed against different influenza proteins or different epitopes within the same protein. Even if two B cells make antibody targeting the same epitope, they may do so with different binding affinities. These differences may alter the ability of antibodies from each B cell to carry out a given effector function (haemagglutination, neutralization, opsonization). Our data highlight the complexity of immune responses and demonstrate that simple, easy assays (such as HAI) do not capture the full extent of a developing immune response.
A limitation of this study is a narrow age range that does not allow us to generalize our results to children, young adults, or the very old. As noted before, additional activation markers should also be examined in the context of influenza vaccination. Another limitation is that the flow panels did not distinguish antigen‐specific T‐cell and B‐cell numbers. These populations probably behave in a different manner than the bulk T‐cell and B‐cell populations. However, our intent was to determine whether or not large‐scale alterations in leucocyte populations occurred and whether or not those changes could serve as predictive biomarkers.
The strengths of our study include a thorough investigation of the level of, and changes in, APC and Treg cell subsets pre‐ and post‐vaccination. Correlations between levels of these cell types and three measures of influenza‐vaccine‐specific immune response were identified using two separate modelling techniques. A consistent finding has been the value of examining activation markers such as HLA‐DR or CD86 in predicting humoral responses after vaccination. Similar findings have been reported by Van Duin et al., where the ability of monocytes to up‐regulate CD80 after TLR stimulation was associated with increased antibody responses to influenza vaccination.37 A critical role for CD80 and CD86 in the generation of influenza‐specific T‐cell responses (including Treg cell activity) has also been demonstrated.55, 56, 57
Vaccination of older individuals in order to elicit protective immunity against pathogens is often complicated by pre‐existing medical conditions, medication usage, and perhaps most importantly by the age‐related decline in immune function (immunosenescence). The development of more effective vaccines and treatment options for older individuals will require a more comprehensive understanding of how the various components of the immune response collectively respond to immunization or infection. We and others have described how specific cell subsets each play important roles in the generation of immunity, and recent findings have amply demonstrated that the interactive, synergistic nature of the immune system may be far more important for protective immunity than any single component – a concept referred to as the ‘immune response network theory’.58, 59, 60 Following from this concept, we believe that vaccinomics approaches integrating high dimensional data sets and predictive modelling will be crucial to understanding, at a systems level, how the immune system functions, as we have previously elucidated.59, 60, 61, 62 This understanding can then be applied towards the rational and directed development of better vaccines.
Disclosures
Dr Poland is the chair of a Safety Evaluation Committee for novel investigational vaccine trials being conducted by Merck Research Laboratories; he offers consultative advice on vaccine development to Merck & Co. Inc., CSL Biotherapies, Avianax, Dynavax, Novartis Vaccines and Therapeutics, Emergent Biosolutions, Adjuvance, and Microdermis; and holds two patents related to vaccinia and measles peptide research. Dr Kennedy has received funding from Merck Research Laboratories to study waning immunity to mumps vaccine. These activities have been reviewed by the Mayo Clinic Conflict of Interest Review Board and are conducted in compliance with Mayo Clinic Conflict of Interest policies. This research has been reviewed by the Mayo Clinic Conflict of Interest Review Board and was conducted in compliance with Mayo Clinic Conflict of Interest policies.
Acknowledgements
RBK, ALO and GAP designed the study; MJG and WLS performed the experiments; DEG, ALO and KMG provided statistical analyses. RBK, ALO, GAP, MJG, WLS and DEG were all involved in data interpretation and discussion. All authors contributed to the writing of the paper.
We appreciate the time and effort that the study subjects devoted to this study. We thank the Mayo Clinic nurses and study coordinators for their efforts in subject recruitment. We acknowledge funding support from NIAID and the Human Immunology Project Consortium through AI89859. The content is solely the responsibility of the authors and does not necessarily represent the official views of the National Institutes of Health.
References
- 1. Matsuzaki Y, Katsushima N, Nagai Y, Shoji M, Itagaki T, Sakamoto M et al Clinical features of influenza C virus infection in children. J Infect Dis 2006; 193:1229–35. [DOI] [PubMed] [Google Scholar]
- 2. Centers for Disease Control and Prevention . Estimates of Deaths Associated with Seasonal Influenza‐United States, 1976‐2007. Morb Mortal Wkly Rep 2010; 59:1057–62. [PubMed] [Google Scholar]
- 3. Ridenhour BJ, Campitelli MA, Kwong JC, Rosella LC, Armstrong BG, Mangtani P et al Effectiveness of inactivated influenza vaccines in preventing influenza‐associated deaths and hospitalizations among Ontario residents aged ≥ 65 years: estimates with generalized linear models accounting for healthy vaccinee effects. PLoS ONE 2013; 8:e76318. [DOI] [PMC free article] [PubMed] [Google Scholar]
- 4. Pera A, Campos C, Lopez N, Hassouneh F, Alonso C, Tarazona R et al Immunosenescence: implications for response to infection and vaccination in older people. Maturitas 2015; 82:50–5. [DOI] [PubMed] [Google Scholar]
- 5. Haq K, McElhaney JE. Immunosenescence: influenza vaccination and the elderly. Curr Opin Immunol 2014; 29C:38–42. [DOI] [PubMed] [Google Scholar]
- 6. Haralambieva IH, Painter SD, Kennedy RB, Ovsyannikova IG, Lambert ND, Goergen KM, et al The Impact of Immunosenescence on Humoral Immune Response Variation after Influenza A/H1N1 Vaccination in Older Subjects. PLoS ONE 2015; 10:e0122282. [DOI] [PMC free article] [PubMed] [Google Scholar]
- 7. Rudenko L, Sellwood C, Russell C, Herfst S, Gross D, Dingwall R. Will there ever be a new influenza pandemic and are we prepared? Vaccine 2015; 33:7037–40. [DOI] [PubMed] [Google Scholar]
- 8. Simonsen L, Clarke MJ, Schonberger LB, Arden NH, Cox NJ, Fukuda K. Pandemic versus epidemic influenza mortality: a pattern of changing age distribution. J Infect Dis 1998; 178:53–60. [DOI] [PubMed] [Google Scholar]
- 9. McAuley JL, Kedzierska K, Brown LE, Shanks GD. Host immunological factors enhancing mortality of young adults during the 1918 influenza pandemic. Front Immunol 2015; 6:419. [DOI] [PMC free article] [PubMed] [Google Scholar]
- 10. van der Geest KS, Abdulahad WH, Tete SM, Lorencetti PG, Horst G, Bos NA et al Aging disturbs the balance between effector and regulatory CD4+ T cells. Exp Gerontol 2014; 60:190–6. [DOI] [PubMed] [Google Scholar]
- 11. Sakaguchi S. Naturally arising Foxp3‐expressing CD25+ CD4+ regulatory T cells in immunological tolerance to self and non‐self. Nat Immunol 2005; 6:345–52. [DOI] [PubMed] [Google Scholar]
- 12. Kennedy RB, Tosh PK, Goergen KM, Grill DE, Oberg AL, Poland GA. Statistical modeling using early markers of innate immunity to explain variation in humoral responses to influenza vaccine in older adults. Vaccine 2015; 33:3682–8. [DOI] [PMC free article] [PubMed] [Google Scholar]
- 13. Jacobson RM, Grill DE, Oberg AL, Tosh PK, Ovsyannikova IG, Poland GA. Profiles of influenza A/H1N1 vaccine response using hemagglutination‐inhibition titers. Hum Vaccin Immunother 2015; 11:961–9. [DOI] [PMC free article] [PubMed] [Google Scholar]
- 14. Painter SD, Haralambieva IH, Ovsyannikova IG, Grill DE, Poland GA. Detection of influenza A/H1N1‐specific human IgG‐secreting B cells in older adults by ELISPOT assay. Viral Immunol 2014; 27:32–8. [DOI] [PMC free article] [PubMed] [Google Scholar]
- 15. Ovsyannikova IG, White SJ, Larrabee BR, Grill DE, Jacobson RM, Poland GA. Leptin and leptin‐related gene polymorphisms, obesity, and influenza A/H1N1 vaccine‐induced immune responses in older individuals. Vaccine 2014; 32:881–7. [DOI] [PMC free article] [PubMed] [Google Scholar]
- 16. Salk HM, Haralambieva IH, Ovsyannikova IG, Goergen KM, Poland GA. Granzyme B ELISPOT assay to measure influenza‐specific cellular immunity. J Immunol Methods 2013; 18:44–50. [DOI] [PMC free article] [PubMed] [Google Scholar]
- 17. Ovsyannikova IG, White SJ, Albrecht RA, Garcia‐Sastre A, Poland GA. Turkey versus guinea pig red blood cells: hemagglutination differences alter hemagglutination inhibition responses against influenza A/H1N1. Viral Immunol 2014; 27:174–8. [DOI] [PMC free article] [PubMed] [Google Scholar]
- 18. FLUARIX . Highlights of Prescribing Information. Package insert. http://id-ea.org/wp-content/uploads/2012/05/Fluarix-Package-Insert.pdf. 2010.
- 19. Umlauf BJ, Haralambieva IH, Ovsyannikova IG, Kennedy RB, Pankratz VS, Jacobson RM et al Associations between demographic variables and multiple measles‐specific innate and cell‐mediated immune responses after measles vaccination. Viral Immunol 2012; 25:29–36. [DOI] [PMC free article] [PubMed] [Google Scholar]
- 20. Zou H, Hastie T. Regularization and variable selection via the elastic net. J R Stat Soc Series B 2005; 67, part 2: 301–20. [Google Scholar]
- 21. Friedman J, Hastie T, Tibshirani R. Regularization paths for generalized linear models via coordinate descent. J Stat Softw 2010; 33:1–22. [PMC free article] [PubMed] [Google Scholar]
- 22. Trigunaite A, Dimo J, Jorgensen TN. Suppressive effects of androgens on the immune system. Cell Immunol 2015; 294:87–94. [DOI] [PubMed] [Google Scholar]
- 23. Sutherland JS, Goldberg GL, Hammett MV, Uldrich AP, Berzins SP, Heng TS et al Activation of thymic regeneration in mice and humans following androgen blockade. J Immunol 2005; 175:2741–53. [DOI] [PubMed] [Google Scholar]
- 24. Roden AC, Moser MT, Tri SD, Mercader M, Kuntz SM, Dong H et al Augmentation of T cell levels and responses induced by androgen deprivation. J Immunol 2004; 173:6098–108. [DOI] [PubMed] [Google Scholar]
- 25. Bouman A, Schipper M, Heineman MJ, Faas MM. Gender difference in the non‐specific and specific immune response in humans. Am J Reprod Immunol [Research Support, Non‐U.S. Gov't]. 2004; 52:19–26. [DOI] [PubMed] [Google Scholar]
- 26. Posma E, Moes H, Heineman MJ, Faas MM. The effect of testosterone on cytokine production in the specific and non‐specific immune response. Am J Reprod Immunol 2004; 52:237–43. [DOI] [PubMed] [Google Scholar]
- 27. Klein SL, Jedlicka A, Pekosz A. The Xs and Y of immune responses to viral vaccines. Lancet Infect Dis 2010; 10:338–49. [DOI] [PMC free article] [PubMed] [Google Scholar]
- 28. Engler RJ, Nelson MR, Klote MM, VanRaden MJ, Huang CY, Cox NJ et al Half‐ vs full‐dose trivalent inactivated influenza vaccine (2004–2005): age, dose, and sex effects on immune responses. Arch Intern Med 2008; 168:2405–14. [DOI] [PubMed] [Google Scholar]
- 29. Cook IF. Sexual dimorphism of humoral immunity with human vaccines. Vaccine [Review]. 2008; 30:3551–5. [DOI] [PubMed] [Google Scholar]
- 30. Edwards KM, Burns VE, Allen LM, McPhee JS, Bosch JA, Carroll D et al Eccentric exercise as an adjuvant to influenza vaccination in humans. Brain Behav Immun 2007; 21:209–17. [DOI] [PubMed] [Google Scholar]
- 31. Cook IF, Barr I, Hartel G, Pond D, Hampson AW. Reactogenicity and immunogenicity of an inactivated influenza vaccine administered by intramuscular or subcutaneous injection in elderly adults. Vaccine 2006; 24:2395–402. [DOI] [PubMed] [Google Scholar]
- 32. Jentsch‐Ullrich K, Koenigsmann M, Mohren M, Franke A. Lymphocyte subsets’ reference ranges in an age‐ and gender‐balanced population of 100 healthy adults – a monocentric German study. Clin Immunol 2005; 116:192–7. [DOI] [PubMed] [Google Scholar]
- 33. Valiathan R, Deeb K, Diamante M, Ashman M, Sachdeva N, Asthana D. Reference ranges of lymphocyte subsets in healthy adults and adolescents with special mention of T cell maturation subsets in adults of South Florida. Immunobiology 2014; 219:487–96. [DOI] [PubMed] [Google Scholar]
- 34. Wikby A, Mansson IA, Johansson B, Strindhall J, Nilsson SE. The immune risk profile is associated with age and gender: findings from three Swedish population studies of individuals 20–100 years of age. Biogerontology 2008; 9:299–308. [DOI] [PubMed] [Google Scholar]
- 35. Amadori A, Zamarchi R, De Silvestro G, Forza G, Cavatton G, Danieli GA et al Genetic control of the CD4/CD8 T‐cell ratio in humans. Nat Med 1995; 1:1279–83. [DOI] [PubMed] [Google Scholar]
- 36. Starr SE, Bandyopadhyay S, Shanmugam V, Hassan N, Douglas S, Jackson SJ et al Morphological and functional differences between HLA‐DR+ peripheral blood dendritic cells and HLA‐DR+ IFN‐α producing cells. Adv Exp Med Biol 1993; 329:173–8. [DOI] [PubMed] [Google Scholar]
- 37. van Duin D, Allore HG, Mohanty S, Ginter S, Newman FK, Belshe RB et al Prevaccine determination of the expression of costimulatory B7 molecules in activated monocytes predicts influenza vaccine responses in young and older adults. J Infect Dis 2007; 195:1590–7. [DOI] [PubMed] [Google Scholar]
- 38. Cao W, Taylor AK, Biber RE, Davis WG, Kim JH, Reber AJ et al Rapid differentiation of monocytes into type I IFN‐producing myeloid dendritic cells as an antiviral strategy against influenza virus infection. J Immunol 2012; 189:2257–65. [DOI] [PMC free article] [PubMed] [Google Scholar]
- 39. Fonteneau JF, Gilliet M, Larsson M, Dasilva I, Munz C, Liu YJ et al Activation of influenza virus‐specific CD4+ and CD8+ T cells: a new role for plasmacytoid dendritic cells in adaptive immunity. Blood 2003; 101:3520–6. [DOI] [PubMed] [Google Scholar]
- 40. Kennedy R, Undale AH, Kieper WC, Block MS, Pease LR, Celis E. Direct cross‐priming by Th lymphocytes generates memory cytotoxic T cell responses. J Immunol 2005; 174:3967–77. [DOI] [PubMed] [Google Scholar]
- 41. LaSalle JM, Tolentino PJ, Freeman GJ, Nadler LM, Hafler DA. Early signaling defects in human T cells anergized by T cell presentation of autoantigen. J Exp Med 1992; 176:177–86. [DOI] [PMC free article] [PubMed] [Google Scholar]
- 42. Baecher‐Allan C, Brown JA, Freeman GJ, Hafler DA. CD4+ CD25high regulatory cells in human peripheral blood. J Immunol 2001; 167:1245–53. [DOI] [PubMed] [Google Scholar]
- 43. Baecher‐Allan C, Wolf E, Hafler DA. MHC class II expression identifies functionally distinct human regulatory T cells. J Immunol 2006; 176:4622–31. [DOI] [PubMed] [Google Scholar]
- 44. Itoh K, Hirohata S. The role of IL‐10 in human B cell activation, proliferation, and differentiation. J Immunol 1995; 154:4341–50. [PubMed] [Google Scholar]
- 45. Choe J, Choi YS. IL‐10 interrupts memory B cell expansion in the germinal center by inducing differentiation into plasma cells. Eur J Immunol 1998; 28:508–15. [DOI] [PubMed] [Google Scholar]
- 46. Li MO, Wan YY, Sanjabi S, Robertson AK, Flavell RA. Transforming growth factor‐β regulation of immune responses. Annu Rev Immunol 2006; 24:99–146. [DOI] [PubMed] [Google Scholar]
- 47. Dugas B, Renauld JC, Pene J, Bonnefoy JY, Peti‐Frere C, Braquet P, et al Interleukin‐9 potentiates the interleukin‐4‐induced immunoglobulin (IgG, IgM and IgE) production by normal human B lymphocytes. Eur J Immunol 1993; 23:1687–92. [DOI] [PubMed] [Google Scholar]
- 48. Yoshimoto T, Bendelac A, Hu‐Li J, Paul WE. Defective IgE production by SJL mice is linked to the absence of CD4+, NK1.1+ T cells that promptly produce interleukin 4. Proc Natl Acad Sci USA 1995; 92:11931–4. [DOI] [PMC free article] [PubMed] [Google Scholar]
- 49. Yoshimoto T, Min B, Sugimoto T, Hayashi N, Ishikawa Y, Sasaki Y et al Nonredundant roles for CD1d‐restricted natural killer T cells and conventional CD4+ T cells in the induction of immunoglobulin E antibodies in response to interleukin 18 treatment of mice. J Exp Med 2003; 197:997–1005. [DOI] [PMC free article] [PubMed] [Google Scholar]
- 50. Molano A, Park SH, Chiu YH, Nosseir S, Bendelac A, Tsuji M. Cutting edge: the IgG response to the circumsporozoite protein is MHC class II‐dependent and CD1d‐independent: exploring the role of GPIs in NK T cell activation and antimalarial responses. J Immunol 2000; 164:5005–9. [DOI] [PubMed] [Google Scholar]
- 51. Belperron AA, Dailey CM, Bockenstedt LK. Infection‐induced marginal zone B cell production of Borrelia hermsii‐specific antibody is impaired in the absence of CD1d. J Immunol 2005; 174:5681–6. [DOI] [PubMed] [Google Scholar]
- 52. Devera TS, Shah HB, Lang GA, Lang ML. Glycolipid‐activated NKT cells support the induction of persistent plasma cell responses and antibody titers. Eur J Immunol 2008; 38:1001–11. [DOI] [PMC free article] [PubMed] [Google Scholar]
- 53. Su HC, Nguyen KB, Salazar‐Mather TP, Ruzek MC, Dalod MY, Biron CA. NK cell functions restrain T cell responses during viral infections. Eur J Immunol 2001; 31:3048–55. [DOI] [PubMed] [Google Scholar]
- 54. Waggoner SN, Cornberg M, Selin LK, Welsh RM. Natural killer cells act as rheostats modulating antiviral T cells. Nature 2012; 481:394–8. [DOI] [PMC free article] [PubMed] [Google Scholar]
- 55. Slavik JM, Hutchcroft JE, Bierer BE. CD28/CTLA‐4 and CD80/CD86 families: signaling and function. Immunol Res 1999; 19:1–24. [DOI] [PubMed] [Google Scholar]
- 56. Seah SG, Carrington EM, Ng WC, Belz GT, Brady JL, Sutherland RM et al Unlike CD4+ T‐cell help, CD28 costimulation is necessary for effective primary CD8+ T‐cell influenza‐specific immunity. Eur J Immunol 2012; 42:1744–54. [DOI] [PubMed] [Google Scholar]
- 57. Bour‐Jordan H, Bluestone JA. Regulating the regulators: costimulatory signals control the homeostasis and function of regulatory T cells. Immunol Rev 2009; 229:41–66. [DOI] [PMC free article] [PubMed] [Google Scholar]
- 58. Poland GA, Kennedy RB, McKinney BA, Ovsyannikova IG, Lambert ND, Jacobson RM et al Vaccinomics, adversomics, and the immune response network theory: Individualized vaccinology in the 21st century. Semin Immunol 2013; 25:89–103. [DOI] [PMC free article] [PubMed] [Google Scholar]
- 59. Oberg AL, McKinney BA, Schaid DJ, Pankratz VS, Kennedy RB, Poland GA. Lessons learned in the analysis of high‐dimensional data in vaccinomics. Vaccine 2015; 33:5262–70. [DOI] [PMC free article] [PubMed] [Google Scholar]
- 60. Poland GA, Kennedy RB, Ovsyannikova IG. Vaccinomics and personalized vaccinology: Is science leading us toward a new path of directed vaccine development and discovery? PLoS Pathog 2011; 7:e1002344. [DOI] [PMC free article] [PubMed] [Google Scholar]
- 61. Poland GA, Ovsyannikova IG, Jacobson RM, Smith DI. Heterogeneity in vaccine immune response: the role of immunogenetics and the emerging field of vaccinomics. Clin Pharmacol Ther 2007; 82:653–64. [DOI] [PubMed] [Google Scholar]
- 62. Kennedy RB, Poland GA. The Top Five “Game Changers” in Vaccinology: Toward Rational and Directed Vaccine Development. OMICS 2011; 15:533–7. [DOI] [PMC free article] [PubMed] [Google Scholar]