Abstract
In gram-negative bacteria, the chaperone protein Skp forms specific and stable complexes with membrane proteins while they are transported across the periplasm to the outer membrane. The jellyfish-like architecture of Skp is similar to the eukaryotic and archeal prefoldins and the mitochondrial Tim chaperones, that is α-helical ‘tentacles’ extend from a β-strand ‘body’ to create an internal cavity. Contrast variation small-angle neutron scattering (SANS) experiments on Skp alone in solution and bound in two different complexes to unfolded outer membrane proteins (uOMPs), OmpA and OmpW, demonstrate that the helical tentacles of Skp bind their substrate in a clamp-like mechanism in a conformation similar to that previously observed in the apo crystal structure of Skp. Deuteration of the uOMP component combined with contrast variation analysis allowed the shapes of Skp and uOMP as well as the location of uOMP with respect to Skp to be determined in both complexes. This represents unique information that could not be obtained without deuterium labeling of the uOMPs. The data yield the first direct structural evidence that the α-helical Skp tentacles move closer together on binding its substrate and that the structure of Skp is different when binding different uOMPs. This work presents, by example, a tutorial on performing SANS experiments using both deuterium labeling and contrast variation, including SANS theory, sample preparation, data collection, sample quality validation, data analysis and structure modeling.
Keywords: Skp, jellyfish-like chaperone, holdase, periplasm, Outer Membrane Protein (OMP) transport, disordered protein, small-angle neutron scattering, SANS
1. INTRODUCTION
In gram negative bacteria, unfolded outer membrane beta-barrel proteins (uOMPs) interact with periplasmic chaperones in order to be trafficked to the outer membrane. Two of these chaperones, Skp and SurA, form stable complexes with uOMPs as they travel across the aqueous periplasm. These chaperones exhibit holdase activity because they protect their substrates from aggregation, as well as from cleavage by the periplasmic protease DegP (S. Wu et al., 2011).
Even though Skp and SurA appear to have redundant functions, their relative activities are dependent on bacterial species and whether or not the bacteria are under stress (Denoncin, Schwalm, Vertommen, Silhavy, & Collet, 2012; Rhodius, Suh, Nonaka, West, & Gross, 2006; Sklar, Wu, Kahne, & Silhavy, 2007). Although not a lethal mutation in E. coli, loss of Skp results in a relative decline in uOMP concentration in the bacterial outer membrane (R. Chen & Henning, 1996).
Skp binds a wide range of bacterial uOMPs with nanomolar affinity (Moon, Zaccai, Fleming, Gessmann, & Fleming, 2013; Qu, Mayer, Behrens, Holst, & Kleinschmidt, 2007). At least nineteen different E. coli uOMPs interact with Skp (Jarchow, Lück, Görg, & Skerra, 2008). These substrates vary in sequence composition and in size (20kDa to 150kDa). In bacteria, Skp-uOMP complexes form in the periplasm near the bacterial inner membrane (Schäfer, Beck, & Müller, 1999). The Skp-uOMP complex is then transported to the outer membrane where the uOMP folding is thought to be mediated by the Bam complex (Webb, Heinz, & Lithgow, 2012). In vivo, the Skp-presented bound uOMP could directly interact with the Bam complex, or uOMP could first be delivered by Skp to SurA, which then transports it to the Bam complex (Ieva, Tian, Peterson, & Bernstein, 2011; Schwalm, Mahoney, Soltes, & Silhavy, 2013; Sklar et al., 2007). Skp may also transfer the uOMP directly to the bacterial outer membrane as in vitro experiments demonstrate that Skp-bound uOMPs retain the ability to fold into lipid bilayers containing phosphatidylcholine and phosphatidylglycerol (Bulieris, Behrens, Holst, & Kleinschmidt, 2003; McMorran, Bartlett, Huysmans, Radford, & Brockwell, 2013).
The holdase activity of Skp is not limited to specific membrane proteins (Jarchow et al., 2008). Skp is able to form a complex with the periplasmic domain of the auto transporter EspP (Ieva et al., 2011). It can also inhibit the aggregation and assist the folding of a number of soluble proteins. Notable examples include single chain antibodies (Entzminger, Chang, Myhre, McCallum, & Maynard, 2012) and lysozyme (Walton & Sousa, 2004).
Skp forms a stable trimer (50 kDa) in solution as determined by gel filtration as well as cross-linking methods (Schlapschy et al., 2004) and as supported by crystal structures (Korndörfer, Dommel, & Skerra, 2004; Walton & Sousa, 2004). Three α–helical ‘tentacles’ extend out from the β–strand Skp ‘body’ to create a cavity sufficiently large to surround a 25 kDa substrate. This domain architecture, termed jellyfish-like fold, had been previously described for other holdases, including the archaeal and eukaryotic prefoldins and the mitochondrial small Tim proteins (Stirling, Bakhoum, Feigl, & Leroux, 2006). Like Skp, these holdases have the common property of protecting their substrates from aggregation. However, no sequence identity to Skp was present, and unlike the trimeric Skp, these proteins are heterohexamers, with six alpha helical tentacles each.
X-ray and subsequent NMR data could not directly provide an explanation for the ability of Skp to bind a wide range of uOMPs of different sizes. It was hypothesized that an uOMP transmembrane (TM) domain is bound within an adaptable cavity formed by the α-helical tentacles of Skp. NMR analysis of Skp-OmpA and Skp-OmpX complexes indicated that the uOMP TM region contains little secondary structure while in complex with Skp (Burmann & Hiller, 2012; Burmann, Wang, & Hiller, 2013; Callon, Burmann, & Hiller, 2014; Walton, Sandoval, Fowler, Pardi, & Sousa, 2009). However, the ability of Skp to bind diverse substrates begs the question as to whether changes occur in the tertiary structure of Skp upon binding a client substrate.
In this study, a series of contrast variation small-angle neutron scattering (SANS) experiments were performed on Skp alone in solution and on two different Skpu-OMP complexes: Skp-OmpA and Skp-OmpW, in order to clarify the structural basis of uOMP presentation by Skp. OmpA has a role in E. coli cell morphology and stability. Folded OmpA (35 kDa) has a C-terminal periplasmic (PP) domain that folds independently from its transmembrane (TM) domain (Danoff & Fleming, 2011; Walton et al., 2009). OmpW (21 kDa) is an integral membrane protein that is required for resistance to phagocytosis (X.-B. Wu et al., 2013). The atomic resolution structures of the TM domains of both these proteins revealed an 8-stranded beta barrel when folded into membranes (Hong, Patel, Tamm, & van den Berg, 2006; Pautsch & Schulz, 1998). The folding properties of these proteins have been extensively investigated (Burgess, Dao, Stanley, & Fleming, 2008; Moon et al., 2013). Selective labeling by deuteration of OmpW and OmpA in the Skp-uOMP complexes allowed the determination of the individual structures of uOMP and Skp as well as their relationship to each other in complexes.
The SANS data indicate that Skp interacts with the uOMP TM domain in a manner analogous to the binding mechanism of prefoldins binding their unfolded substrates (Martín-Benito et al., 2002, 2007). The bulk of the unfolded TM domain of both OmpW and OmpA is within the Skp cavity but some parts must be on the exterior of Skp near the tips of the tentacles to be in agreement with the SANS data. The PP domain of OmpA can assume a number of different positions outside the Skp cavity and still be consistent with the data. These results yield the first direct structural evidence that the α-helical Skp tentacles move closer together on binding its substrate and that the structure of the individual helices of the tentacles is different when binding different uOMPs. Importantly, the SANS data represent unique information that could not be obtained without deuterium labeling of the uOMPs. Analysis of the SANS data provides experimental support for a simple clamp-like mechanism used by jellyfish-like chaperones (Stirling et al., 2006). It also allows postulation of a mechanism of Skp binding and delivery of uOMPs to the bacterial outer membrane.
2. SANS FROM BIOLOGICAL MOLECULES IN SOLUTION
SANS is able to provide the size, molecular mass and shape of a macromolecular complex in solution on length scales between approximately 10 Å to about 1000 Å (Jacques & Trewhella, 2010; Jacrot, 1976; Moore, 1982; Zaccai, 2012). While analytical ultracentrifugation (AUC) can be used to ascertain the Skp-uOMP stoichiometry and small-angle X-ray scattering (SAXS) can yield the overall size and shape of the Skp-uOMP complex, analysis of contrast variation SANS data can uniquely retrieve the internal structure and organization of the complex. Recent reviews (Heller, 2010; Whitten & Trewhella, 2009) as well as classic papers (Engelman & Moore, 1975; Ibel & Stuhrmann, 1975; Jacrot, 1976) describe the contrast variation technique in detail.
2.1 Contrast and scattering intensity
Because neutrons interact with atomic nuclei, the strength of the scattering interaction is not dependent on the atomic number, Z, of the atom, as is the case for x-rays. Therefore, the light elements such as H, C, N and O can scatter neutrons just as strongly as heavier elements. Also, neutrons are sensitive to different isotopes of an element, such as hydrogen and deuterium. Since SANS does not provide information on atomic length scales, the strength of the scattering interaction can be described in terms of a uniform scattering length density of the entire molecule, ρ, within the molecular volume, V (in cm3 or Å3). For biological molecules in solution, the strength of the scattering is further defined as the difference in the scattering length densities of the molecule and the solvent within the same molecular volume. This difference in scattering length densities is known as the contrast, and is written as
| (1) |
where ρs is the scattering length density of the solvent. When the scattering length densities of the molecule and solvent are the same, Δρ = 0. This is called the contrast match point. The scattering length densities and contrast are usually expressed in units of cm−2 or cm Å−3, but can be found stated in units of Å−2.
The measured SANS intensity from a solution of monodisperse, randomly-oriented biological macromolecules can be written in terms of the contrast as
| (2) |
where |F(q⃗)|2 is the scattering form factor, which depends on the shape of the molecule and n is the number density of molecules (in cm−3). The brackets represent an averaging over all orientations of the molecule. The magnitude of the scattering vector q⃗ can be written as
| (3) |
where 2θ is the scattering angle (in degrees), measured from the axis of the incoming neutron beam, and λ is the neutron wavelength. The wavelength is usually expressed in nm or Å, such that q is stated in units of nm−1 or Å−1. It can be seen from Eq. 2 that the scattering intensity at the contrast match point, Δρ = 0, is zero.
2.2 Radius of gyration and forward scattering intensity
The radius of gyration, Rg, and the forward scattering intensity, I(0), which is the scattering intensity at q = 0, are two important model-independent parameters that are obtained from SANS data. Rg provides information about the size of the molecule. A shape must be assumed for the molecule to relate Rg to the molecular dimensions. For example, a solid sphere has a radius, r, which is equal to 1.3Rg.
By definition, the scattering form factor in Eq. 2 is equal to 1.0 at q = 0. Thus, I(0) is related to the number density, n, as
| (4) |
The number density can be written in terms of the concentration of the molecule, c (g cm−3), as
| (5) |
where Mw is the molecular weight of the molecule (in Da, where 1 Da = 1 g mole−1) and NA is Avogadro’s number. Eqs. 4 and 5 can be used to relate I(0) to the Mw of the molecule if the SANS data are on an absolute scale, usually in units of cm−1.
The Guinier approximation (Guinier & Fournet, 1955),
| (6) |
can be used on the low-q portions of the data to obtain values for Rg and I(0). This “low-q” analysis is valid only in the region where qRg ≲ 1.3. Rg and I(0) are found by plotting the natural log of Eq. 6 such that
| (7) |
A linear fit of ln(I(q)) versus q2 (Eq. 7) to the low-q portion of the data allows the determination of Rg from the slope and I(0) from the intercept. If there are aggregates of the molecule in the solution, Eq. 7 will not be linear. Rather it will have some curvature and the fit to a straight line will be poor. The effects can be subtle or very obvious depending on the severity of the aggregation (Jacques & Trewhella, 2010). If aggregation is present, whether subtle or severe, the Rg value found from Eq. 7 no longer represents that of a single monomer in a monodisperse solution. Rather, it is influenced by the larger aggregates present in the solution.
Another method to obtain Rg, which makes use of all of the data rather than a limited data set at small q values, is to use the distance distribution function, P(r) versus r, to determine Rg, and I(0) (Glatter & Kratky, 1982). This function represents the probability distribution of distances, r, between all pairs of atoms in the molecule. The result is a smooth histogram-like plot that peaks at the most probable distance in the molecule. Thus, the shape of the P(r) versus r curve depends strongly on the shape of the molecule.
P(r) is typically obtained from the SANS data using an indirect Fourier transformation method (Glatter, 1977; Moore, 1982; Semenyuk & Svergun, 1991) using the relation
| (8) |
This analysis requires a stipulation by the user of a maximum dimension, Dmax, beyond which P(r) = 0. Typically, several values of Dmax are explored in order to find the range over which the P(r) function doesn’t change as a function of Dmax. The P(r) function is also sensitive to aggregation. The more severe the aggregation, the more difficult it is to determine Dmax (Jacques & Trewhella, 2010).
2.3 Contrast variation
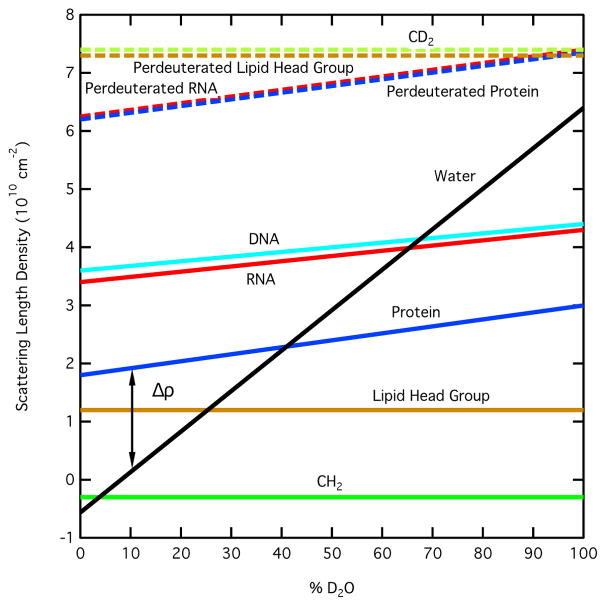
The scattering length density of water is shown as a function of % D2O in the solvent in Figure 1, along with scattering length densities of some typical biological molecules and compounds. The lines are straight for CH2 and CD2 because there is no exchange of deuterium for hydrogen as the % D2O increases in the solvent. However, for proteins and nucleic acids, labile hydrogen atoms, i.e., those bound to nitrogen and oxygen, will exchange with deuterium in the solvent, so their scattering length densities vary with increasing % D2O. A vertical line representing the contrast, Δρ, between protein and water is shown on the graph for 10 % D2O in the solvent. Note that the protein and water lines cross at 40 % D2O, which is the contrast match point for most typical proteins. The match points for DNA, RNA, lipid head groups and CH2 can be found in the same manner. Note that the scattering length densities for perdeuterated molecules do not cross the water line. Thus, the match points for these molecules are greater than 100 % D2O and cannot be reached in practice.
Figure 1.
Plot of the neutron scattering length density versus % D2O in the solvent for water compared to those for protein, RNA, DNA and the components of lipids (lipid head group and CH2), along with their perdeuterated counterparts.
In cases where a molecule is actually a complex consisting of components that have different scattering length densities, the contrast is different for each of the components. If the ratio of H2O to D2O in the solvent is varied, the contrast of each component will change as a function of the concentration of D2O in the solvent. Thus, contrast match points exist for each of the two components as well as the entire complex. By varying the amount of D2O in the solvent, one component can be essentially transparent at its match point while the other is still visible. It is this feature of SANS that makes the method so powerful for selective measurement of individual components within a complex. From Figure 1, it is clear that proteins and nucleic acids have different contrast match points. The protein match point is around 40 % D2O, meaning that only the DNA or RNA is visible at this contrast. The DNA and RNA match points are around 65 % D2O such that only the protein is visible under these conditions. Therefore, complexes consisting of proteins and nucleic acids are ideal candidates for contrast variation experiments.
For a complex consisting of two proteins, replacement of the non-exchangeable hydrogen atoms, i.e., those bound to carbon, with deuterium in one of the components is required in order for the two match points to be different. This is typically accomplished by expressing one of the protein components using bacterium grown in deuterium-enriched media. Figure 1 shows that the match point of perdeuterated proteins, in which all non-exchangeable hydrogen atoms have been replaced by deuterium, is above 100 % D2O. Therefore, partially deuterated proteins are generally used for contrast variation experiments so that the match point of the deuterated component is somewhere between 60 % D2O and 100 % D2O. The exact match point of a deuterated component is dependent on the amount of deuteration achieved. The contrast variation experiment can be used to verify this parameter, especially if a reliable determination cannot be made by other methods such as mass spectrometry.
2.4 Contrast match point analysis of the SANS contrast variation data
For a two-component complex in which the components have different contrasts, the contrast match points for the complex are determined from I(0). Expanding on Eq. 4,
| (9) |
The number density, n, is defined as in Eq. 5, but it is now in terms of the concentration and Mw of the entire complex. Δρ now refers to the mean contrast of the entire complex and V is the volume of the complex. The expression on the right is now written in terms of the two components, where f1 and f2 are the mass fractions of the 1st and 2nd components in the complex, Δρ1 and Δρ2 are the scattering contrasts of the 1st and 2nd components and V1 and V2 are the volumes of the 1st and 2nd components. Thus, Eq. 9 can be combined with Eq. 5 to relate I(0) to the Mw of the complex if the SANS data are on an absolute scale. This is a good quality assurance test on the data. If the complex has the expected Mw at all contrasts, then it is likely that the stoichiometry of the two components is correct at all contrasts. It is important to recognize that care should be taken to obtain the concentrations of the complexes as accurately as possible at each contrast because uncertainty in this value is a major source of error on the calculation of the Mw.
Because I(0) is proportional to Δρ2 (Eqs. 4 and 9), which is in turn dependent on the fraction of D2O in the solvent, fD2O, and n is proportional to c (Eq. 5), the contrast match point of the complex can be determined from the x-intercept of a linear fit to versus fD2O. The match point of the complex can also be calculated from the sequences of the components (Sarachan, Curtis, & Krueger, 2013; Whitten, Cai, & Trewhella, 2008). Using both approaches to determine the match point provides another quality assurance test on the data in that the calculated and experimentally determined match points should agree with each other.
2.5 Separation of the radii of gyration in a two-component complex
The Rg values obtained at each contrast are related by the relationship (Ibel & Stuhrmann, 1975),
| (10) |
where Rm is the Rg value of the equivalent complex with a homogeneous scattering length density, α is the second moment of the density fluctuations and β is the first moment of the density fluctuations. For two component systems with different scattering length densities, the term α relates to the distribution of scattering length densities relative to the center of mass (CM) of the complex, and the term β provides the separation of the scattering CM of the two components (Moore, 1982). A Stuhrmann plot (Ibel & Stuhrmann, 1975) of versus Δρ−1 (Eq. 10) is used to determine Rm, α, and β. If the plot is linear, then β = 0 and the CM of the two components are concentric. In this case, the sign of the slope of the line, α, is an indication of whether the component with the higher scattering length density is on the interior or exterior of the complex. In practice, it is not always easy to distinguish between a linear and a parabolic Stuhrmann plot, especially if α is close to zero and if Rg values are not available close to the individual match points of the two components.
Similar information can be obtained from the parallel axis theorem
| (11) |
where R1 and R2 are the radii of gyration of the components and DCM is the distance between the scattering CM (Engelman & Moore, 1975). Here,
| (12) |
where Δρi and Vi refer to the individual components and Δρ and V refer to the complex. The parallel axis theorem provides the radii of gyration of the components directly, whereas they are calculated from the definitions of α and β when the Stuhrmann analysis is used (Whitten et al., 2008).
2.6 Separating the scattering intensities in a two-component complex
The scattering intensity from a two-component system with different scattering length densities can be approximated by (Whitten et al., 2008)
| (13) |
where I1(q) and I2(q) are the scattering intensities of components 1 and 2, respectively, and I12(q) is the scattering intensity due to the interference between the two components that occurs because they have different scattering length densities. I1(q) and I2(q) are related to the shapes of the two components and I12(q) is related to their spatial distribution. For a given set of measured contrast variation intensities, I(q), and known values for the contrasts, Δρ1 and Δρ2, the three unknowns, I1(q), I2(q) and I12(q), are found by solving Eq. 13 simultaneously at all contrasts.
This analysis can be a useful tool to model each component separately and then put them in the proper position with respect to each other in the complex. Data must be obtained at a minimum of three contrasts to solve for the three unknowns in Eq. 13. However, in practice, successful studies have employed at least five contrast points and high quality data were obtained at the match points of the individual components. This method worked particularly well in a recent study of a kinase, KinA, in complex with an inhibitor, Sda (Whitten et al., 2007).
2.7 Structure modeling
Both SAXS and SANS are being used for structural determination of large protein complexes and for proteins containing flexible regions in solution. Many options are available for modeling multimeric protein complexes using a combination of rigid body and atomistic approaches, as described in recent reviews (Putnam, Hammel, Hura, & Tainer, 2007; Rambo & Tainer, 2010). The SASSIE software suite (Curtis, Raghunandan, Nanda, & Krueger, 2012) is one tool that is available to assist in the atomistic and rigid body modeling of the structures of biological molecules for comparison to SAXS and SANS data. SASSIE allows users of these techniques access to molecular dynamics, Monte Carlo, docking and rigid body modeling methods to assist in structure modeling and assessment of how well the models fit the data. Constraints can be incorporated from other techniques such as NMR and AUC. For example, SASSIE has been used for the structure modeling of intrinsically disordered monomeric proteins (Curtis et al., 2012), large protein complexes (Krueger, Shin, Raghunandan, Curtis, & Kelman, 2011; Krueger, Shin, Curtis, Rubinson, & Kelman, 2014) and single-stranded nucleic acids (Peng, Curtis, Fang, & Woodson, 2014). It has been also been applied to the study of monoclonal antibodies using free energy analysis (Clark et al., 2013). A web version is available (“SASSIE-web : Beta,”) for ease of access and to handle the intensive computational requirements of the structural modeling and data analysis.
For a two-component complex, SANS and contrast variation experiments provide the added structural information from the individual components as constraints for modeling the entire complex. If obtainable, the scattering intensities of the separate components (Eq. 13) can be helpful for the modeling of the individual components and for construction of the model structure for the entire complex (Whitten et al., 2008). However, the Rg and CM distance constraints found by the Stuhrmann (Eq. 10) and parallel axis theorem (Eqs. 11 and 12) analyses add unique information that can be used in the modeling process even in the absence of the component scattering intensities. Often, structural information for one or both of the components alone in solution is used as a starting point for their structures in the complex.
Structure models that fit the SANS data at all contrasts take full advantage of the information content of the contrast variation data set. Whether or not models are constructed from the scattering intensities of the separate components, the model structures should always be judged against the entire contrast variation data set. Working model structures are tested against the data by calculating SANS curves from the model structures and comparing them to the measured SANS curves at all contrasts. The model structures are then revised as necessary to obtain the best global fit to the entire SANS contrast variation data set.
3. MATERIALS AND METHODS*
3.1 uOMP and Skp expression and purification
The uOMPs were cloned and expressed to inclusion bodies as previously described, except that no detergent was included in the inclusion body washes (Burgess et al., 2008). Deuteration of the uOMPs was accomplished at the NIST/University of Maryland Biomolecular Labeling Laboratory (BL2). To produce the deuterated uOMPs, the OMP genes were re-cloned into the kanamycin-resistant pet28 vector. Expression was performed with HMS cells in deuterated M9 media, containing 60 % D2O. After OD600 ≈ 0.6 was reached, expression was induced with 1 mMoles L−1 (mM) IPTG and the cells were allowed to grow overnight at room temperature. Deuterated inclusion bodies were prepared with the same buffers as for the hydrogenated inclusion bodies. Inclusion bodies were subsequently stored at −20 °C.
The inclusion bodies were dissolved in 20mM Tris (pH 8), 8.0 M urea, and, after centrifugation at 18,000 rpm (1 rpm = 1/60 Hz) in a Beckman J2-MI with a type 21 rotor for 1 h, the clarified supernatant was stored at −80 °C until use. The uOMP concentrations were determined using their calculated extinction coefficient. The respective coefficients used were 52955 M−1 cm−1 for OmpA and 39420 M−1 cm−1 for OmpW.
The expression and purification of Skp has been previously described (Moon et al., 2013). Briefly, the E. coli skp gene (GeneID 944861) was amplified by using the following primers: AGGAGATATACCATGGCTGACAAAAT and GTGATGGTGATGTTTAACCTGTTTCA, and was inserted by ligation-independent cloning into the pOPINE expression vector (Berrow et al., 2007). The resultant plasmid (NZ100) was then transformed into BL21 (DE3) pLysS E. coli (Novagen) for expression of Skp with a C-terminal six-histidine tag. Typically, 2XYT media supplemented with 1 % glucose was inoculated from a frozen cell stock and grown overnight at 37 °C. After 1/50 dilution into fresh media, Skp expression was induced 3 h later with 1 mM IPTG and continued at room temperature for 20 h. Cells were harvested by centrifugation and stored at −20 °C for future use. The frozen cell pellet was resuspended in buffer A [50 mM Tris, pH 8, 500 mM NaCl, 10 % (v/v) glycerol, and 20 mM imidazole] with one Complete EDTA-free protease inhibitor tablet (Roche) per 50 mL buffer and DNase I (Sigma). Cells were lysed by sonication and cell debris removed by centrifugation at 19000 rpm in a size 21 rotor in a Beckman J2-MI centrifuge. The supernatant was applied to a pre-equilibrated Nickel Sepharose High Performance column (GE Healthcare) and washed multiple times with buffer A (without glycerol). Then, recombinant protein was eluted by addition of a mixture of 50 % (v/v) buffer A and 50 % (v/v) buffer B (50 mM Tris, pH 8, 500 mM NaCl, and 500 mM imidazole). Pooled fractions were subjected to gel filtration on a Superdex 200 10/300 GL column (GE Healthcare) and equilibrated in GF buffer (20 mM Tris (pH 8) and 200 mM NaCl) for SANS measurements. When required, the SANS buffer was also prepared with D2O instead of H2O. Because the 1 M Tris (pH 8) stock did not contain deuterium, this buffer contained 98 % (v/v) D2O and 2 % (v/v) H2O (98 % D2O buffer). The Skp trimer concentration was determined using a calculated extinction coefficient (ε280 = 4,470 M−1 cm−1). Nominal Skp concentrations employed were 5.3 mg/mL in H2O (0 % D2O) buffer and 3.6 mg/mL in 98 % D2O buffer.
3.2 Formation of Skp-uOMP complex
The concentration of Skp and uOMP were adjusted so that the uOMP in urea was ≈10 times more concentrated than Skp trimer in GF buffer. The Skp-uOMP complex was then assembled by dropwise addition of the uOMP solution until the first signs of precipitation were observed. The final urea concentration was estimated to be less than 1 M. At each addition of uOMP, the solution was checked for aggregation. After 30 minutes incubation at room temperature, the complex sample was repeatedly diluted two-fold with GF buffer every ten minutes, until the final urea concentration was under 0.1 M. Any aggregates were removed with a 0.22 μm filter and the protein was concentrated to between 2 mg/mL and 5 mg/mL with an Ultra-15 Ultracel 30 k Centrifugal Filter (Millipore UFC903024) prior to being purified on a Superdex 200 10/300 GL column (GE Healthcare) equilibrated in GF buffer. Fractions containing the Skp-uOMP complex were identified from their OD230/OD280 ratio, and the expected stoichiometry was confirmed by SDS-PAGE. The complex was assembled in hydrogenated GF buffer before being also purified by size exclusion chromatography into the deuterated GF buffer.
Prior to data collection, the Skp-uOMP complex was concentrated. Final D2O concentrations were obtained by diluting with the appropriate D2O and H2O GF buffers. The resultant protein concentration was estimated from calculated extinction coefficients. The protein complexes were stored at 4°C and used within 24 h after gel filtration.
3.3 SANS data collection
SANS measurements were performed on the NG3 30 m SANS instrument (Glinka et al., 1998) at the NIST Center for Neutron Research (NCNR) in Gaithersburg, Maryland. The neutron wavelength, λ, was 6 Å, with a wavelength spread, Δλ/λ, of 0.15. Scattered neutrons were detected with a 64 cm × 64 cm two-dimensional, position-sensitive detector with 128 × 128 pixels at a resolution of 0.5 cm/pixel. Data reduction was accomplished using Igor Pro software (WaveMetrics, Lake Oswego, OR) with SANS macros developed at the NCNR (Kline, 2006). Raw counts were normalized to a common monitor count and then corrected for empty cell counts, ambient room background counts, and non-uniform detector response. Data were placed on an absolute scale by normalizing the scattering intensity to the incident beam flux for each individual pixel. Finally, the data were radially averaged to produce the scattering intensity I(q) to plot as I(q) versus q curves. Sample-to-detector distances of 5.0 m and 1.5 m were used in order to cover the range of 0.01 Å−1 ≤ q ≤ 0.4 Å−1. The I(q) versus q scattering data obtained at the two instrument configurations were merged using the NCNR SANS reduction software (Kline, 2006). The I(q) versus q scattering data for the buffer was then subtracted from the data for the corresponding sample. The q-range covered by the data after buffer subtraction was dependent on the H2O/D2O ratio in the buffer.
3.4 Match point and contrast variation data analysis
Determination of I(0) and Rg were performed using the Guinier approximation (Eqs. 6 and 7). The GNOM program (Semenyuk & Svergun, 1991) was used to determine the distance distribution function (Eq. 8) to further confirm the Rg and I(0) values. Theoretical Δρ1 and Δρ2 values were calculated for the Skp and uOMP components and theoretical values were calculated for the complexes as a function of fD2O from the protein sequences using the Contrast Calculator (Sarachan et al., 2013) module of the SASSIE (Curtis et al., 2012) software assuming different percentages of deuteration for the OmpW and OmpA. The values were compared to those obtained from the Guinier analysis, allowing for experimental verification of the complex match point and the amount of deuteration of the uOMP component in the measured samples. The match points of the individual components were then calculated from linear fits to Δρ1 versus fD2O and Δρ2 versus fD2O.
Both the Stuhrmann and parallel axis theorem analyses were performed using the program MULCh (Whitten et al., 2008). The contrasts and volumes were determined from the protein and buffer compositions and the radii of gyration and CM distances were determined using the Guinier Rg and I(0) values obtained from the data.
3.5 Molecular dynamics (MD) simulation of Skp-OmpA complexes
The Skp homotrimer was modeled from the Skp crystal structure (PDB ID 1SG2) (Korndörfer et al., 2004). The missing residues were included based on 3-fold symmetry considerations. The tentacles of the Skp homotrimer were then splayed out to specific separations using biased molecular dynamics with NAMD (Phillips et al., 2005). A collective variable consisting of the distance between two groups defined as the α-carbon atoms of residues 35 to 80 in adjacent Skp monomers was defined. Then a harmonic potential with force constant 3.0 kcal mol−1 Å−2 was applied to the centers of the collective variable groups to bias the distance between adjacent tentacles to defined values. Simulations were done in vacuo using the CHARMM 22 force field parameters (MacKerell, et al., 1998). Stable distances were achieved in 10,000 steps of 1 fs. An ensemble of Skp homotrimer structures with separation distances of 10 Å to 119 Å at the tips of the helices and corresponding Rg values of 28.5 Å to 39.4 Å was generated.
Because the PP domain of OmpA folds as an independent unit (Danoff & Fleming, 2011) and is folded when it is in complex with Skp (Walton et al., 2009), all-atom model structures of OmpA were constructed with an unfolded, but collapsed TM domain and natively folded PP domain as follows: A homology model of the E. coli PP domain (residues 187 to 316) was generated using Swiss-Model (Schwede, Kopp, Guex, & Peitsch, 2003). An extended structure (θ = −78, φ = 149) containing the TM domain sequence of E. coli OmpA (residues 1 to 186) was built using PyMOL (The PyMOL Molecular Graphics System, Version 1.7.4 Schrödinger, LLC.). This extended structure was partially collapsed using a torsion angle Monte Carlo procedure developed at Johns Hopkins University (“REDUX,”), resulting in an ensemble of structures with Rg values of 34 Å to 36 Å. These partially collapsed TM domain structures were manually connected to the above homology model of the PP domain. The combined TM-PP domain models were solvated with TIP3 water, neutralized with 0.2 M NaCl and subjected to standard molecular dynamics equilibration using NAMD (Phillips et al., 2005) with the CHARMM 22 force field (MacKerell, et al., 1998). Successive rounds of equilibration with decreasing Rg potentials were carried out using the collective variables module in NAMD. Two of the resulting structures, one with a Rg of 42 Å and one with a Rg of 39 Å, were chosen for manual docking in PyMOL to the Skp models described above. Inspection of the docked structures suggested that the Skp model with Rg = 34 Å and tip separation of 46 Å fit the OmpA models best. Finally, two Skp-OmpA complex models with different orientations of the OmpA docked to Skp were solvated with TIP3 water, neutralized with 0.2 M NaCl and subjected to equilibration with standard MD using NAMD and the CHARMM 22 force field. The equilibrated complex model M1 contains Skp with Rg = 31.2 Å (S1) and OmpA with Rg ≈ 43 Å and complex model M2 contains Skp with Rg = 32.5 Å (S2) and OmpA with Rg ≈ 30 Å.
3.6 Modeling of the Skp-uOMP complexes
Even though SANS is a low-resolution structural method, high-resolution structures derived from X-ray crystallography and NMR (along with MD and geometrical models) can be positioned to fit the SANS data in order to produce quasi-atomic structural models. Although the crystal structure of Skp is available, the bound uOMP TM domains were found to be unfolded when bound to Skp (Burmann & Hiller, 2012; Walton et al., 2009). There is also no available data that links a specific region of Skp to a specific region of uOMP (Callon et al., 2014). There is moreover intrinsic interplay of different regions of the uOMP on binding Skp. For example, in the case of PhoE, its N-terminal region is important for Skp binding, but its influence is strongly modulated by the OMP’s C-terminal region (Harms et al., 2001). Therefore, OmpW and the TM portion of OmpA were modeled by a prolate ellipsoid of uniform scattering length density.
The ellipsoid is the simplest model, i.e., a single geometric shape, that can be used to describe the uOMP TM domains, and it is adequate for the fitting of the SANS data, especially in the Guinier region. However, it should be noted that other options such as bead models, rigid body models consisting of multiple geometric shapes and allatom models can be more useful under certain circumstances. Such models are generally less symmetric than single geometric shapes and may better represent the overall shape of the biological molecule, especially at the shorter length scales on the order of 10 Å. This is especially important for fitting SAXS data, which usually have better signal-to-noise than SANS data at q values beyond the Guinier range (Putnam et al., 2007; Rambo & Tainer, 2010). All-atom models provide the additional advantage of allowing modern MD methods to be employed to generate biologically relevant structures for comparison to SANS and SAXS data. For this reason, an all-atom model of Skp-OmpA was also tested against the SANS data, as is discussed later.
The prolate ellipsoid used for the TM domain of the uOMPs in both complexes was found by testing models of Skp and OmpW that best fit the Skp-OmpW contrast variation data. Three models were tested in which the axes were adjusted to create ellipsoids with Rg values of 21 Å, 24 Å and 27Å, (e21, e24 and e27, respectively) which match the range of possible Rg values found for bound OmpW, and volumes that essentially filled the Skp cavity, as suggested by both the I(q) and P(r) curves as a function of contrast. The ellipsoids were paired with Skp S1 and S2, from the M1 and M2 Skp-uOMP models described above and oriented such that the long axis was parallel to that of Skp. The CM distance between Skp and OmpW was varied for each model to correspond to a range calculated based on the Rg of Skp and the Rm value of the complex determined by the Stuhrmann and parallel axis theorem analyses. To reduce the Rg value of Skp to better match that obtained from the Skp-OmpW data, the S2 Skp structure was minimized for 1000 steps, subjected to a 10 ps MD simulation in vacuo, and then minimized again for 1000 steps using NAMD (Phillips et al., 2005), resulting in Skp model S3.
To determine how well each model represented the experimental SANS data, SANS curves were calculated from each of the model structures using the programs SIMUL and SCAT (Hansen, 1990) as well as Xtal2sas (Heidorn & Trewhella, 1988; S. Krueger et al., 1998). These curves were then compared to the Skp-OmpW SANS data to evaluate which Skp-OmpW model best fit the data. SIMUL was used to build the OmpW ellipsoid and to populate it randomly with points of uniform scattering contrast, Δρ, corresponding to that of the deuterated OmpW and the D2O composition of the buffer. Xtal2sas was used to read the atomic coordinates of the Skp structure (in PDB format) and to populate the structure randomly with points of scattering contrast that matched that of the amino acid residue in which the point was located. Care was taken to insure that the two volumes (Skp and OmpW) were filled with the same number density of points. SCAT was then used to calculate the scattering intensity of the complex, first by calculating P(r) as a function of r, using the contrast values associated with each scattering point, and then by performing a Fourier transform of P(r) to obtain I(q) as a function of q.
The calculated SANS curves were compared to the data at each contrast and goodness of fit was determined using the χ2 equation
| (14) |
where Iexp(q) is the experimentally determined SANS intensity curve, Icalc(q) is the calculated intensity curve from the model structure and σexp(q) is the q-dependent error of the Iexp(q) values. The sum was taken over N = 60 data points. The goodness of fit to the entire contrast variation data set was determined by the average χ2 value
| (15) |
where N is the number of contrast variation I(q) versus q scattering curves and is the χ2 value for the ith scattering curve.
Once reasonable models for the Skp-OmpW complex were found, the Skp-OmpA complex was modeled using an ellipsoid of the same dimension for the TM portion of OmpA as found for OmpW. Guided by the structure of a closely-related protein (PDB ID 1R1M) (Grizot & Buchanan, 2004), the PP domain of OmpA was built using Swiss-Model (Schwede et al., 2003) with ≈ 10 disordered residues of OmpA added at the N-terminus using the PSFGEN module of NAMD (Phillips et al., 2005) to act as a ‘tether’. Significantly, this and other OmpA-like structures (PDB ID 2K1S) (Ramelot et al.) and (PDB ID 2L26) (Li et al., 2012) have similar three-dimensional folds and theoretical Rg values.
Several models were tested in which the position of the TM domain of OmpA and the location at which the PP domain of OmpA was ‘tethered’ approximately satisfied the Rg and CM distance parameters obtained from the Stuhrmann and parallel axis theorem analyses. The Complex Monte Carlo module in SASSIE (Curtis et al., 2012) was used to allow the disordered region of the PP domain of OmpA to vary to generate ensembles of structures from the starting Skp-OmpA structures for comparison to SANS data. Accepted (non-overlapping) configurations were generated by sampling backbone dihedral angles using CHARMM-22 all-atom protein force field parameters (MacKerell, et al., 1998). The new configuration was checked for overlap of basis atoms, which were chosen as α-carbon atoms in this case. If the overlap distance between basis atoms was ≥ 3 Å, the new structure was accepted. Every 20th accepted structure was selected for further analysis in order to eliminate correlated dihedral angle moves.
A Skp-OmpA model with an all-atom representation of the TM domain of OmpA was also tested against the SANS data. Torsion-angle MD (J. Chen, Im, & Brooks, 2005) was performed on the TM domain of OmpA (residues 1 to 171) from the M2 SkpuOMP model described above in order to increase the Rg to match the value obtained for OmpW from the Skp-OmpW contrast variation data. This region was oriented such that the long axis was parallel to that of S3 Skp, with the C-terminal region near the top of the Skp trimer. The PP domain of OmpA, as well as the disordered residues between the TM and PP domains and at the C-terminus, were then added using the PSFGEN module in NAMD (Phillips et al., 2005) to form the complete OmpA molecule (residues 1 to 326). The structure of the entire S3-OmpA complex was minimized using 1000 steps, subjected to a 10 ps MD simulation in vacuo to insure its stability, and then minimized again using 1000 steps, using NAMD (Phillips et al., 2005). The Complex Monte Carlo module in SASSIE (Curtis et al., 2012) was used to explore possible conformations of the PP domain of OmpA as described above.
SANS curves were calculated for the ensembles of Skp-OmpA model structures as a function of contrast as described above for the Skp-OmpW models. In this case, Xtal2sas was also used to populate the PP domain of the OmpA structure (or both the PP and TM domains of OmpA in the all-atom model) with points of scattering contrast that matched that of the amino acid residue in which the point was located. Care was taken to insure that the volumes (Skp, TM-OmpA and PP-OmpA) were filled with the same number density of points. Goodness of fit to the SANS data was determined using the same χ2 relations as above.
Examination of a plot of χ2 versus Rg at each individual contrast, or χ2(avg) versus Rg(avg) for the entire contrast variation data set, provides an idea of how well the individual structures generated from each starting structure fit the data as well as which starting structure produces the overall best fit to the data. The best-fit (lowest χ2(avg)) and worst fit (highest χ2(avg)) model SANS curves were noted for each case, along with the average model SANS curve from the entire ensemble of accepted structures. These curves were plotted along with the experimental SANS data to aid in the visualization of the quality of the fits to the data. Surface density plots representing the total configuration space examined by all of the accepted structures were generated and compared to that representing the best-fit family of structures in each case. The best-fit family of structures was chosen based on those giving the lowest ≈ 10 % of the χ2(avg) values for each series. This cutoff was chosen arbitrarily based on the shape of the χ2(avg) versus Rg(avg) curves and used to analyze the results further.
4. RESULTS
4.1 SANS data
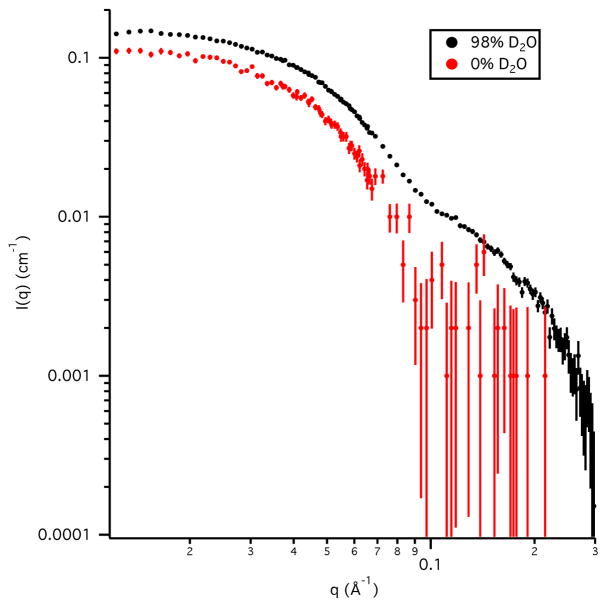
The SANS data for Skp alone in 0 % D2O and 98 % D2O buffers are shown in Figure 2. Guinier analysis of the data resulted in Rg values of 34 Å ± 2 Å in 0 % D2O buffer and 32.9 Å ± 0.3 Å in 98 % D2O buffer. The Guinier-derived I(0) values of 0.125 cm−1 ± 0.005 cm in 0 % D2O buffer and 0.160 cm−1 ± 0.002 cm−1 in 98 % D2O buffer agree well with the calculated values of 0.14 cm−1 and 0.15 cm−1, respectively, using Eqs. 4 and 5 along with the Mw calculated from the Skp sequence. This verifies that Skp is a trimer in solution, in agreement with the crystal structures (Korndörfer et al., 2004; Walton & Sousa, 2004).
Figure 2.
SANS data on an absolute scale for Skp in D2O and H2O buffers. Error bars represent the standard error of the mean with respect to the number of pixels used in the data averaging.
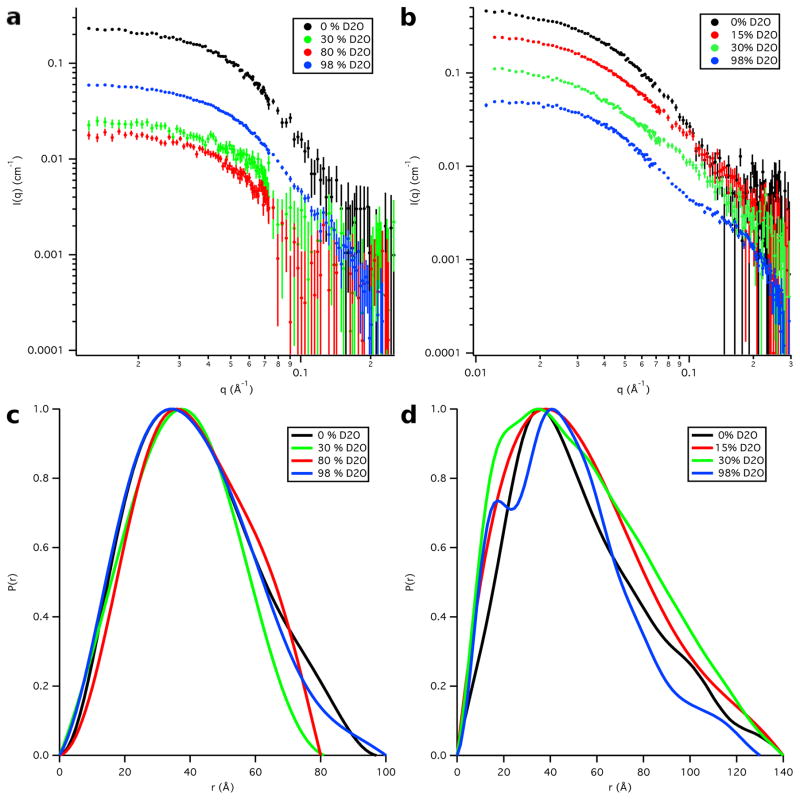
Four SANS datasets were collected on both the Skp-OmpW and Skp-OmpA complexes. The Skp-OmpW data were collected in buffers with 0 %, 30 %, 80 % and 98 % D2O while the Skp-OmpA data were collected in buffers with 0 %, 15 %, 30 % and 98 % D2O, as shown in Figure 3, along with their corresponding distance distribution functions, P(r) versus r. The Rg and I(0) values obtained from both Guinier and P(r) analyses are listed in Tables 1 and 2 for Skp-OmpW and Skp-OmpA, respectively.
Figure 3.
SANS data on an absolute scale for a) Skp-OmpW and b) Skp-OmpA. Error bars represent the standard error of the mean with respect to the number of pixels used in the data averaging. Distance distribution functions for c) Skp-OmpW and d) Skp-OmpA. The peak values are scaled to 1.0 so that the differences in shape can be easily observed.
Table 1.
Skp-OmpW Parameters
| 0 % D2O | 30 % D2O | 80 % D2O | 98 % D2O | |
|---|---|---|---|---|
| Concentration* (mg mL−1) | 3.45 | 3.8 | 1.14 | 1.25 |
| Guinier Rg (Å) | 32.7 ± 0.2 | 31 ± 1 | 31.5 ± 0.4 | 31.6 ± 0.2 |
| Guinier I(0) (cm−1) | 0.223 ± 0.001 | 0.027 ± 0.001 | 0.020 ± 0.001 | 0.063 ± 0.001 |
| Rg from P(r) (Å) | 32.9 ± 0.1 | 29.0 ± 0.2 | 31.32 ± 0.03 | 31.3 ± 0.2 |
| I(0) from P(r) (cm−1) | 0.240 ± 0.001 | 0.025 ± 0.001 | 0.020 ± 0.001 | 0.063 ± 0.001 |
| Dmax (Å) | 105 ± 5 | 83.5 ± 1.5 | 89 ± 4 | 93.5 ± 1.5 |
Errors on Rg, I(0) and Dmax represent the standard error of the mean for 3 different Guinier or P(r) fits.
Errors on the concentration values are about 5 %.
Table 2.
Skp-OmpA Parameters
| 0 % D2O | 15 % D2O | 30 % D2O | 98 % D2O | |
|---|---|---|---|---|
| Concentration* (mg mL−1) | 5.6 | 5.4 | 5.3 | 1.31 |
| Guinier Rg (Å) | 39.7 ± 0.1 | 39.8 ± 0.3 | 39.1 ± 0.3 | 36.3 ± 0.7 |
| Guinier I(0) (cm−1) | 0.462 ± 0.002 | 0.261 ± 0.004 | 0.119 ± 0.001 | 0.056 ± 0.001 |
| Rg from P(r) (Å) | 41.1 ± 0.4 | 42.0 ± 0.8 | 41.8 ± 0.3 | 38.1 ± 0.1 |
| I(0) from P(r) (cm−1) | 0.475 ± 0.003 | 0.263 ± 0.002 | 0.120 ± 0.001 | 0.056 ± 0.001 |
| Dmax (Å) | 135 ± 5 | 137 ± 7 | 133 ± 3 | 127 ± 3 |
Errors on Rg, I(0) and Dmax represent the standard error of the mean for 3 different Guinier or P(r) fits.
Errors on the concentration values are about 5 %.
4.2 Match Point analysis and quantification of Omp deuteration
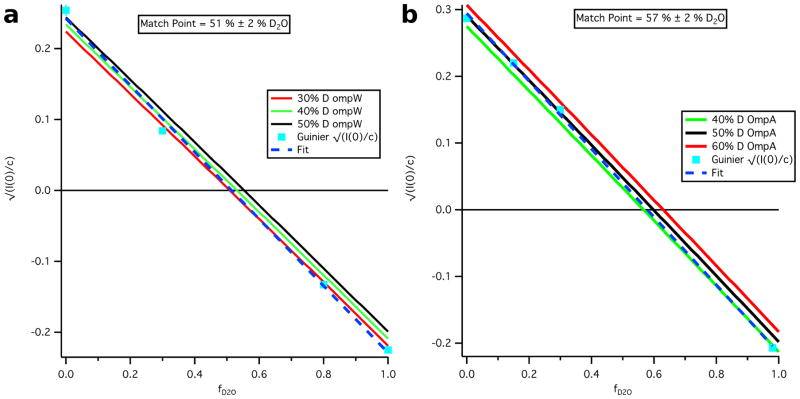
versus fD2O plots using the Guinier-derived values in Tables 1 and 2 are shown for the Skp-OmpW and Skp-OmpA complexes in Figure 4, along with the calculated curves assuming different percentages of deuteration for the uOMP component (30 %, 40 % and 50 % deuteration for OmpW and 40 %, 50 % and 60 % deuteration for OmpA). The match point for the Skp-OmpW complex was found to be 51 % D2O ± 2 % D2O, while that for the Skp-OmpA complex was found to be 57 % D2O ± 2 % D2O.
Figure 4.
Experimental and calculated vs fD2O for a) Skp-OmpW and b) Skp-OmpA. Error bars on the experimental values represent the standard error of the mean based on three different Guinier fits.
It can be seen from Figure 4a that the values for Skp-OmpW as a function of fD2O fall closer to the curve for 30 % deuteration of OmpW. This value seems low given that OmpW was grown in a medium with a starting value of 60 % D2O. The data point for 0 % D2O buffer does match that for 50 % deuterated OmpW. On the other hand, the values for Skp-OmpA as a function of fD2O fall mainly on the curve for 50 % deuterated OmpA, which seems more reasonable given the starting value of 60 % D2O in the growth medium. The data point for 98 % D2O agrees better with the 40 % deuterated OmpA curve. It is possible that the concentration estimated by extinction coefficients is higher than the actual concentration of the complex during the SANS measurement, resulting in a value that is low for this data point. Given the results shown in Figure 4b, the amount of deuteration for OmpA was estimated at 50 % ± 5 %. There is no compelling reason why the amount of deuteration should be different in OmpW and OmpA, as they were prepared under the same conditions. Because using either 30 % or 50 % for the amount of deuteration for OmpW did not change the subsequent Stuhrmann and parallel axis theorem analyses results significantly, 50 % ± 5 % deuteration was also estimated for OmpW. Given this value for both OmpW and OmpA, the match points of the Skp-OmpW and Skp-OmpA complexes were calculated to be 55 % D2O ± 2 % D2O and 60 % D2O ± 2 % D2O, respectively. Additionally, the match points of the components were determined to be 44 % D2O for Skp and 80 % D2O ± 7 % D2O for OmpW and OmpA.
The results in Figures 4a and 4b indicate that the Skp-uOMP complexes were present in all samples analyzed and were formed by three Skp monomers bound to a single uOMP. This stoichiometric ratio is consistent with previous binding data (Moon et al., 2013; Qu et al., 2007). It is important to emphasize that no urea was present, and without Skp, the uOMPs would have precipitated over the course of the SANS data collection.
4.3 Stuhrmann and parallel axis theorem analyses
Both Sturhmann and parallel axis theorem analyses were performed on the contrast variation SANS data and the results are listed in Tables 3 and 4, respectively. 50 % deuteration was assumed for both OmpW and OmpA, with the Δρ values calculated accordingly for each contrast.
Table 3.
Stuhrmann Analysis for Skp-uOMP Complexes
| Skp-OmpW | Skp-OmpA | |
|---|---|---|
| α | 64 ± 55 | 242 ± 34 |
| β | 41 ± 162 | 461 ± 66 |
| Rm (Å) | 32.3 ± 0.5 | 39.3 ± 0.2 |
| χ2 | 4.75 | 0.4 |
| Rg (Skp) (Å) | 31.5 ± 0.5 | 33.5 ± 0.8 |
| Rg (Omp) (Å) | 32 ± 6 | 36.1 ± 0.8 |
| DCM (Å) | 13 ± 26 | 38 ± 3 |
50 % deuteration was assumed for OmpW and OmpA. χ2 is from the fit to Eq. 10.
Table 4.
Parallel Axis Theorem Analysis for Skp-uOMP Complexes
| Skp-OmpW | Skp-OmpA | |
|---|---|---|
| Rg (Skp) (Å) | 31.3 ± 0.6 | 32.7 ± 0.9 |
| Rg (Omp) (Å) | 32 ± 6 | 35.7 ± 0.9 |
| DCM (Å) | 14 ± 28 | 40 ± 3 |
50 % deuteration was assumed for OmpW and OmpA
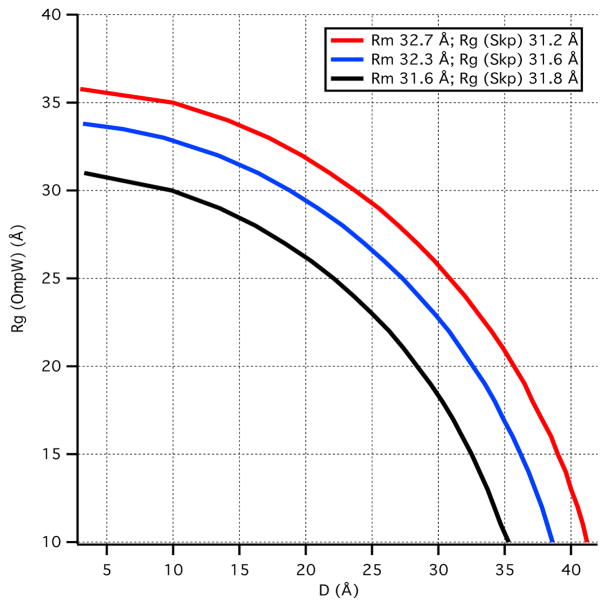
Rg changes very little as a function of contrast for the Skp-OmpW complex. Therefore, Rg2 versus Δρ−1 is nearly flat and the fit to Eq. 10 results in large uncertainties for both α and β. A similar argument can be made for fits to Eq. 11. As a result, these analyses only allow determination of Rg for the Skp component of the complex, while Rg for the OmpW component and the CM distance, DCM, have large uncertainties. Importantly, Rm, the radius of gyration of an equivalent complex of uniform scattering length density, is also well determined from the Stuhrmann analysis (Eq. 10). Thus, three possible Rg (OmpW) versus DCM curves were calculated from Eq. 10 using the well-determined values obtained for Rg (Skp) and Rm (along with the values obtained by adding and subtracting their corresponding errors) and the results are shown in Figure 5. This information was used to constrain the size of OmpW and the CM distance between Skp and OmpW in the Skp-OmpW model structures as described below.
Figure 5.
Calculation of possible values for Rg(OmpW) and CM distance, DCM, based on Rm and Rg(Skp) obtained from the Stuhrmann analysis.
Conversely, the change in Rg as a function of contrast is more pronounced for the Skp-OmpA complex. Thus, Rg for both Skp and OmpA, as well as DCM, were well determined in this case and these values were used directly to build the starting model structures for the Skp-OmpA complex.
4.4 Skp structure in solution
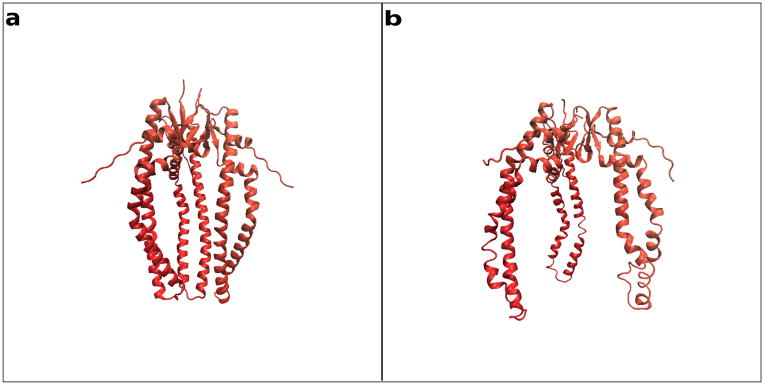
Figure 6a shows the starting model for Skp based on the x-ray crystal structure as described in Materials and Methods. The calculated Rg based on the atomic coordinates is 30.6 Å. This is about 3 Å smaller than the Guinier-derived Rg. The model structure obtained after the Rg-constrained MD simulation, shown in Figure 6b, has a calculated Rg of 33.5 Å, in good agreement with the Guinier-derived Rg value. Importantly, the Skp β–strand ‘body’ through which oligomerization occurs did not alter in conformation between the two models. This region merely served as a ‘hinge’ point for the opening of the Skp helical tentacles. This structural pivot was also identified from NMR data collected from the OmpX-Skp complex (Burmann et al., 2013).
Figure 6.
All-atom model structures representing Skp a) in the crystal (Rg ≈30 Å) and b) in solution (Rg ≈ 33 Å).
4.5 Skp-OmpW structure in solution
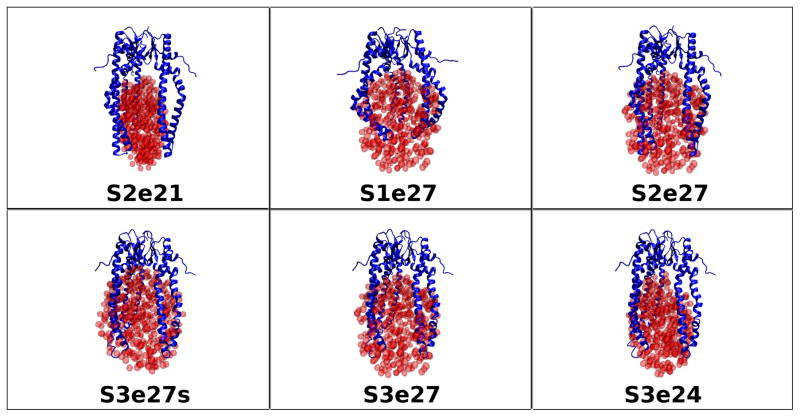
The fact that Rg does not change appreciably with contrast for the Skp-OmpW complex means that the Rg values of the two components are close to each other. Thus, a number of possible values for Rg (OmpW) and CM distance, DCM, in Figure 5 can be ruled out, given the Rg (Skp) and Rm values from the Stuhrmann analysis in Table 3. Several model structures were tested with Skp structures S1, S2 and S3, with Rg values of 31.2 Å, 32.5 Å and 31.6 Å, respectively, OmpW represented by e21, e24 and e27 ellipsoids with Rg values of 21 Å, 24 Å and 27 Å, respectively, and DCM in the range of 25 Å to 30 Å. Representative model structures tested are pictured in Figure 7 and are listed in Table 5, along with the Rg values of the individual components and the CM distance between them.
Figure 7.
Skp-OmpW model structures tested against the SANS data as described in Materials and Methods. The ball representation of the ellipsoids is for clarity. The ellipsoids were represented by non-overlapping points for SANS curve calculations, as described in Materials and Methods.
Table 5.
Skp-OmpW Model Structures
| Model | Rg (Skp) (Å) | Rg (OmpW) (Å) | Rg (complex) (Å) | DCM (Å) |
|---|---|---|---|---|
| S2e21 | 32.5 | 21.2 | 32.7 | 30.5 |
| S1e27 | 31.2 | 27.6 | 32.1 | 28.6 |
| S2e27 | 32.5 | 27.6 | 32.1 | 28.6 |
| S3e27s | 31.6 | 27.6 | 31.9 | 25.0 |
| S3e27 | 31.6 | 27.6 | 32.1 | 29.2 |
| S3e24 | 31.6 | 23.9 | 32.0 | 30.9 |
Values are from the coordinates only. Contrast was not taken into account.
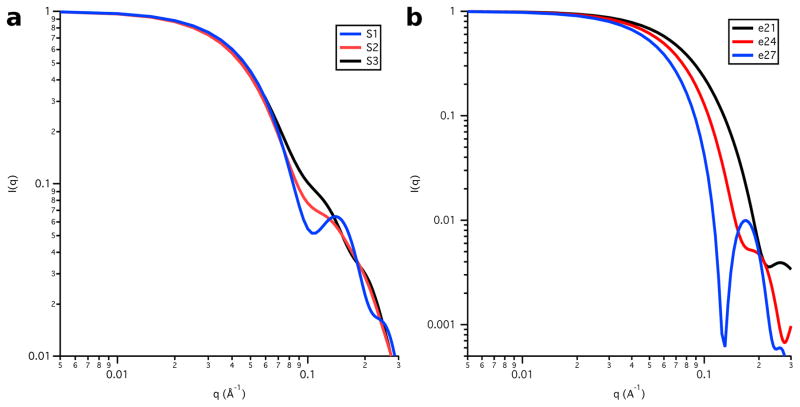
Table 1 shows that Rg is largest for the Skp-OmpW complex in 0 % D2O buffer and it is about 1 Å smaller in 98 % D2O. A comparison of these results with those in Table 30 6, which lists Rg as a function of contrast for the model structures, shows that only model S1e27 satisfies this requirement. However, Rg in 80 % D2O is slightly low in this model. This means that the Rg value for Skp is slightly too small, because Skp dominates the scattering at this contrast. Furthermore, the S1 Skp structure is too symmetric, as can be see in Figure 8a, which shows the model SANS curves for S1, S2 and S3 Skp. The curve for S1 Skp (shown in the S1e27 complex in Figure 7) shows a pronounced peak at q ≈ 0.15 Å−1 that is not observed in the data, which is due to the 3-fold symmetry of the three tentacles. Even the S2 Skp model (shown in the S2e21 and S2e27 complexes in Figure 7) results in a SANS curve that shows some structure at this q value, which was reduced substantially by performing a 10 ps MD simulation in vacuo, as described in Materials and Methods, to create the less symmetric S3 Skp (shown in the remaining complexes in Figure 7). In addition, the model SANS curve for an ellipsoid with Rg = 27 Å features a strong peak at q ≈ 0.18 Å−1, since ellipsoids are highly symmetric structures. The peak is less pronounced for ellipsoids of smaller Rg, as shown in Figure 8b.
Figure 8.
Model SANS curves from a) the Skp component represented by the S1, S2 and S3 all-atom structures and b) the OmpW component represented by the e21, e24 and e27 ellipsoids. I(0) is arbitrarily scaled to 1.0.
Given these results, model structures with S1 Skp and e27 ellipsoids do not represent the data well. Model S2e21, consisting of S2 Skp and the smaller e21 ellipsoid with Rg = 21 Å, also is not a good representation of the data; the Rg is larger in 98 % D2O than in 0 % D2O and Rg in 30 % D2O is too small, indicating that the e21 ellipsoid is too small, because OmpW dominates the scattering at this contrast.
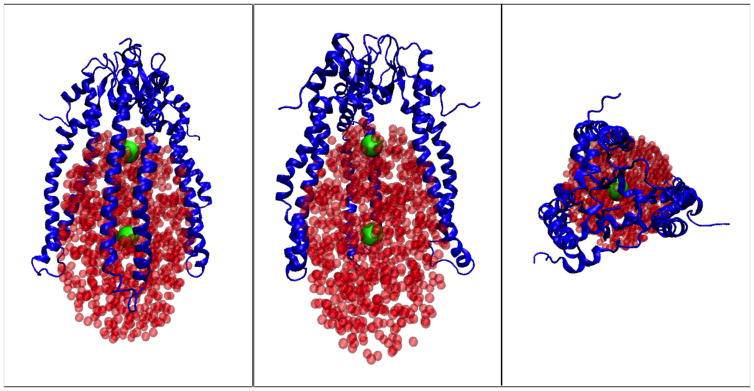
On the other hand, a reasonable working model of the structure of Skp-OmpW in solution was obtained using S3 Skp and the e24 ellipsoid with Rg = 24 Å, with the two components positioned such that DCM ≈ 30 Å to satisfy the blue curve in Figure 5 in which Rg(skp) = 31.6 Å and Rm = 32.3 Å. While Rg in 98 % D2O is not smaller than that in 0 % D2O, the two values are equal and the discrepancy may be due to the CM distance, DCM, being slightly too large. Several views of S3e24 are shown in Figure 9, which also shows the location of the CM for both the Skp and OmpW components.
Figure 9.
Several views of Skp-OmpW model S3e24, which was the best-fit model for this complex. The green balls are at the CM locations of S3 Skp and the e24 ellipsoid. The ball representation of the ellipsoids is for clarity. The ellipsoids were represented by non-overlapping points for SANS curve calculations, as described in Materials and Methods.
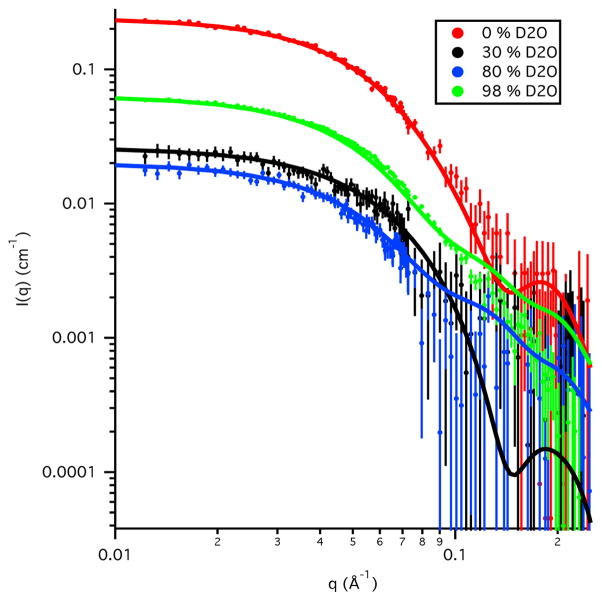
Model SANS curves from S3e24 are shown along with the data in Figure 10. They agree well with the data for all contrasts below q = 0.1 Å−1, beyond which the data for 30 % D2O and 80 % D2O become too noisy for comparison. The model SANS curves for 0 % D2O and 30 % D2O show a peak at q ≈ 0.18 Å−1 that is not seen in the data due to the symmetry of the ellipsoid model for OmpW.
Figure 10.
Skp-OmpW SANS data on an absolute scale (points) along with model SANS curves (solid lines) from S3e24. Error bars represent the standard error of the mean with respect to the number of pixels used in the data averaging.
4.6 Skp-OmpA structure in solution
Starting model structures for Skp-OmpA were constructed based on the working model for Skp-OmpW above, incorporating the e24 ellipsoid to represent the TM domain of OmpA. The ellipsoid was positioned in the same location as for the Skp-OmpW model and also higher in the Skp cavity for comparison. The PP domain of OmpA was tethered near the center of the Skp cavity in slightly different positions as described in Materials and Methods such that the starting values of Rg (OmpA), including both the TM and PP domains, and DCM approximately agreed with the values obtained in Tables 3 and 4. The starting values of these parameters did not need to be exact because the PP domain would be repositioned during the SASSIE runs to find the best-fit structures to the data.
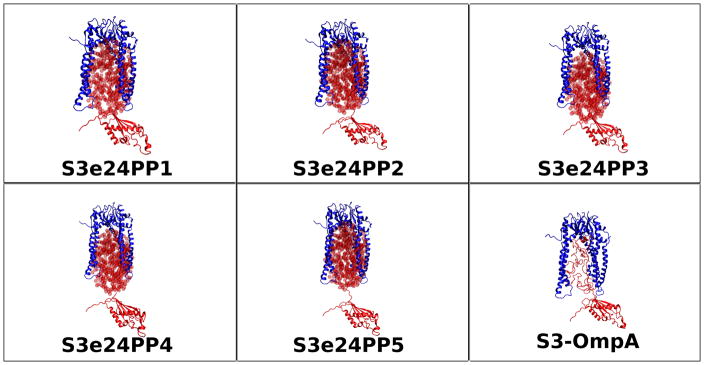
Representative starting models for Skp-OmpA are shown in Figure 11, including an all-atom model, in which the residues at the N-terminus of the PP domain are located high in the Skp cavity. The starting Rg values are shown as a function of contrast in Table 7. Model S3e24PP1 was not pursued further because the Rg values at all contrasts are too small and the disordered residues that tether the PP domain are shorter than in the other models. Thus, structures with larger Rg values were unlikely to be generated during the SASSIE runs. Short SASSIE runs producing a few hundred structures were performed on the rest of the starting model structures. Models S3e24PP2 and S3e24PP3 were found to be subsets of S3e24PP4 and S3e24PP5, respectively. Thus, longer SASSIE runs were only performed on models S3e24PP4 and S3e24PP5.
Figure 11.
Skp-OmpA starting structure models for SASSIE runs as described in Materials and Methods. The ball representation of the ellipsoids is for clarity. The ellipsoids were represented by non-overlapping points for SANS curve calculations, as described in Materials and Methods.
Table 7.
Skp-OmpA Starting Model Structure Rg as a Function of Contrast
| Model | 0 % D2O Rg (Å) | 30 % D2O Rg (Å) | 98 % D2O Rg (Å) |
|---|---|---|---|
| S3e24PP1 | 37.4 | 35.7 | 35.9 |
| S3e24PP2 | 40.3 | 38.9 | 37.2 |
| S3e24PP3 | 40.1 | 37.6 | 37.7 |
| S3e24PP4 | 42.1 | 40.3 | 38.3 |
| S3e24PP5 | 42.3 | 41.4 | 37.9 |
| S3-OmpA | 39.1 | 37.5 | 36.3 |
| Guinier | 39.7 ± 0.1 | 39.1 ± 0.3 | 36.3 ± 0.7 |
| P(r) | 41.1 ± 0.4 | 41.8 ± 0.3 | 38.1 ± 0.1 |
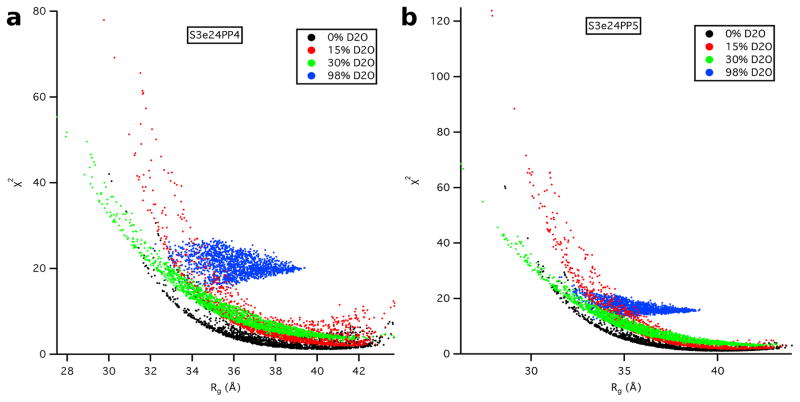
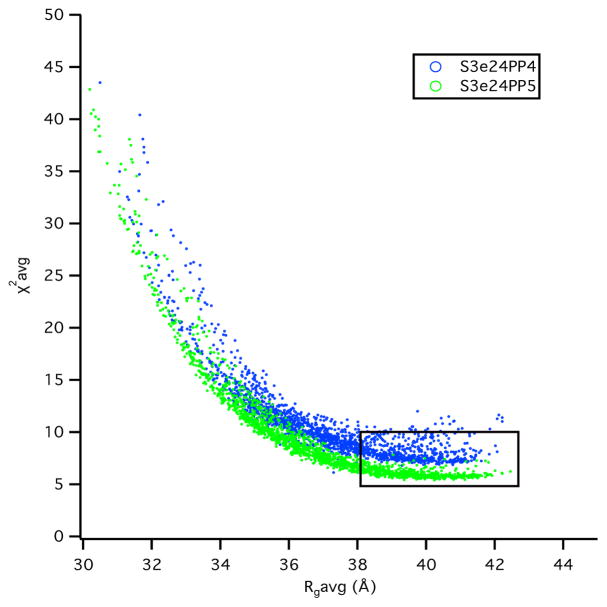
SASSIE runs performed on models S3e24PP4, S3e24PP5 and the all-atom model, S3-OmpA, produced 1650 accepted structures for S3e24PP4 and S3e24PP5 and 2144 accepted structures for S3-OmpA. χ2 versus Rg plots are shown as a function of contrast for models S3e24PP4 and S3e24PP5 in Figure 12. The larger χ2 values observed for the model SANS curves in 98 % D2O indicate that the S3 model for Skp does not describe the data as well for Skp-OmpA as it does for Skp-OmpW. Although the match point of the uOMPs is around 80 % D2O, the scattering from this component is still relatively weak in 98 % D2O compared to that of the Skp component. Thus, the differences in the 98 % D2O data can be ascribed mainly to the structure of Skp. The 98 % D2O data for Skp-OmpA (Figure 3b) shows a distinct peak at q ≈ 0.18 Å−1, whereas the data at the same contrast for Skp-OmpW (Figure 3a) lacks this peak. Thus, the structure of Skp bound to OmpA is more symmetric with respect to the location and shape of the three tentacles. This leads to the conclusion that a model more like S1 Skp, but with a larger Rg value more like S3 Skp, would result in a better fit of the Skp-OmpA models to the 98% D2O data.
Figure 12.
χ2 versus Rg plots as a function of contrast from SASSIE runs exploring the conformation space of the OmpA PP domain for models a) S3e24PP4 and b) S3e24PP5.
The χ2(avg) versus Rg(avg) plots for both the S3e24PP4 and S3e24PP5 model structures are shown in Figure 13. Better χ2(avg) values are obtained for Rg(avg) > 34 Å for model S3e24PP5, although there are not as many structures with Rg(avg) > 38 Å, represented by the rectangular region, which denotes the lowest ≈ 10 % of χ2(avg) values. The χ2(avg) values in this best-fit region are lower for S3e24PP5, suggesting that the TM domain of OmpA sits higher in the Skp cavity in the Skp-OmpA model than OmpW in the Skp-OmpW model.
Figure 13.
χ2(avg) versus Rg(avg) plots from the plots in Figure 12 for models S3e24PP4 and S3e24PP5
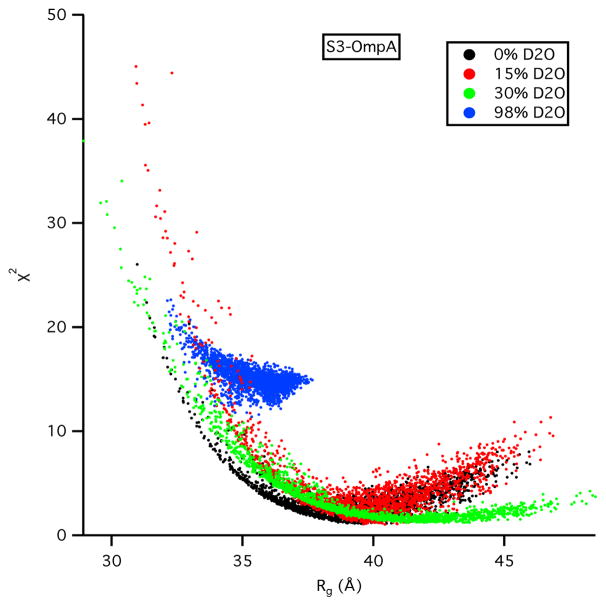
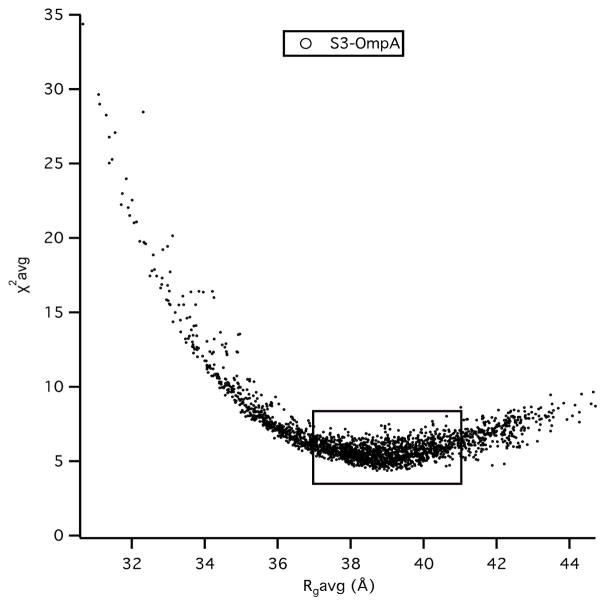
χ2 versus Rg plots are shown as a function of contrast for the all-atom Skp-OmpA model structure in Figure 14. A comparison to Figure 12 reveals the same high χ2 values in 98 % D2O, as expected because the S3 model for Skp was used in both cases. On the other hand, the χ2 values overall are smaller at all contrasts compared to the S3e24PP5 model. The same is true for the χ2(avg) versus Rg(avg) plot for Skp-OmpA in Figure 15, which shows lower χ2(avg) values overall in the best-fit region where Rg(avg) is between 37 Å and 41 Å. While this model shows only one of many possible configurations for the TM domain of OmpA, it does provide an example of an alternate tethering strategy, and thus a different region of conformation space, for the PP domain of OmpA than is represented by S3e24PP4 or S3e24PP5.
Figure 14.
χ2 versus Rg plots as a function of contrast from SASSIE runs exploring the conformation space of the OmpA PP domain for model S3-OmpA.
Figure 15.
χ2(avg) versus Rg(avg) plots from Figure 13 for S3-OmpA.
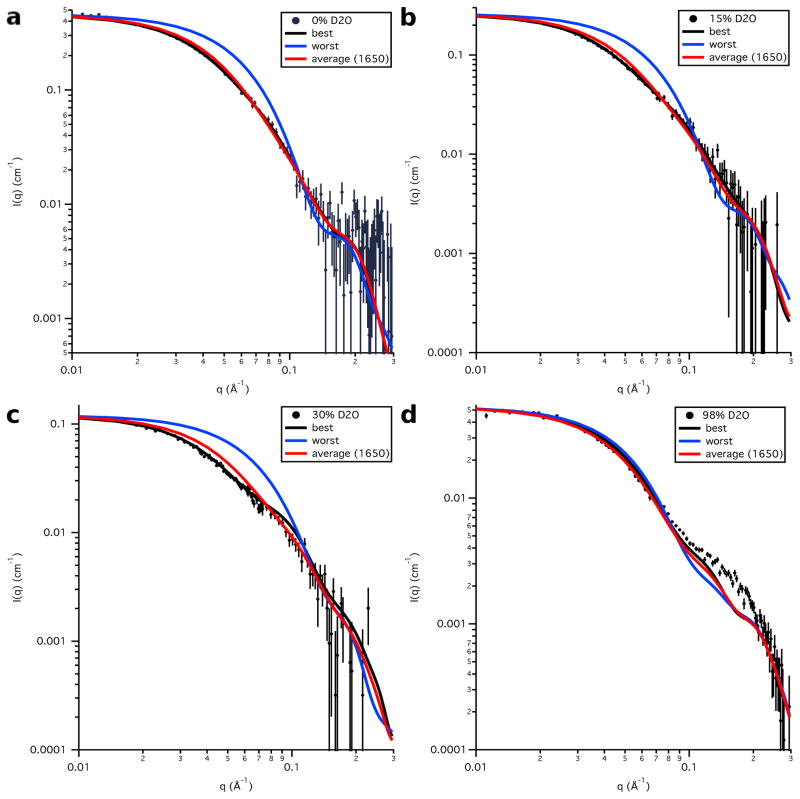
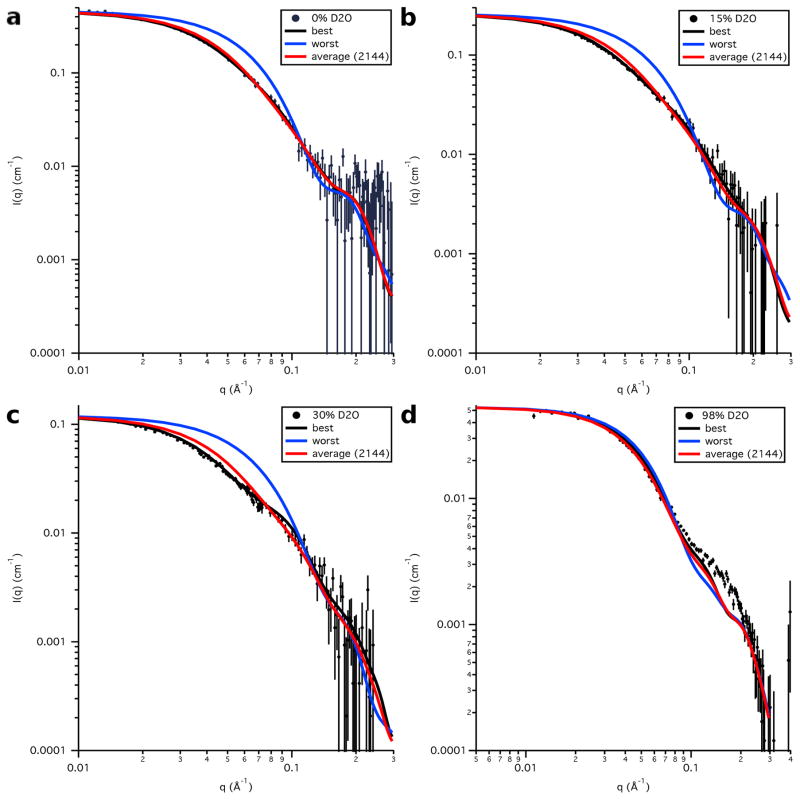
Plots of the data at each contrast compared to the calculated S3e24PP5 SANS curves for the best-fit and worst-fit structures, as well as the average SANS curve for the entire ensemble, are shown in Figure 16. As explained earlier, the discrepancy between the calculated SANS curves and the SANS data in 98 % D2O is due to the use of the S3 model for Skp for both Skp-OmpW and Skp-OmpA. The portion of the Skp-OmpA data near q ≈ 0.18 Å−1 is not well matched since the peak observed in this region does not exist in the Skp-OmpW data. Additional MD simulations were not performed on Skp to try to find Skp-OmpA models that better fit the 98 % D2O data, since this would have only resulted in a shift in χ2(avg) by a constant value in Figures 13 and 15.
Figure 16.
Model SANS data calculated from the best-fit and worst-fit single S3e24PP5 structures, as well as the average SANS curve calculated from the entire S3e24PP5 ensemble, along with the SANS data on an absolute scale for Skp-OmpA in a) 0 % D2O, b) 15 % D2O, c) 30 % D2O and d) 98 % D2O. Error bars represent the standard error of the mean with respect to the number of pixels used in the data averaging.
Figure 16 shows that the average SANS curve for the entire ensemble of S3e24PP5 structures fits the data almost as well as that for the best-fit single structure in each case, indicating that the entire generated ensemble of structures is also a reasonable fit to the SANS data. Similar plots are shown for the calculated S3-OmpA SANS curves compared to the data at each contrast in Figure 17. Again, the average curve for the entire ensemble fits the data almost as well as that for the best-fit single structure in each case.
Figure 17.
Model SANS data calculated from the best-fit and worst-fit single S3-OmpA structures, as well as the average SANS curve calculated from the entire S3-OmpA ensemble, along with the SANS data on an absolute scale for Skp-OmpA in a) 0 % D2O, b) 15 % D2O, c) 30 % D2O and d) 98 % D2O. Error bars represent the standard error of the mean with respect to the number of pixels used in the data averaging.
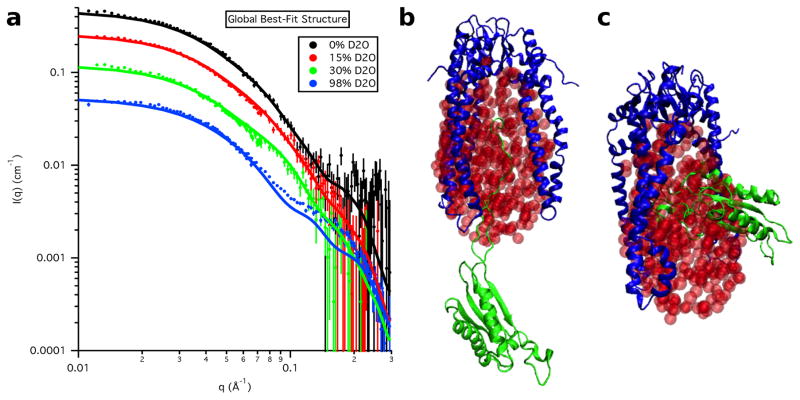
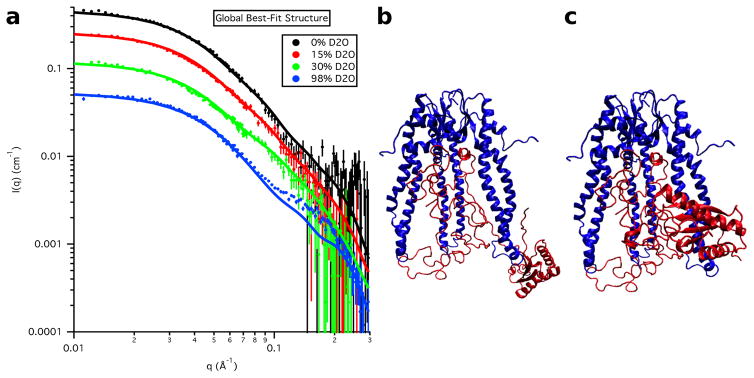
The calculated SANS curves from the global best-fit individual structure are shown in Figure 18 at each contrast for S3e24PP5 and in Figure 19 for S3-OmpA, along with the corresponding global best and worst-fit structures for comparison. The resultant Rg values as a function of contrast for the global best-fit individual structures are listed in Table 8 and the Rg values for the Skp and OmpA components, as well as the CM distance, DCM, for the global best-fit individual structures are listed in Table 9. In agreement with the χ2(avg) versus Rg(avg) curves, the parameters obtained from S3e24PP5 are in better agreement with the data than those obtained from S3e24PP4, although the DCM value is still a little large compared to those obtained from the data. The parameters obtained from S3-OmpA are in very good agreement with those obtained from the data.
Figure 18.
a) Skp-OmpA SANS data on an absolute scale along with model SANS curves from the single best-fit S3e24PP5 structure. Error bars represent the standard error of the mean with respect to the number of pixels used in the data averaging. The b) best-fit and c) worst-fit model structures are also shown for comparison. The ball representation of the ellipsoids is for clarity. The ellipsoids were represented by non-overlapping points for SANS curve calculations, as described in Materials and Methods.
Figure 19.
a) Skp-OmpA SANS data on an absolute scale, along with model SANS curves from the single best-fit S3-OmpA structure. Error bars represent the standard error of the mean with respect to the number of pixels used in the data averaging. The b) best-fit and c) worst-fit model structures are also shown for comparison.
Table 8.
Skp-OmpA Global Best-fit Structure Rg as a Function of Contrast
| SASSIE Run* | Structure number** | 0 % D2O Rg (Å) | 15 % D2O Rg (Å) | 30 % D2O Rg (Å) | 98 % D2O Rg (Å) |
|---|---|---|---|---|---|
| S3e24PP4 (39.9) | 442 (1650) | 41.4 | 40.8 | 39.2 | 38.3 |
| S3e24PP5 (40.8) | 740 (1650) | 42.2 | 41.8 | 41.1 | 38.2 |
| S3-OmpA (38.7) | 1188 (2144) | 39.9 | 39.7 | 38.9 | 36.4 |
| Guinier | 39.7 ± 0.1 | 39.8 ± 0.3 | 39.1 ± 0.3 | 36.3 ± 0.7 | |
| P(r) | 41.1 ± 0.4 | 42.0 ± 0.8 | 41.8 ± 0.3 | 38.1 ± 0.1 |
Average Rg (A) for the global best-fit structure is in parenthesis.
Total number of structures is in parenthesis.
Table 9.
Component Rg values for Skp-OmpA Global Best-fit Structure
| SASSIE Run | Structure number | Rg (Skp) (Å) | Rg (OmpA) (Å) | DCM (Å) |
|---|---|---|---|---|
| S3e24PP4 | 442 | 32.0 | 33.8 | 51.3 |
| S3e24PP5 | 740 | 32.0 | 37.8 | 46.6 |
| S3-OmpA | 1188 | 31.7 | 36.6 | 40.5 |
| Stuhrmann | 33.5 ± 0.8 | 36.1 ± 0.8 | 38 ± 3 | |
| Parallel Axis | 32.7 ± 0.9 | 35.7 ± 0.8 | 40 ± 3 |
Values are from the coordinates only. Contrast was not taken into account.
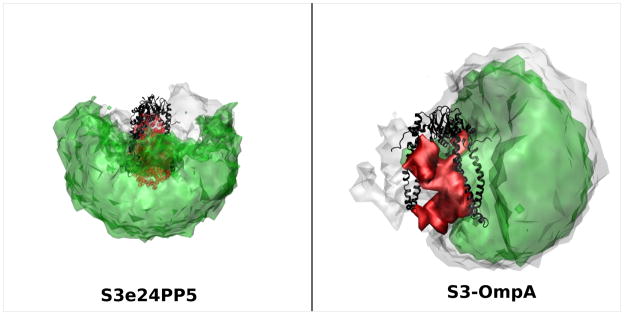
Surface density plots for S3e24PP5 and S3-OmpA showing the configuration space covered by the PP domain for the ensemble (grey) and the best-fit ensemble (green) are presented in Figure 20. Skp is shown in black and the TM domain of OmpA is in red. These plots show that the PP domain can assume multiple positions and still produce structures that fit the data well. The PP domain in S3e24PP5 was tethered such that it could occupy all positions shown in grey and those structures that fall in the rectangle in the χ2(avg) versus Rg(avg) plot (Figure 13) can take the positions shown in green. The grey areas that do not overlap with the green areas represent the conformations that do not fall in the rectangle. The PP domain was tethered higher within the Skp cavity in S3-OmpA, so a different part of conformation space was explored using SASSIE. But, the result is similar to that of S3e24PP5 in that there is only a small region of conformation space (the grey that is not overlapping with the green) that represents the conformations that don’t fall in the rectangle in the χ2(avg) versus Rg(avg) plot (Figure 15). Both surface density plots reveal that there is a portion of conformation space around Skp that is not sampled by the PP domain of OmpA.
Figure 20.
Structure density plots representing all of conformation space (grey) and the best-fit conformation space within the rectangles in Figures 13 and 15 (green) explored by the OmpA PP domain using the S3e24PP5 and S3-OmpA models. The OmpA TM domain is shown in red and Skp in shown in black.
5. DISCUSSION
5.1 Skp alone in solution
The SANS data for Skp alone in solution are consistent with a structure similar to that of the Skp x-ray crystal structure (Walton et al., 2009), but with the helical tentacles more open resulting in a slightly larger Rg value than that for the crystal structure (Figure 6). This splaying of Skp is not unexpected because the tips of the helical tentacles are positively charged and flexible, based on the fact that two of them are missing in the x-ray crystal structure (PDB ID 1U2M). Also, recent NMR data from Skp-uOMP complexes demonstrated that residues 89 to 93, higher up the Skp tentacles closer to the body, display increased helicity on substrate binding and could therefore be at the pivot position for the splaying of the tentacles (Burmann et al., 2013). A crystal structure of the Tim 9–10 complex (PDB ID 2BSK), also lacks density for the tentacles, possibly due to inherent flexibility (Beverly, Sawaya, Schmid, & Koehler, 2008; Webb, Gorman, Lazarou, Ryan, & Gulbis, 2006).
5.2 Skp-uOMP structure and binding mechanism
Comparison of the SANS data for Skp alone in 98 % D2O and for the Skp-OmpA complex in 98 % D2O confirm that the conformation of Skp when bound to OmpA is similar to that when it is alone in solution, although it has a smaller Rg when bound to OmpA. When bound to OmpW, Skp adopts a conformation with a less symmetric configuration of the three tentacles and with an even smaller Rg. However, the Rg value for Skp in both complexes remains larger than that observed for the crystal structure. These data suggest that, in the absence of substrate, the Skp tentacles are in an open conformation (Figure 6b); on binding an uOMP, Skp collapses in a clamp-like mechanism towards the more closed conformation represented by the crystal structure (Figure 6a). This flexibility of the Skp tentacles may allow for different conformations of the Skp α-helices to accommodate different uOMPs with TM domains larger or smaller than those of OmpW and OmpA.
The SANS data revealed that the OmpA and OmpW TM domains are unfolded, but constrained in size, when bound to Skp. The Rg value of the TM region (Rg ≈ 24 Å) is significantly larger in comparison to that calculated from the crystal structure of the folded TM domain (Rg ≈ 14 Å) (Hong et al., 2006; Pautsch & Schulz, 1998). A similar radius (21 Å) was measured by NMR for paramagnetic spin-labeled OmpX that was bound to Skp (Burmann et al., 2013), in which case the volume occupied by OmpX was found to contain ≈ 50 % water. Like OmpW, OmpX (16.5 kDa) folds into an 8-stranded beta barrel integral membrane protein (Vogt & Schulz, 1999). Significantly, if these TM domains adopted a random coil state, as when fully chemically denatured, the theoretical Rg would be much larger (Fleming & Rose, 2005). For example, the radius of OmpX in 8M urea was determined by NMR to be 45 Å (Burmann & Hiller, 2012). Additionally, an Rg of the unfolded TM domain of OmpA in solution under folding conditions can be estimated from the sedimentation coefficient to be 32 Å (Danoff & Fleming, 2011). This value is still considerably larger than the value determined by SANS, which means that Skp sequesters the unfolded TM domains of the uOMPs in a conformation that is smaller than they would naturally adopt in solution.
The SANS analysis of Skp-OmpA and Skp-OmpW complexes suggests a model for the binding of the uOMP TM domains near the tips of the Skp tentacles (S3e24 in Figures 7 and 9; S3e24PP5 and S3-OmpA in Figure 11). This region of Skp, which is also involved in the initial capture of OmpA (Lyu, Shao, Gao, & Zhao, 2012), is highly positively charged due to a large number of arginine residues. Conversely, the uOMP TM domains are typified by their overall negative charge with a pI ranging between 4 and 7 (Jarchow et al., 2008). The Skp-uOMP complex may consequently be stabilized by continued electrostatic interactions between the tentacle tips and the uOMP. Such a notion is supported by fluorescence studies that show weakening of observed binding in the presence of high salt (Qu et al., 2007).
A similar arrangement of the TM domain of OmpX was found from TROSY NMR data collected from a SurA-OmpX complex. The results support the notion that the OmpX TM domain has the same preferred conformational ensemble either in complex with Skp or with SurA (Burmann & Hiller, 2012). The similarity between uOMP spectra may be explained by the small surface area by which both these chaperones interact with uOMPs. In particular, SurA can bind short peptides (7–14 residues long) with a specific tripeptide motif (Bitto & McKay, 2003). Additionally, amino acid deletion experiments on the small Tim complexes (Vergnolle et al., 2005) and for prefoldin (Siegert, Leroux, Scheufler, Hartl, & Moarefi, 2000) show the tips of their tentacles are required for substrate binding. The SANS-derived structures show the OmpW and OmpA TM domains are bound to Skp in a position analogous to the substrate bound to the prefoldin structure (Lundin et al., 2004). However, only the tips of the prefoldin tentacles interact with the unfolded actin and no electron density can be observed in the prefoldin cavity.
The model structures for Skp-OmpW and Skp-OmpA fit the SANS data best when the TM domain of OmpA is centered farther from the tips of the Skp tentacles, and thus closer to the body of Skp, than that of OmpW. In both cases, the closed conformation of Skp and the size and relative positions of the TM domains imply that a portion of the uOMP substrate is protruding outside the Skp cavity. This observation is consistent with interaction data from NMR analysis of Skp-uOMP complexes (Burmann et al., 2013; Callon et al., 2014; Walton et al., 2009), which demonstrated that binding is focused on the Skp tentacles, but that there is no single preferred conformation of uOMP in this region of Skp. Because NMR only maps the presence of interactions, any substrate residues that extend away from the Skp cavity would be spectroscopically silent. Thus, the SANS-derived structure models implying that individual strands of the uOMP migrate out of the Skp cavity are consistent with the NMR results. The combination of the inherent flexibility in the Skp tentacles and the lack of a specific structure for the bound uOMPs apparently insure that the uOMPs are sufficiently shielded from self-aggregation until the outer membrane is reached even if portions of the unfolded region protrude outside of the Skp cavity.
The best-fit structures to the Skp-OmpA SANS contrast variation data set using models with both ellipsoidal and all-atom representations of the TM region support a model for an elongated Skp-OmpA complex with a folded PP domain of OmpA protruding out near the bottom of the Skp tentacles. However, the ensembles of structures that represent the lowest ≈ 10 % of χ2(avg) values include those in which the PP domain of OmpA exits out to the side of Skp, and its location in any individual structure is not necessarily fixed. Furthermore, the calculated average SANS curve for the entire generated ensemble of structures fits the data almost as well as that from the best-fit structure. Thus, the solution can consist of a similar ensemble of structures in which the PP domain of OmpA assumes a number of different positions outside the Skp cavity and still be consistent with the SANS data.
5.5 Release Mechanism
The SANS data show that the Skp tentacles change conformation to accommodate different uOMP TM domains using a simple clamp-like mechanism used by jellyfish-like chaperones (Stirling et al., 2006). However, the fact that a portion of the uOMP polypeptide resides outside the Skp cavity implies that there is no requirement for a large-scale rearrangement of Skp for uOMP to be exchanged with an empty Skp trimer (Burmann et al., 2013) and other molecular chaperones (Schwalm et al., 2013; Sklar et al., 2007), or for uOMP to be presented to the Bam complex or to the bacterial outer membrane. While the PP domain of OmpA can exit from openings at either the base or the sides of the tentacles, there is an ample fraction of conformation space not occupied by the PP domain for any individual Skp-OmpA structure. Thus, the SANS data do not rule out the hypothesis that OmpA would exit the chaperone from its side. This is consistent with the capability of Skp to directly interact with membranes (De Cock et al., 1999), as well the idea that Skp may facilitate the folding of OmpA into negatively charged lipids or lipopolysaccharides (Bulieris et al., 2003; Patel, Behrens-Kneip, Holst, & Kleinschmidt, 2009). Even if the presence of the negatively charged uOMP counteracts the positive charges at the base of the Skp tentacles, a large section of the chaperone would still be available to bind lipids. In particular, in the SANS model of the Skp-OmpA complex, the three symmetrically-related, highly-conserved regions of Skp that are centered on residues E29, K77 and R88 (Burmann, Holdbrook, Callon, Bond, & Hiller, 2015) in the middle of each tentacle (Walton & Sousa, 2004) would remain accessible, and only one binding site would be lost during those times when the PP domain occupied that portion of conformation space.
6. CONCLUSIONS
Deuterium labeling of the uOMP component in Skp-OmpW and Skp-OmpA complexes coupled with SANS and contrast variation has enabled the measurement of individual Rg values of Skp and uOMP when in complex with each other. This experimental strategy also provided information on the distances between their centers of mass. These unique structural properties cannot be obtained using unlabeled complexes or other methodologies. Simultaneous analysis of the data allowed a determination of structure models consistent with the entire contrast variation data set. In conjunction with independent studies using other techniques, the SANS data were used to postulate how uOMPs are captured by Skp and subsequently released to the outer membrane.
Using the Rg information for Skp and the contrast variation data to constrain the model structures, it was determined that Skp can undergo conformational rearrangement to accommodate its client: Skp alone in solution is larger than Skp bound to OmpA, which is larger than Skp bound to OmpW, which is larger than Skp in protein crystals. Furthermore, the Skp tentacles are less ordered with respect to each other in the Skp-OmpW complex than in the Skp-OmpA complex. These findings would not have been revealed without deuterium labeling that allowed the separation of the Skp structure as it exists within the Skp-uOMP complexes. Skp dominated the scattering profile in 98 % D2O buffer, where differences were clearly observed between the Skp-OmpW data and the Skp-OmpA data. These differences were not readily observed in the 0 % D2O data, for instance, where Skp does not contribute as much to the scattering. This result suggests that the Skp tentacles have the ability to adjust to accommodate different uOMPs. Accordingly, because the uOMPs were labeled and distinguishable from the Skp component, it was possible to determine that the OmpW TM domain likely sits lower in the Skp cavity than the OmpA TM domain.
Finally, the resultant structure density plots mapping the conformation space of the OmpA PP domain revealed that it could exit from openings at either the base or the sides of the Skp tentacles. However, there is an ample fraction of conformation space not occupied by the PP domain for any individual Skp-OmpA structure. Given the flexibility of the Skp tentacles and the fact that a portion of the TM domain of uOMP resides outside the Skp cavity, it can be postulated that a low energy path will always exist such that the TM domains of both OmpW and OmpA can be delivered to the outer membrane or other chaperones. Specifically, the SANS data do not rule out the premise that the TM domain can exit from the side of Skp, even when a PP domain is present as in the case of OmpA.
Table 6.
Skp-OmpW Model Structure Rg as a Function of Contrast
| Model | 0 % D2O Rg (Å) | 30 % D2O Rg (Å) | 80 % D2O Rg (Å) | 98 % D2O Rg (Å) |
|---|---|---|---|---|
| S2e21 | 31.7 | 27.8 | 32.4 | 32.8 |
| S1e27 | 32.3 | 30.9 | 30.4 | 31.6 |
| S2e27 | 33.1 | 30.1 | 32.4 | 33.3 |
| S3e27s | 32.4 | 31.2 | 31.9 | 32.4 |
| S3e27 | 33.3 | 31.5 | 31.9 | 33.0 |
| S3e24 | 32.4 | 29.8 | 31.9 | 32.6 |
| Guinier | 32.7 ± 0.2 | 31 ± 1 | 31.5 ± 0.4 | 31.6 ± 0.2 |
| P(r) | 32.9 ± 0.1 | 29.0 ± 0.2 | 31.32 ± 0.03 | 31.3 ± 0.2 |
Acknowledgments
This work utilized facilities supported in part by the National Science Foundation under Agreements DMR-0944772 and MCB-1412108. The National Institute of Standards and Technology, U.S. Department of Commerce provided the Biomolecular Labeling Laboratory facilities used in this work. This work was supported by grants from the National Institutes of Health: R01-079440 (KGF) and T32-GM008403. This work benefitted from CCP-SAS software developed through a joint EPSRC (EP/K039121/1) and NSF (CHE-1265821) grant.
Footnotes
Certain commercial equipment, instruments, or materials are identified in this paper to foster understanding. Such identification does not imply recommendation or endorsement by the National Institute of Standards and Technology, nor does it imply that the materials or equipment identified are necessarily the best available for the purpose.
References
- Berrow NS, Alderton D, Sainsbury S, Nettleship J, Assenberg R, Rahman N, … Owens RJ. A versatile ligation-independent cloning method suitable for high-throughput expression screening applications. Nucleic Acids Research. 2007;35:e45–e45. doi: 10.1093/nar/gkm047. [DOI] [PMC free article] [PubMed] [Google Scholar]
- Beverly KN, Sawaya MR, Schmid E, Koehler CM. The Tim8–Tim13 Complex Has Multiple Substrate Binding Sites and Binds Cooperatively to Tim23. Journal of Molecular Biology. 2008;382:1144–1156. doi: 10.1016/j.jmb.2008.07.069. [DOI] [PMC free article] [PubMed] [Google Scholar]
- Bitto E, McKay DB. The periplasmic molecular chaperone protein SurA binds a peptide motif that is characteristic of integral outer membrane proteins. The Journal of Biological Chemistry. 2003;278:49316–49322. doi: 10.1074/jbc.M308853200. [DOI] [PubMed] [Google Scholar]
- Bulieris PV, Behrens S, Holst O, Kleinschmidt JH. Folding and insertion of the outer membrane protein OmpA is assisted by the chaperone Skp and by lipopolysaccharide. The Journal of Biological Chemistry. 2003;278:9092–9099. doi: 10.1074/jbc.M211177200. [DOI] [PubMed] [Google Scholar]
- Burgess NK, Dao TP, Stanley AM, Fleming KG. Beta-barrel proteins that reside in the Escherichia coli outer membrane in vivo demonstrate varied folding behavior in vitro. The Journal of Biological Chemistry. 2008;283:26748–26758. doi: 10.1074/jbc.M802754200. [DOI] [PMC free article] [PubMed] [Google Scholar]
- Burmann BM, Hiller S. Solution NMR studies of membrane-protein-chaperone complexes. Chimia. 2012;66:759–763. doi: 10.2533/chimia.2012.759. [DOI] [PubMed] [Google Scholar]
- Burmann BM, Holdbrook DA, Callon M, Bond PJ, Hiller S. Revisiting the Interaction between the Chaperone Skp and Lipopolysaccharide. Biophysical Journal. 2015;108:1516–1526. doi: 10.1016/j.bpj.2015.01.029. [DOI] [PMC free article] [PubMed] [Google Scholar]
- Burmann BM, Wang C, Hiller S. Conformation and dynamics of the periplasmic membrane-protein-chaperone complexes OmpX-Skp and tOmpA-Skp. Nature Structural & Molecular Biology. 2013;20:1265–1272. doi: 10.1038/nsmb.2677. [DOI] [PubMed] [Google Scholar]
- Callon M, Burmann BM, Hiller S. Structural mapping of a chaperone-substrate interaction surface. Angewandte Chemie (International Ed. in English) 2014;53:5069–5072. doi: 10.1002/anie.201310963. [DOI] [PubMed] [Google Scholar]
- Chen J, Im W, Brooks CL. Application of torsion angle molecular dynamics for efficient sampling of protein conformations. Journal of Computational Chemistry. 2005;26:1565–1578. doi: 10.1002/jcc.20293. [DOI] [PubMed] [Google Scholar]
- Chen R, Henning U. A periplasmic protein (Skp) of Escherichia coli selectively binds a class of outer membrane proteins. Molecular Microbiology. 1996;19:1287–1294. doi: 10.1111/j.1365-2958.1996.tb02473.x. [DOI] [PubMed] [Google Scholar]
- Clark NJ, Zhang H, Krueger S, Lee HJ, Ketchem RR, Kerwin B, … Curtis JE. Small-Angle Neutron Scattering Study of a Monoclonal Antibody Using Free-Energy Constraints. The Journal of Physical Chemistry B. 2013;117:14029–14038. doi: 10.1021/jp408710r. [DOI] [PubMed] [Google Scholar]
- Curtis JE, Raghunandan S, Nanda H, Krueger S. SASSIE: A program to study intrinsically disordered biological molecules and macromolecular ensembles using experimental scattering restraints. Computer Physics Communications. 2012;183:382–389. [Google Scholar]
- Danoff EJ, Fleming KG. The soluble, periplasmic domain of OmpA folds as an independent unit and displays chaperone activity by reducing the self-association propensity of the unfolded OmpA transmembrane β-barrel. Biophysical Chemistry. 2011;159:194–204. doi: 10.1016/j.bpc.2011.06.013. [DOI] [PMC free article] [PubMed] [Google Scholar]
- De Cock H, Schäfer U, Potgeter M, Demel R, Müller M, Tommassen J. Affinity of the periplasmic chaperone Skp of Escherichia coli for phospholipids, lipopolysaccharides and non-native outer membrane proteins. Role of Skp in the biogenesis of outer membrane protein. European Journal of Biochemistry/FEBS. 1999;259:96–103. doi: 10.1046/j.1432-1327.1999.00010.x. [DOI] [PubMed] [Google Scholar]
- Denoncin K, Schwalm J, Vertommen D, Silhavy TJ, Collet JF. Dissecting the Escherichia coli periplasmic chaperone network using differential proteomics. Proteomics. 2012;12:1391–1401. doi: 10.1002/pmic.201100633. [DOI] [PMC free article] [PubMed] [Google Scholar]
- Engelman D, Moore PB. Determination of Quaternary Structure by Small-Angle Neutron Scattering. Quarterly Reviews of Biophysics. 1975;4:219–241. doi: 10.1146/annurev.bb.04.060175.001251. [DOI] [PubMed] [Google Scholar]
- Entzminger KC, Chang C, Myhre RO, McCallum KC, Maynard JA. The Skp chaperone helps fold soluble proteins in vitro by inhibiting aggregation. Biochemistry. 2012;51:4822–4834. doi: 10.1021/bi300412y. [DOI] [PMC free article] [PubMed] [Google Scholar]
- Fleming PJ, Rose GD. Conformational Properties of Unfolded Proteins. In: Buckner J, Kiefhaber T, editors. Protein Folding Handbook. Vol. 2. Weinheim, Germany: Wiley - VCH; 2005. pp. 710–736. [Google Scholar]
- Glatter O. A new method for the evaluation of small-angle scattering data. Journal of Applied Crystallography. 1977;10:415–421. [Google Scholar]
- Glatter O, Kratky O. Small-Angle X-Ray Scattering. New York: Academic Press; 1982. [Google Scholar]
- Glinka CJ, Barker JG, Hammouda B, Krueger S, Moyer JJ, Orts WJ. The 30 m small-angle neutron scattering instruments at the national institute of standards and technology. Journal of Applied Crystallography. 1998;31:430–445. [Google Scholar]
- Grizot S, Buchanan SK. Structure of the OmpA-like domain of RmpM from Neisseria meningitidis. Molecular Microbiology. 2004;51:1027–1037. doi: 10.1111/j.1365-2958.2003.03903.x. [DOI] [PubMed] [Google Scholar]
- Guinier A, Fournet G. Small-angle Scattering of X-rays. New York: John Wiley & Sons, Inc; 1955. [Google Scholar]
- Hansen S. Calculation of small-angle scattering profiles using Monte Carlo simulation. Journal of Applied Crystallography. 1990;23:344–346. [Google Scholar]
- Harms N, Koningstein G, Dontje W, Muller M, Oudega B, Luirink J, de Cock H. The early interaction of the outer membrane protein phoe with the periplasmic chaperone Skp occurs at the cytoplasmic membrane. The Journal of Biological Chemistry. 2001;276:18804–18811. doi: 10.1074/jbc.M011194200. [DOI] [PubMed] [Google Scholar]
- Heidorn DB, Trewhella J. Comparison of the crystal and solution structures of calmodulin and troponin C. Biochemistry. 1988;27:909–915. doi: 10.1021/bi00403a011. [DOI] [PubMed] [Google Scholar]
- Heller WT. Small-angle neutron scattering and contrast variation: a powerful combination for studying biological structures. Acta Crystallographica Section D Biological Crystallography. 2010;66:1213–1217. doi: 10.1107/S0907444910017658. [DOI] [PubMed] [Google Scholar]
- Hong H, Patel DR, Tamm LK, van den Berg B. The outer membrane protein OmpW forms an eight-stranded beta-barrel with a hydrophobic channel. The Journal of Biological Chemistry. 2006;281:7568–7577. doi: 10.1074/jbc.M512365200. [DOI] [PubMed] [Google Scholar]
- Ibel K, Stuhrmann HB. Comparison of Neutron and X-ray Scattering of Dilute Myoglobin Solutions. Journal of Molecular Biology. 1975;93:255–265. doi: 10.1016/0022-2836(75)90131-x. [DOI] [PubMed] [Google Scholar]
- Ieva R, Tian P, Peterson JH, Bernstein HD. Sequential and spatially restricted interactions of assembly factors with an autotransporter beta domain. Proceedings of the National Academy of Sciences of the United States of America. 2011;108:E383–391. doi: 10.1073/pnas.1103827108. [DOI] [PMC free article] [PubMed] [Google Scholar]
- Jacques DA, Trewhella J. Small-angle scattering for structural biology--expanding the frontier while avoiding the pitfalls. Protein Science: A Publication of the Protein Society. 2010;19:642–657. doi: 10.1002/pro.351. [DOI] [PMC free article] [PubMed] [Google Scholar]
- Jacrot B. The study of biological structures by neutron scattering from solution. Reports on Progress in Physics. 1976;39:911–953. [Google Scholar]
- Jarchow S, Lück C, Görg A, Skerra A. Identification of potential substrate proteins for the periplasmic Escherichia coli chaperone Skp. Proteomics. 2008;8:4987–4994. doi: 10.1002/pmic.200800288. [DOI] [PubMed] [Google Scholar]
- Kline SR. Reduction and analysis of SANS and USANS data using IGOR Pro. Journal of Applied Crystallography. 2006;39:895–900. [Google Scholar]
- Korndörfer IP, Dommel MK, Skerra A. Structure of the periplasmic chaperone Skp suggests functional similarity with cytosolic chaperones despite differing architecture. Nature Structural & Molecular Biology. 2004;11:1015–1020. doi: 10.1038/nsmb828. [DOI] [PubMed] [Google Scholar]
- Krueger S, Gorshkova I, Brown J, Hoskins J, McKenney KH, Schwarz FP. Determination of the conformations of cAMP receptor protein and its T127L,S128A mutant with and without cAMP from small angle neutron scattering measurements. Journal of Biological Chemistry. 1998;273:20001–20006. doi: 10.1074/jbc.273.32.20001. [DOI] [PubMed] [Google Scholar]
- Krueger S, Shin JH, Curtis JE, Rubinson KA, Kelman Z. The solution structure of full-length dodecameric MCM by SANS and molecular modeling: Structure of Dodecameric MCM Helicase. Proteins: Structure, Function, and Bioinformatics. 2014;82:2364–2374. doi: 10.1002/prot.24598. [DOI] [PubMed] [Google Scholar]
- Krueger S, Shin JH, Raghunandan S, Curtis JE, Kelman Z. Atomistic ensemble modeling and small-angle neutron scattering of intrinsically disordered protein complexes: applied to minichromosome maintenance protein. Biophysical Journal. 2011;101:2999–3007. doi: 10.1016/j.bpj.2011.11.006. [DOI] [PMC free article] [PubMed] [Google Scholar]
- Li J, Shi C, Gao Y, Wu K, Shi P, Lai C, … Tian C. Structural studies of Mycobacterium tuberculosis Rv0899 reveal a monomeric membrane-anchoring protein with two separate domains. Journal of Molecular Biology. 2012;415:382–392. doi: 10.1016/j.jmb.2011.11.016. [DOI] [PubMed] [Google Scholar]
- Lundin VF, Stirling PC, Gomez-Reino J, Mwenifumbo JC, Obst JM, Valpuesta JM, Leroux MR. Molecular clamp mechanism of substrate binding by hydrophobic coiled-coil residues of the archaeal chaperone prefoldin. Proceedings of the National Academy of Sciences. 2004;101:4367–4372. doi: 10.1073/pnas.0306276101. [DOI] [PMC free article] [PubMed] [Google Scholar]
- Lyu ZX, Shao Q, Gao YQ, Zhao XS. Direct Observation of the Uptake of Outer Membrane Proteins by the Periplasmic Chaperone Skp. PLoS ONE. 2012;7:e46068. doi: 10.1371/journal.pone.0046068. [DOI] [PMC free article] [PubMed] [Google Scholar]
- MacKerell AD, Bashford D, Bellott, Dunbrack RL, Evanseck JD, Field MJ, … Karplus M. All-atom empirical potential for molecular modeling and dynamics studies of proteins. The Journal of Physical Chemistry B. 1998;102:3586–3616. doi: 10.1021/jp973084f. [DOI] [PubMed] [Google Scholar]
- Martín-Benito J, Boskovic J, Gómez-Puertas P, Carrascosa JL, Simons CT, Lewis SA, … Valpuesta JM. Structure of eukaryotic prefoldin and of its complexes with unfolded actin and the cytosolic chaperonin CCT. The EMBO Journal. 2002;21:6377–6386. doi: 10.1093/emboj/cdf640. [DOI] [PMC free article] [PubMed] [Google Scholar]
- Martín-Benito J, Gómez-Reino J, Stirling PC, Lundin VF, Gómez-Puertas P, Boskovic J, … Leroux MR. Divergent Substrate-Binding Mechanisms Reveal an Evolutionary Specialization of Eukaryotic Prefoldin Compared to Its Archaeal Counterpart. Structure. 2007;15:101–110. doi: 10.1016/j.str.2006.11.006. [DOI] [PubMed] [Google Scholar]
- McMorran LM, Bartlett AI, Huysmans GHM, Radford SE, Brockwell DJ. Dissecting the effects of periplasmic chaperones on the in vitro folding of the outer membrane protein PagP. Journal of Molecular Biology. 2013;425:3178–3191. doi: 10.1016/j.jmb.2013.06.017. [DOI] [PMC free article] [PubMed] [Google Scholar]
- Moon CP, Zaccai NR, Fleming PJ, Gessmann D, Fleming KG. Membrane protein thermodynamic stability may serve as the energy sink for sorting in the periplasm. Proceedings of the National Academy of Sciences of the United States of America. 2013;110:4285–4290. doi: 10.1073/pnas.1212527110. [DOI] [PMC free article] [PubMed] [Google Scholar]
- Moore PB. Small-angle scattering techniques for the study of biological macromolecules and macromolecular aggregates. In: Ehrenstein G, Lecar H, editors. Methods of Experimental Physics. Vol. 20. New York: Academic Press; 1982. pp. 337–390. [Google Scholar]
- Patel GJ, Behrens-Kneip S, Holst O, Kleinschmidt JH. The periplasmic chaperone Skp facilitates targeting, insertion, and folding of OmpA into lipid membranes with a negative membrane surface potential. Biochemistry. 2009;48:10235–10245. doi: 10.1021/bi901403c. [DOI] [PubMed] [Google Scholar]
- Pautsch A, Schulz GE. Structure of the outer membrane protein A transmembrane domain. Nature Structural Biology. 1998;5:1013–1017. doi: 10.1038/2983. [DOI] [PubMed] [Google Scholar]
- Peng Y, Curtis JE, Fang X, Woodson SA. Structural model of an mRNA in complex with the bacterial chaperone Hfq. Proceedings of the National Academy of Sciences. 2014;111:17134–17139. doi: 10.1073/pnas.1410114111. [DOI] [PMC free article] [PubMed] [Google Scholar]
- Phillips JC, Braun R, Wang W, Gumbart J, Tajkhorshid E, Villa E, … Schulten K. Scalable molecular dynamics with NAMD. Journal of Computational Chemistry. 2005;26:1781–1802. doi: 10.1002/jcc.20289. [DOI] [PMC free article] [PubMed] [Google Scholar]
- Putnam CD, Hammel M, Hura GL, Tainer JA. X-ray solution scattering (SAXS) combined with crystallography and computation: defining accurate macromolecular structures, conformations and assemblies in solution. Quarterly Reviews of Biophysics. 2007;40 doi: 10.1017/S0033583507004635. [DOI] [PubMed] [Google Scholar]
- Qu J, Mayer C, Behrens S, Holst O, Kleinschmidt JH. The trimeric periplasmic chaperone Skp of Escherichia coli forms 1:1 complexes with outer membrane proteins via hydrophobic and electrostatic interactions. Journal of Molecular Biology. 2007;374:91–105. doi: 10.1016/j.jmb.2007.09.020. [DOI] [PubMed] [Google Scholar]
- Rambo RP, Tainer JA. Bridging the solution divide: comprehensive structural analyses of dynamic RNA, DNA, and protein assemblies by small-angle X-ray scattering. Current Opinion in Structural Biology. 2010;20:128–137. doi: 10.1016/j.sbi.2009.12.015. [DOI] [PMC free article] [PubMed] [Google Scholar]
- Ramelot TA, Zhao L, Hamilton K, Maglaqui M, Xiao R, Liu J, … Kennedy MA. Solution NMR structure of the folded C-terminal fragment of YiaD from Escherichia coli. Northeast Structural Genomics Consortium target ER553; n.d. Unpublished. [Google Scholar]
- REDUX. n.d Retrieved April 20, 2015, from http://pages.jh.edu/pfleming/sw/redux/
- Rhodius VA, Suh WC, Nonaka G, West J, Gross CA. Conserved and variable functions of the sigmaE stress response in related genomes. PLoS Biology. 2006;4:e2. doi: 10.1371/journal.pbio.0040002. [DOI] [PMC free article] [PubMed] [Google Scholar]
- Sarachan KL, Curtis JE, Krueger S. Small-angle scattering contrast calculator for protein and nucleic acid complexes in solution. Journal of Applied Crystallography. 2013;46:1889–1893. [Google Scholar]
- SASSIE-web : Beta. n.d Retrieved June 19, 2015, from https://sassie-web.chem.utk.edu/sassie2/
- Schäfer U, Beck K, Müller M. Skp, a molecular chaperone of gram-negative bacteria, is required for the formation of soluble periplasmic intermediates of outer membrane proteins. The Journal of Biological Chemistry. 1999;274:24567–24574. doi: 10.1074/jbc.274.35.24567. [DOI] [PubMed] [Google Scholar]
- Schlapschy M, Dommel MK, Hadian K, Fogarasi M, Korndörfer IP, Skerra A. The periplasmic E. coli chaperone Skp is a trimer in solution: biophysical and preliminary crystallographic characterization. Biological Chemistry. 2004;385 doi: 10.1515/BC.2004.032. [DOI] [PubMed] [Google Scholar]
- Schwalm J, Mahoney TF, Soltes GR, Silhavy TJ. Role for Skp in LptD assembly in Escherichia coli. Journal of Bacteriology. 2013;195:3734–3742. doi: 10.1128/JB.00431-13. [DOI] [PMC free article] [PubMed] [Google Scholar]
- Schwede T, Kopp J, Guex N, Peitsch MC. SWISS-MODEL: An automated protein homology-modeling server. Nucleic Acids Research. 2003;31:3381–3385. doi: 10.1093/nar/gkg520. [DOI] [PMC free article] [PubMed] [Google Scholar]
- Semenyuk AV, Svergun DI. GNOM – a program package for small-angle scattering data processing. Journal of Applied Crystallography. 1991;24:537–540. doi: 10.1107/S0021889812007662. [DOI] [PMC free article] [PubMed] [Google Scholar]
- Siegert R, Leroux MR, Scheufler C, Hartl FU, Moarefi I. Structure of the molecular chaperone prefoldin: unique interaction of multiple coiled coil tentacles with unfolded proteins. Cell. 2000;103:621–632. doi: 10.1016/s0092-8674(00)00165-3. [DOI] [PubMed] [Google Scholar]
- Sklar JG, Wu T, Kahne D, Silhavy TJ. Defining the roles of the periplasmic chaperones SurA, Skp, and DegP in Escherichia coli. Genes & Development. 2007;21:2473–2484. doi: 10.1101/gad.1581007. [DOI] [PMC free article] [PubMed] [Google Scholar]
- Stirling PC, Bakhoum SF, Feigl AB, Leroux MR. Convergent evolution of clamp-like binding sites in diverse chaperones. Nature Structural & Molecular Biology. 2006;13:865–870. doi: 10.1038/nsmb1153. [DOI] [PubMed] [Google Scholar]
- The PyMOL Molecular Graphics System, Version 1.7.4. Schrödinger, LLC; n.d. [Google Scholar]
- Vergnolle MAS, Baud C, Golovanov AP, Alcock F, Luciano P, Lian LY, Tokatlidis K. Distinct Domains of Small Tims Involved in Subunit Interaction and Substrate Recognition. Journal of Molecular Biology. 2005;351:839–849. doi: 10.1016/j.jmb.2005.06.010. [DOI] [PubMed] [Google Scholar]
- Vogt J, Schulz GE. The structure of the outer membrane protein OmpX from Escherichia coli reveals possible mechanisms of virulence. Structure (London, England: 1993) 1999;7:1301–1309. doi: 10.1016/s0969-2126(00)80063-5. [DOI] [PubMed] [Google Scholar]
- Walton TA, Sandoval CM, Fowler CA, Pardi A, Sousa MC. The cavity-chaperone Skp protects its substrate from aggregation but allows independent folding of substrate domains. Proceedings of the National Academy of Sciences of the United States of America. 2009;106:1772–1777. doi: 10.1073/pnas.0809275106. [DOI] [PMC free article] [PubMed] [Google Scholar]
- Walton TA, Sousa MC. Crystal structure of Skp, a prefoldin-like chaperone that protects soluble and membrane proteins from aggregation. Molecular Cell. 2004;15:367–374. doi: 10.1016/j.molcel.2004.07.023. [DOI] [PubMed] [Google Scholar]
- Webb CT, Gorman MA, Lazarou M, Ryan MT, Gulbis JM. Crystal structure of the mitochondrial chaperone TIM9.10 reveals a six-bladed alpha-propeller. Molecular Cell. 2006;21:123–133. doi: 10.1016/j.molcel.2005.11.010. [DOI] [PubMed] [Google Scholar]
- Webb CT, Heinz E, Lithgow T. Evolution of the β-barrel assembly machinery. Trends in Microbiology. 2012;20:612–620. doi: 10.1016/j.tim.2012.08.006. [DOI] [PubMed] [Google Scholar]
- Whitten AE, Cai S, Trewhella J. MULCh : modules for the analysis of small-angle neutron contrast variation data from biomolecular assemblies. Journal of Applied Crystallography. 2008;41:222–226. [Google Scholar]
- Whitten AE, Jacques DA, Hammouda B, Hanley T, King GF, Guss JM, … Langley DB. The Structure of the KinA-Sda Complex Suggests an Allosteric Mechanism of Histidine Kinase Inhibition. Journal of Molecular Biology. 2007;368:407–420. doi: 10.1016/j.jmb.2007.01.064. [DOI] [PubMed] [Google Scholar]
- Whitten AE, Trewhella J. Small-Angle Scattering and Neutron Contrast Variation for Studying Bio-Molecular Complexes. In: Foote RS, Lee JW, editors. Micro and Nano Technologies in Bioanalysis. Vol. 544. Totowa, NJ: Humana Press; 2009. pp. 307–323. [DOI] [PubMed] [Google Scholar]
- Wu S, Ge X, Lv Z, Zhi Z, Chang Z, Zhao XS. Interaction between bacterial outer membrane proteins and periplasmic quality control factors: a kinetic partitioning mechanism. Biochemical Journal. 2011;438:505–511. doi: 10.1042/BJ20110264. [DOI] [PubMed] [Google Scholar]
- Wu XB, Tian LH, Zou HJ, Wang CY, Yu ZQ, Tang CH, … Pan JY. Outer membrane protein OmpW of Escherichia coli is required for resistance to phagocytosis. Research in Microbiology. 2013;164:848–855. doi: 10.1016/j.resmic.2013.06.008. [DOI] [PubMed] [Google Scholar]
- Zaccai G. Straight lines of neutron scattering in biology: a review of basic controls in SANS and EINS. European Biophysics Journal: EBJ. 2012;41:781–787. doi: 10.1007/s00249-012-0825-5. [DOI] [PubMed] [Google Scholar]


