

Abstract
Background
Healthy cows consume large amounts of potassium and a sudden loss in appetite can lead to hypokalemia. The routine method to evaluate potassium homeostasis is the measurement of the extracellular potassium in plasma or serum, but this does not provide information about the intracellular potassium pool.
Hypothesis/Objectives
To evaluate potassium homeostasis by comparing the extracellular and intracellular potassium concentration in cows with reduced feed intake and gastrointestinal ileus.
Animals
Twenty cows 1–3 days postpartum (group 1) and 20 cows with gastrointestinal ileus (group 2).
Methods
Observational cross‐sectional study. Plasma potassium was measured by using an ion‐sensitive electrode. Intracellular potassium was measured in erythrocytes and muscle tissue (muscle biopsy) by using inductively coupled plasma optical emission spectroscopy.
Results
Cows of group 1 did not have hypokalemia. Overall cows with gastrointestinal ileus were hypokalemic (mean ± SD, 2.9 mmol/L ± 0.78), but potassium concentration in erythrocytes and muscle tissue was not lower than in postpartum cows. Intracellular potassium in erythrocytes varied very widely; group 1: 3497–10735 mg/kg (5559 ± 2002 mg/kg), group 2: 4139–21678 mg/kg (7473 ± 4034 mg/kg). Potassium in muscle tissue did not differ between group 1 (3356 ± 735 mg/kg wet weight) and group 2 (3407 ± 1069 mg/kg wet weight). No association between extracellular and intracellular potassium concentrations was detected.
Conclusions and clinical importance
That measurement of plasma potassium concentration is not sufficient to evaluate potassium metabolism of cows.
Keywords: Cattle, Gastrointestinal tract surgery, Hypokalemia, Postpartum period, Potassium metabolism
Abbreviations
- BCS
body condition score
- ICP‐OES
inductively coupled plasma optical emission spectroscopy
- ISE
ion‐selective electrode
- LHp
lithium heparin
- SD
standard deviation
- PGA
polyglycolic acid
Potassium is the most abundant intracellular cation in animal and human tissue. It is essential for various physiologic processes such as cell volume regulation, electrolyte balance, membrane potential, and muscle contraction.1 Therefore, changes in the amount of potassium available for metabolism might have serious consequences. Some authors divide this availability into external and internal potassium balance.2, 3 External potassium balance is determined by input (intake with food) and output largely by kidney excretion. Potassium balance can therefore be disturbed by a decline in appetite or renal failure. Drugs having diuretic or mineralocorticoid effects such as isoflupredone acetate can also increase the potassium loss enhancing the excretion via urine.4, 5 The internal potassium balance, which describes the distribution of potassium between intra‐ and extracellular body compartments, is also influenced by numerous factors. Acidemia, ischemia, cell damage, alpha‐adrenergic agonists, and heavy exercise all lead to a shift of intracellular potassium into the extracellular space, whereas alkalosis (administration of sodium bicarbonate), beta‐adrenergic agonists, insulin (administration of glucose), and aldosterone cause a shift of potassium into the cells.6, 7, 8, 9
Healthy cows take up large amounts of potassium with their feed (around 200–500 g/d depending on components) and eliminate substantial amounts of excessive potassium via their kidneys.3, 10 However, a sudden decrease of feed intake and subsequently a sudden decrease in potassium intake can lead to hypokalemia as excretory mechanisms are not able to react fast enough and a basal potassium excretion via urine cannot be further reduced.2 In cows, clinically apparent hypokalemia (paralysis) occurs only in cases when plasma potassium concentrations drop substantially below the reference range (<2.1 mmol/L), whereas moderately decreased plasma potassium concentrations between 2.2 and 3.5 mmol/L typically only result in differences in muscle function (gait, sitting down, and standing up) and muscle fasciculation.11
Potassium ions are more abundant in the intracellular space than in the extracellular fluids (3.9–5.8 mmol/L extracellular versus 150–160 mmol/L intracellular).12 The routine method for evaluating potassium homeostasis is measuring the plasma potassium concentration of cattle, but this reflects only the small amount of the extracellular potassium and cannot provide information about the concentration in the intracellular pool. However, the intracellular potassium is physiologically equally or even more relevant.
The aims of this study were to evaluate if cows with reduced feed intake suffer from potassium depletion or simply shift potassium between intra‐ and extracellular space by comparing the extracellular and intracellular potassium concentrations of cows with either a decreased feed intake or gastrointestinal ileus. We hypothesized that cows with decreased feed intake develop potassium depletion not only in the extracellular space but also in the intracellular compartment and that intra‐ and extracellular potassium concentrations are associated. The study aimed to examine the value of muscle tissue for the evaluation of potassium metabolism in cows. Further it was hypothesized that muscle tissue and not erythrocytes are the most appropriate sample material for the intracellular measurement of potassium.
Materials and methods
All protocols used concerning animal treatment were approved by the institutional ethics committee and the governmental animal protection authority according to national legislation.
Animals
The cross‐sectional study was conducted including a convenience sample of 40 cows. Two groups of animals were defined for the study. Group 1 (20 cows) was recruited from healthy cows (15 Simmental cows with approximately 750 kg live weight, 5 Holstein Friesian cows with approximately 700 kg live weight) of the teaching and research farm of the Vetmeduni Vienna which were sampled immediately postpartum (1–3 days) as hypokalemia is a frequently reported condition during this period.11, 13 The sampled cows were between 2.1 and 9.2 years old (4.29 ± 2.02). Dry cows are kept in a straw‐bedded group pen and are fed corn silage, grass silage, hay, straw, high‐protein concentrate (Rindastar 39 XP),1 and minerals (Rindavit VK).2 Ten days before the expected calving date, the cows were moved in a straw‐bedded group calving pen. To facilitate adaption to the ration of the lactating cows, they were fed 1 kg of concentrate consisting of grain maize, wheat, rye, and minerals (Rindavit TMR 11 ASSCO)3 additionally to the ration of the dry cows. They are integrated into the milking cow group 12 hours after calving. The milking cows are kept in a herd of 70 cows in a loose‐housing barn with concrete floors and straw‐bedded cubicles. A basic ration consisting of grass silage, corn silage, a high‐protein animal feed (Rindastar 39 XP),1 and hay is fed 8 times a day by a feeding robot. Additionally, 2 kg of concentrate consisting of grain maize, wheat, rye, and minerals (Rindavit TMR 11 ASSCO)3 is fed via an automatic feeding station. The amount of concentrate is adapted according to the individual milk yield. The health status of group 1 was confirmed by a physical examination. Body condition score (BCS) was estimated using a five‐point scale.14 The Simmental cows had a BCS of 3.5 ± 0.5, the Holstein Friesian had a BCS of 3.0 ± 0.5. Samples were always taken between 10.00 and 12.00 AM. Group 2 (20 cows) was recruited from the patient pool of the university clinic for ruminants of the Vetmeduni Vienna. The cows (16 Simmental cows, 2 Holstein Friesian cows, 1 Brown Swiss cow, and 1 cross‐breed Simmental x Red Friesian cow) were referred to the clinic for surgery because of a gastrointestinal ileus. The most frequent diagnosis was left displacement of the abomasum (6 cases) followed by abomasal volvulus and volvulus of the small intestine (4 cases each). In addition, 3 animals suffered from hemorrhagic bowel syndrome, 2 cows had a dilated and displaced cecum and 1 cow had a paralytic ileus of unknown etiology.
Samples
A blood sample was obtained from the coccygeal vein or artery using a 2 mL lithium heparin (LHp) syringe.4 The blood sample was put immediately on ice and stored for a maximum of 1.5 hours until potassium measurement was performed with an ion‐sensitive electrode (ISE) which is integrated in an electrolyte and blood gas analyzer.5 This device uses whole‐blood lithium heparin samples to measure potassium in the blood plasma via optical fluorescence measurement. With this method, only free available potassium in the blood plasma is measured. One EDTA blood sample (for complete blood count) and 1 LHp blood sample (for the measurement of intracellular potassium in erythrocytes) were also collected from the coccygeal vein or artery using a vacuum blood collection system.6 The muscle biopsy specimen was obtained from the gluteal muscles using a suction‐modified Bergstrom muscle biopsy needle.7 15 The gluteal muscle has also been used in previous publications16, 17 and was chosen because it is easily obtainable and the biopsy area can be standardized. For this purpose, an approximately 7 × 7 cm large square of the skin was prepared aseptically. The skin was clipped, washed with iodine soap and finally cleaned and disinfected with 96% alcohol. Procaine hydrochloride8 (5 mL of 2% solution) was injected SC for local anesthesia. Using a scalpel blade, a stab incision of about 7 mm length was made through skin and subcutaneous fat. Then an approximately 200 mg muscle biopsy specimen was obtained using the biopsy needle7, put into the sample vial9 which was tightly closed and analyzed for tissue potassium (IDEXX laboratories Germany). Biopsy specimens were kept at room temperature until analyzed similar to studies which have been published recently.18, 19, 20 The analysis was performed within 48 hours of sample collection. The incision was closed using 3.5 metric polyglycolic acid (PGA) resorbable suture material10 and treated with an aerosol containing chlortetracyclinhydrochlorid.11
Sample preparation and laboratory analysis
For complete red and white blood cell count via flow cytometry,12 EDTA blood samples were sent to the central laboratory diagnostic unit of the Vetmeduni Vienna. The potassium measurement in blood plasma was performed at the laboratory of the clinics for ruminants using an ISE incorporated in a blood gas analysis device.5 The potassium concentration in tissue and in the erythrocytes were measured by one of the authors (Dr. Anja Müller, Vet Med Labor GmhH, Division of IDEXX Laboratories, Germany) using inductively coupled plasma optical emission spectroscopy (ICP‐OES)13 which has been described previously.18, 19, 20 Dr. Müller was blinded to the origin of the samples. For the measurements of intracellular potassium concentration in erythrocytes, 1 mL of the heparinized blood was mixed with physiologic NaCl solution and centrifuged. The supernatant was discarded. This procedure was repeated 3 times. Then samples were dried over night at 70°C and afterwards weighed, mixed with 1 mL HNO3 Suprapur.14 The erythrocytes were then dissolved using a hot (70–80°C) ultrasonic bath.15 As the potassium concentration of all erythrocytes in 1 mL of Heparin blood was measured with this method, the values were corrected to a hematocrit of 100% using the formula (K in erythrocytes/hematocrit)*100, which has been described before.21 The raw muscle samples were weighed, mixed with HNO3 Suprapur14 and thermally processed. Finally, the diluted samples were again analyzed using ICP‐OES13 with emission line 766.491 nm according to the standard operating procedure of the laboratory.16
Statistical analysis
The results were evaluated by using a statistical software package.17 Descriptive statistics has been conducted calculating arithmetic mean values and standard deviation (SD). Data were expressed graphically using boxplot diagrams. Normal distribution was tested using Kolmogorov‐Smirnov Test. The data were normally distributed, therefore t‐test for independent samples was performed to test statistical hypotheses concerning differences between group 1 and 2. Assumption of equal variances was tested using Levene's test. There was no significant difference between the variances of the groups for potassium concentration in muscle tissue and erythrocytes, therefore t‐test for equal variances was performed. For potassium concentration in plasma, equal variances could not be assumed, therefore a correction according to Welch was carried out (Welch t‐test). P‐values < 0.05 were considered significant. Associations between different variables have been evaluated by linear regression analysis and calculation of Pearson correlation coefficients. For evaluation of a curvilinear relationship, Spearman′s rho correlation coefficients were calculated in addition.
Results
Plasma potassium concentrations
The plasma potassium concentration of cows postpartum (group 1) ranged between 3.6 mmol/L and 4.9 mmol/L with a mean of 4.22 mmol/L and a standard deviation of 0.37. There was no difference in plasma potassium concentration between the 2 used breeds in group 1 (Holstein Friesian and Simmental cows). Cows with gastrointestinal ileus (group 2) showed a variably developed hypokalemia. Potassium concentrations ranged between 1.7 mmol/L and 4.4 mmol/L with an arithmetic mean of 2.9 mmol/L and a standard deviation of 0.78 (Fig. 1). Some of the hypokalemic cows showed muscle tremor, but no other signs of paralysis were observed.
Figure 1.

Boxplot of plasma potassium concentrations of group 1 (cows postpartum, n = 20) and group 2 (cows with gastrointestinal ileus, n = 20). The plasma potassium concentrations of cows postpartum were within the reference range. Cows with gastrointestinal ileus showed a variably developed hypokalemia.
Intracellular potassium concentrations
The intracellular potassium was considerably higher than blood plasma potassium and differed significantly between erythrocytes and muscle tissue (P < 0.001). The amount of intracellular potassium measured in erythrocytes and corrected to a hematocrit of 100 varied very widely, ranging from 3497 mg/kg to 10735 mg/kg dry weight in group 1 with a mean value of 5559 mg/kg dry weight and a standard deviation of 2002 mg/kg. Group 2 showed similar results: minimum intracellular potassium was 4139 mg/kg dry weight, maximum 21678 mg/kg dry weight, mean value 7473 mg/kg dry weight, and standard deviation was 4034 mg/kg (Fig. 2). Although erythrocytes of group 2 had a slightly higher intracellular potassium values, there was no statistical significant difference between group 1 and group 2 (P = 0.065).
Figure 2.

Boxplot of potassium concentration in erythrocytes (mg/kg dry weight) corrected to a hematocrit of 100 using the formula (K in erythrocytes/hematocrit)*100 of group 1 (cows postpartum, n = 20) and group 2 (cows with gastrointestinal ileus, n = 20). Outliers are symbolized by circles, extreme values by asterisks. There was no statistically significant difference between the 2 groups (P = 0.065).
The concentration of potassium in muscle tissue also did not differ between group 1 and group 2 (see Fig. 3). In group 1, muscle tissue potassium content ranged from 1333 mg/kg wet weight to 4641 mg/kg wet weight with a mean value of 3356 mg/kg wet weight and a standard deviation of 735 mg/kg wet weight. Group 2 showed a minimum value of intracellular potassium in muscle tissue of 2164 mg/kg wet weight, a maximum value of 7408 mg/kg wet weight, a mean value of 3407 mg/kg wet weight, and a standard deviation of 1069 mg/kg wet weight. Again there was no significant difference between these figures (P = 0.86).
Figure 3.

Boxplot of potassium concentrations in muscle tissue (mg/kg wet weight) of group 1 (cows postpartum, n = 20) and group 2 (cows with gastrointestinal ileus, n = 20). Outliers are symbolized by circles, extreme values by asterisks. There was no statistically significant difference between the 2 groups (P = 0.86).
Associations of potassium between different compartments
Associations between the extracellular blood plasma potassium values with the corresponding intracellular potassium concentrations in erythrocytes and muscle tissue were calculated. Associations were calculated separately for group 1 (normokalemic cows) and group 2 (hypokalemic cows). As shown in Figs 4 and 5, there was no meaningful association between plasma potassium and intracellular potassium concentration, whether in erythrocytes or in muscle tissue. Additionally, Pearson correlation coefficient and Spearman′s rho were calculated for the 3 compartments. There were no statistically significant correlation coefficients (Table 1).
Figure 4.

Results of the regression analyses between plasma potassium concentration and potassium in muscle tissue for cows of group 1 (cows postpartum, n = 20) and group 2 (cows with gastrointestinal ileus, n = 20). There was no association between plasma potassium and potassium in muscle tissue. ◊ cows postpartum, ● cows with gastrointestinal ileus;  linear regression line for cows postpartum (r = 0.21; P = 0.37),
  linear regression line for cows with gastrointestinal ileus (r = −0.41; P = 0.070).
Figure 5.
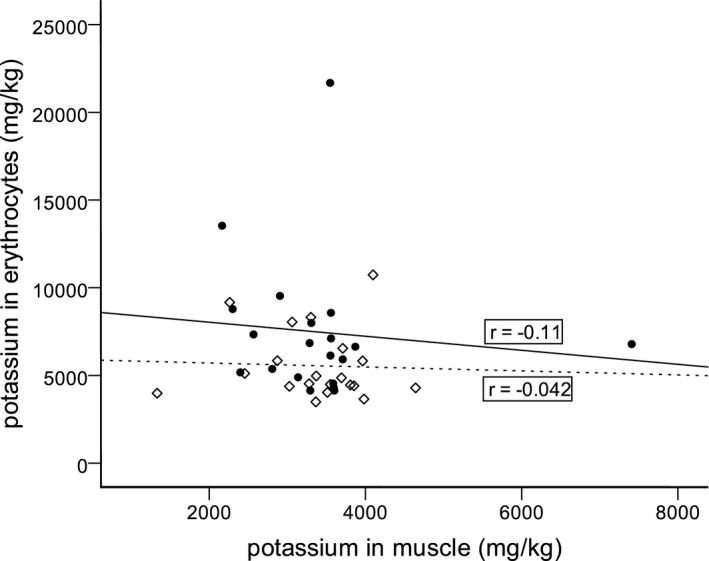
Results of the regression analyses between potassium in erythrocytes and potassium in muscle tissue for cows of group 1 (cows postpartum, n = 20) and group 2 (cows with gastrointestinal ileus, n = 20). There was no association between potassium in erythrocytes and potassium in muscle tissue. ◊ cows postpartum, ● cows with gastrointestinal ileus;  linear regression line for cows postpartum (r = −0.042; P = 0.86),
  linear regression line for cows with gastrointestinal ileus (r = −0.11; P = 0.66).
Table 1.
Pearson and Spearman coefficients for correlation between plasma potassium concentration and erythrocytes potassium concentration, plasma potassium concentration and muscle tissue potassium concentration, and erythrocytes potassium concentration and muscle tissue potassium concentration. There was no statistically significant correlation between the potassium concentrations of the 3 examined compartments
| Group 1 | Postpartum | ||
|---|---|---|---|
| Plasma and erythrocytes | Plasma and muscle | Erythrocytes and muscle | |
| Pearson correlation coefficient | −0.19 | 0.21 | −0.042 |
| Significance for Pearson correlation | 0.42 | 0.37 | 0.86 |
| Spearman′s rho | −0.20 | 0.045 | −0.13 |
| Significance for Spearman correlation | 0.41 | 0.85 | 0.59 |
| Group 2 | Gastrointestinal Ileus | ||
|---|---|---|---|
| Plasma and erythrocytes | Plasma and muscle | Erythrocytes and muscle | |
| Pearson correlation coefficient | −0.27 | −0.41 | −0.11 |
| Significance for Pearson correlation | 0.25 | 0.070 | 0.66 |
| Spearman′s rho | −0.18 | −0.35 | −0.35 |
| Significance for Spearman correlation | 0.46 | 0.13 | 0.13 |
Discussion
The underlying theme of these studies was that in bovine veterinary practice, hypokalemia is an underestimated problem. Furthermore, veterinarians only measure extracellular potassium in blood samples in daily clinical routine. The intracellular potassium is usually not considered when evaluating potassium balance. The main findings of the present study were: firstly, that cows of group 1, which were sampled 1–3 days postpartum did not develop hypokalemia. Secondly, there was no association between the intracellular potassium pool and the blood plasma potassium concentrations. And thirdly, erythrocytes did not appear to be a suitable sample material for the intracellular measurement of potassium. These findings underline the fact that we have to reconsider the classical methodologies for the evaluation of potassium metabolism in cows.
Cows postpartum were expected to have markedly decreased plasma potassium concentrations caused by a decrease of feed intake. This was reported previously by other groups.11, 13 However, in our study, this was not the case. There are several possible explanations for this fact. Plasma potassium concentrations could have been affected by the loss of appetite and reduced feed intake around parturition, but did not drop below the reference range. In order to determine a slight decline of serum potassium, daily measurement over some weeks before and after parturition would be needed. It might also be possible that a decline in plasma potassium values can be observed only in a later period postpartum. Plasma potassium concentrations of cows 2 and 7 weeks postpartum resembling ours have been published before but only 5 cows were used in this study.22 Potassium in plasma harvested from heparinized blood samples shortly after parturition has been measured in an older study.23 Blood plasma potassium values of cows at parturition (paretic and nonparetic) with blood plasma potassium concentrations of cows 5–18 days after parturition and nonparturient cows were compared. There were no statistically significant differences between the 3 groups. However, decreased potassium concentrations in the semitendinosus muscle of paretic parturient cows compared with nonparetic parturient cows have been found. Decreased extracellullar calcium concentrations cause an increase of membrane permeability for sodium and potassium. Therefore, intracellular potassium could easily have been moved into the extracellular space and so lead to the reduced intracellular potassium concentrations found and implied that effects of potassium depletion would not be seen automatically in the extracellular space because of a redistribution of the cation in the different compartments.23 Another important factor inducing hypokalemia by a shift of potassium into the intracellular space is treatment of ketosis with glucose or gluconeogenic steroids.11 However, none of the cows in group 1 were treated for either hypocalcaemia or ketosis before the sampling. It has been described that muscle tissue acts as a total body potassium store and therefore lean dairy breeds are more predisposed for the development of hypokalemia than beef breeds.9 In our study, we sampled 5 Holstein and 15 Simmental cows (dual purpose breed) and there was no difference in blood plasma potassium concentrations between the 2 breeds. Possible preanalytic changes caused by sample storage might have possibly influenced the plasma potassium concentration. As analysis of the samples has always been performed within a maximum time span of 1.5 hours and they were placed on ice for a short period of time, it is reasonable to believe that sample storage did not have a significant influence on the measurement. By cooling heparinized blood samples, glycolysis, which is needed for energy supply for the sodium‐potassium pump, is substantially inhibited. The sodium‐potassium pump is responsible for keeping the intracellular potassium within the cell. If there is not enough energy for this pump to work, potassium can leak out of the cells, thereby causing a slight increase in blood plasma potassium.24 Additionally, in the present study all cows of group 1 are kept on the University teaching and research farm, and had an optimized transitional period diet and management and so might have a less pronounced decline in dry mass intake during the period postpartum than usual.
Unsurprisingly, 90% of the cows in group 2 (cows with gastrointestinal ileus) suffered from a more or less pronounced hypokalemia, and this has been described in literature.9, 25, 26 Hypokalemia has been proposed to be not only a consequence of but also an etiological factor of diseases associated with gastrointestinal obstruction like displacement of the abomasum.27 The underlying mechanism seems to be a decreased contractility of the gastrointestinal smooth muscle cells caused by potassium deficiency in the extracellular fluid.28 From this study however it is not possible to differentiate if hypokalemia was already present before the ileus or if the ileus was the primary condition.
However, the intracellular potassium concentrations of cows with gastrointestinal ileus did not differ from those of cows postpartum possibly the relatively sudden decrease in plasma potassium concentrations caused by the gastrointestinal obstruction was not long enough to lower the intracellular potassium pool. This conclusion is, however, limited by the fact that there are no established values for intracellular potassium of cows.
It has to be considered, that the used method also included a very small volume of extracellular (intercellular) fluid in our muscle samples, but potassium is mainly present in the intracellular space and this systematic measuring inaccuracy is similar for all samples. As the intercellular fluid volume is very small and this fluid has a low potassium concentration, it is not likely that this resulted in a major influence of the results. Further this influence was constant in all samples.
Regarding the results of the muscle samples, the values are in a similar range as results from previously published papers about potassium in muscle biopsies16 or in meat samples from longissimus muscle from cattle.29, 30 The latter 2 authors used exactly the same analytical method as we did, which makes the results reasonably comparable even though postmortem samples from a different muscle group were used in their studies. However, during the preparatory work for the present study, we obtained muscle samples from the diaphragm of cows shortly postmortem at the abattoir. These results (2526 ± 103 mg/kg) did indeed differ significantly from the biopsies taken in vivo (3381 ± 453 mg/kg). It may be inferred that either the fact that carcasses instead of live animals were used for the sampling or the different locations (muscles) of the sampling had a major influence on the intracellular potassium concentrations. Johnson et al.16 used the same biopsy site as in the present study (middle gluteal muscle), however, their study was done in horses not cattle. The measurements in their 1991 study used atomic absorption spectroscopy instead of ICP‐OES, which was not available then.
Some older studies published different results when measuring intracellular potassium in muscle samples, but used dry weight for their data. For example, examination of the intracellular potassium concentration in the gluteal muscle cells of downer cows and cows with parturient paresis with x‐ray microanalysis delivered results between 12704 mg/kg and 17590 mg/kg.17 Incidentally no differences in intracellular potassium concentrations between normally calving cows and cows suffering from parturient paresis were found which is not consistent with the results of others.23
Results in a similar magnitude (between 15518 mg/kg and 17942 mg/kg) have been obtained using atomic absorption spectroscopy and semitendinosus muscle.23 Assuming that the average muscle water content is 75%, we may estimate that the values are in the same magnitude as ours, when referring them to wet weight; albeit a direct comparison may not be conducted.
It might be that the potassium content in the muscle tissue has decreased with feed intake depression, which has resulted in a reduction in cell volume in order to maintain osmolarity. In this case, wet weight muscle tissue potassium concentration might not have changed, although there was a decrease in overall intracellular potassium. As we did not measure the tissue water content in our samples, we cannot exclude this possibility. We decided to transport our muscle tissue samples at room temperature, in very small sample containers, which were tightly closed to prevent dehydration or desiccation. Although a preanalytic influence on the results cannot be completely excluded, this influence would have been the same on all samples. Therefore, storage of samples is unlikely to be the reason for the wide variation in intracellular potassium concentrations reported in the present study. The alternative would have been to freeze the samples, which also would have an impact on the sample material.
The fact that there was no correlation between serum potassium concentration, erythrocyte potassium concentration, and intracellular muscular potassium concentration, has similarly been described for horses.16 Linear and curvilinear regression were calculated separately for normokalemic and hypokalemic cows to confirm that plasma potassium concentrations have no influence on the correlation between the different compartments. Regarding red blood cells, we did expect variable results as potassium concentrations in red blood cells seem to have a wide individual variation in ruminants31, 32 and erythrocyte potassium concentrations are also influenced by different blood groups.21 It might also be considered that the results of the present study are a momentarily reflection of the potassium balance, as we only took samples at one point of time. Numerous measurements would be needed to exclude temporary fluctuations in the potassium balance. However, this would enormously increase the costs of such a study but only slightly increase the precision of the results. The hypothesis of the study that cows after parturition have a decreased amount of potassium has not been confirmed, neither in blood plasma nor in intracellular space. However, at present there are no established intracellular potassium values for cows in muscle tissue and erythrocytes, which might be an issue for further investigations. As expected, erythrocytes, albeit easily obtainable, do not provide an appropriate sample material to measure intracellular potassium concentrations. Muscle biopsy with a Bergstrom needle can be easily performed and is a valuable tool to determine intracellular potassium. In daily routine practice, extracellular potassium measurement is the easiest and quickest method to obtain information about the potassium supply. The study results confirmed that plasma potassium concentrations alone are not sufficient to evaluate the potassium balance of the whole organism in cows.
Acknowledgments
The authors thank the Austrian Association for Buiatrics and Chevita GesmbH Wels for their support.
Conflict of Interest Declaration: Authors disclose no conflict of interest.
Off‐label Antimicrobial Declaration: Authors declare no off‐label use of antimicrobials.
The study was conducted at the University Clinic for Ruminants in Vienna, and its teaching and research farm. The project was kindly supported by Chevita GmbH and the Austrian Association for Buiatrics
Footnotes
Rindastar 39 XP, H. Wilhelm Schaumann GmbH & Co KG, Brunn/Gebirge, Austria
Rindavit VK, H. Wilhelm Schaumann GmbH & Co KG, Brunn/Gebirge, Austria
Rindavit TMR 11 ASSCO, H. Wilhelm Schaumann GmbH & Co KG, Brunn/Gebirge, Austria
Monovette, Sarstedt, Nümbrecht, Germany
VetStat Electrolyte and Blood Gas Analyzer, IDEXX Laboratories, Ludwigsburg, Germany
VACUETTE® blood collection system, Greiner Bio‐One GmbH, Kremsmünster, Austria
Bergstrom biopsy needle 5 mm diameter, Walter Veterinär‐Instrumente e.K., Baruth, Germany
6 mL Procamidor 20 mg/mL, Richter pharma, Wels, Austria
Safe‐lock tubes 2.0 mL, Eppendorf AG, Hamburg, Germany
PGA RESORBA® suture material, RESORBA Medical GmbH, Nürnberg, Germany
Cyclo‐spray, Eurovet Animal Health B.V., Bladel, Netherlands
ADVIA® 2120i Hematology System with Autoslide, Siemens Healthcare CmbH, Erlangen, Germany
Vista‐PRO, Varian Inc., Agilent Technologies, Waldbronn, Germany
HNO3 Suprapur Merck KgaA, Darmstadt, Germany
Elmasonic S 30 H, Elma Schmidbauer GmbH, Singen, Germany
SOP TO_A_002 Measurement of elements in solids with ICP‐OES, IDEXX VetmedLabor, Ludwigsburg, Germany
IBM Corp. Released 2011. IBM SPSS Statistics for Windows, version 20.0. Armonk, NY: IBM Corp.
References
- 1. Schröder B, Diener M. Grundlagen der Zellphysiologie In: Engelhard W, Breves G, eds. Physiologie der Haustiere, 2nd ed Stuttgart: Enke Verlag; 2005:5–21. [Google Scholar]
- 2. Sattler N, Fecteau G. Hypokalemia syndrome in cattle. Vet Clin Food Anim 2014;30:351–357. [DOI] [PubMed] [Google Scholar]
- 3. Sweeney RW. Treatment of potassium balance disorders. Vet Clin N Am‐Food A 1999;15:609–617. [DOI] [PubMed] [Google Scholar]
- 4. Coffer NJ, Frank N, Elliot SB, et al. Effects of dexamethasone and isoflupredone acetate on plasma potassium concentrations and other biochemical measurements in dairy cows in early lactation. Am J Vet Res 2006;67:1244–1251. [DOI] [PubMed] [Google Scholar]
- 5. Sattler N, Fecteau G, Girard C, Couture Y. Description of 14 cases of bovine hypokalemia syndrome. Vet Rec 1998;143:503–507. [DOI] [PubMed] [Google Scholar]
- 6. Giebisch G. Challenges to potassium metabolism: internal distribution and external balance. Wien Klin Wochenschr 2004;116:353–366. [DOI] [PubMed] [Google Scholar]
- 7. Grünberg W, Hartmann H, Burfeind O, et al. Plasma potassium‐lowering effect of oral glucose, sodium bicarbonate and the combination thereof in healthy neonatal dairy calves. J Dairy Sci 2011;94:5646–5655. [DOI] [PubMed] [Google Scholar]
- 8. Grünberg W, Morin DE, Drackley JK, Constable PD. Effect of rapid intravenous administration of 50% dextrose solution on phosphorus homeostasis in postparturient dairy cows. J Vet Intern Med 2006;20:1471–1478. [DOI] [PubMed] [Google Scholar]
- 9. Constable P, Grünberg W, Staufenbiel R, Stämpfli HR. Clinicopathologic variables associated with hypokalemia in lactating dairy cows with abomasal displacement or volvulus. J Am Vet Med Assoc 2013;242:826–835. [DOI] [PubMed] [Google Scholar]
- 10. Ward GM. Potassium metabolism of domestic ruminants‐A Review. J Dairy Sci 1966;46:268–276. [PubMed] [Google Scholar]
- 11. Peek SF, Divers TJ, Guard C, et al. Hypokalemia, muscle weakness and recumbency in dairy cattle. Vet Ther 2000;1:235–244. [PubMed] [Google Scholar]
- 12. Goff JP. Macromineral disorders of the transition cow. Vet Clin Food Anim 2004;20:471–494. [DOI] [PubMed] [Google Scholar]
- 13. Seyrek‐Intas K, Seyrek‐Intas D, Failing K, et al. Relation between intravascular electrolyte level and course of parturition in dairy cows. Tierarztl Prax G N 2013;41:289–296. [PubMed] [Google Scholar]
- 14. Wildman EE, Jones GM, Wagner PE, et al. A dairy cow body condition scoring system and its relationship to selected production characteristics. J Dairy Sci 1982;65:495–501. [Google Scholar]
- 15. Tarnopolsky MA, Pearce E, Smith K, Lach B. Suction‐modified Bergstrom muscle biopsy technique: experience with 13500 procedures. Muscle Nerve 2011;43:717–725. [DOI] [PubMed] [Google Scholar]
- 16. Johnson PJ, Goetz TE, Foreman JH, et al. Effect of whole‐body potassium depletion on plasma, erythrocyte, and middle gluteal muscle potassium concentration of healthy, adult horses. Am J Vet Res 1991;52:1676–1683. [PubMed] [Google Scholar]
- 17. Björkman C, Jönsson G, Wroblewski R. Concentrations of sodium, potassium, calcium, magnesium and chlorine in the muscle cells of downer cows and cows with parturient paresis. Res Vet Sci 1994;57:53–57. [DOI] [PubMed] [Google Scholar]
- 18. Braselton WE, Stuart KJ, Mullaney TP, Herdt TH. Biopsy mineral analysis by inductively coupled plasma‐atomic emission spectroscopy with ultrasonic nebulization. J Vet Diagn Invest 1997;9:395–400. [DOI] [PubMed] [Google Scholar]
- 19. Grünberg W, Scherpenisse P, Dobbelaar P, et al. The effect of transient, moderate dietary phosphorus deprivation on phosphorus metabolism, muscle content of different phosphorus‐containing compounds, and muscle function in dairy cows. J Dairy Sci 2015;98:5385–5400. [DOI] [PubMed] [Google Scholar]
- 20. Grünberg W, Mol JA, Teske E. Red blood cell phosphate concentration and osmotic resistance during dietary phosphate depletion in dairy cows. J Vet Intern Med 2015;29:395–399. [DOI] [PMC free article] [PubMed] [Google Scholar]
- 21. Rasmusen BA, Tucker EM, Ellory JC, Spooner RL. The relationship between the S system of blood groups and potassium levels in red blood cells of cattle. Anim Blood Groups Biochem Genet 1974;5:95–104. [DOI] [PubMed] [Google Scholar]
- 22. Shalit U, Maltz E, Silanikove N. Water, sodium, potassium, and chlorine metabolism of dairy cows at the onset of lactation in hot weather. J Dairy Sci 1991;74:1874–1883. [DOI] [PubMed] [Google Scholar]
- 23. Kowalczyk DF, Mayer GP. Cation concentration in skeletal muscle of paretic and nonparetic cows. Am J Vet Res 1972;33:571–757. [PubMed] [Google Scholar]
- 24. Stankovic AK, Smith S. Elevated serum potassium values. Am J Clin Pathol 2004;121(Suppl 1):105–112. [DOI] [PubMed] [Google Scholar]
- 25. Zadnik T. A comparative study of the hemato‐biochemical parameters between clinically healthy cows and cows with displacement of the abomasum. Acta Vet‐Beograd 2003;53:297–309. [Google Scholar]
- 26. Steiner S, Krametter‐Frötscher R, Baumgartner W. Mechanischer Ileus beim erwachsenen Rind, eine retrospektive Studie. Wien Tierarztl Monat 2008;95:166–176. [Google Scholar]
- 27. Zurr L, Leonhard‐Marek S. Effects of β‐hydroxybutyrate and different calcium and potassium concentrations on the membrane potential and motility of abomasal smooth muscle cells in cattle. J Dairy Sci 2012;95:5750–5759. [DOI] [PubMed] [Google Scholar]
- 28. Türck G, Leonhard‐Marek S. Potassium and insulin affect the contractility of abomasal smooth muscle. J Dairy Sci 2010;93:3561–3568. [DOI] [PubMed] [Google Scholar]
- 29. Mateescu RG, Garmyn AJ, Tait RG, et al. Genetic parameters for concentrations of minerals in longissimus muscle and their associations with palatability traits in Angus cattle. J Anim Sci 2013;91:1067–1075. [DOI] [PubMed] [Google Scholar]
- 30. Garmyn AJ, Hilton GG, Mateescu RG, et al. Estimation of relationships between mineral concentration and fatty acid composition of longissimus muscle and beef palatability traits. J Anim Sci 2011;89:2849–2858. [DOI] [PubMed] [Google Scholar]
- 31. Evans JV. The stability of the potassium concentration in the erythrocytes of individual sheep compared with the variability between different sheep. J Physiol 1957;136:41–59. [DOI] [PMC free article] [PubMed] [Google Scholar]
- 32. Christinaz P, Schatzmann HJ. High potassium and low potassium erythrocytes in cattle. J Physiol 1972;224:391–406. [DOI] [PMC free article] [PubMed] [Google Scholar]