Abstract
Background
The effects of anesthesia on the equine electroencephalogram (EEG) after administration of various drugs for sedation, induction, and maintenance are known, but not that the effect of inhaled anesthetics alone for EEG recording.
Objective
To determine the effects of isoflurane and halothane, administered as single agents at multiple levels, on the EEG and quantitative EEG (qEEG) of normal horses.
Animals
Six healthy horses.
Methods
Prospective study. Digital EEG with video and quantitative EEG (qEEG) were recorded after the administration of one of the 2 anesthetics, isoflurane or halothane, at 3 alveolar doses (1.2, 1.4 and 1.6 MAC). Segments of EEG during controlled ventilation (CV), spontaneous ventilation (SV), and with peroneal nerve stimulation (ST) at each MAC multiple for each anesthetic were selected, analyzed, and compared. Multiple non‐EEG measurements were also recorded.
Results
Specific raw EEG findings were indicative of changes in the depth of anesthesia. However, there was considerable variability in EEG between horses at identical MAC multiples/conditions and within individual horses over segments of a given epoch. Statistical significance for qEEG variables differed between anesthetics with bispectral index (BIS) CV MAC and 95% spectral edge frequency (SEF95) SV MAC differences in isoflurane only and median frequency (MED) differences in SV MAC with halothane only.
Conclusions and Clinical importance
Unprocessed EEG features (background and transients) appear to be beneficial for monitoring the depth of a particular anesthetic, but offer little advantage over the use of changes in mean arterial pressure for this purpose.
Keywords: bispectral index, halothane, isoflurane
Abbreviations
- δ
delta frequency band (>0 to <4 Hz)
- θ
theta frequency band (4 to <8 Hz)
- α
alpha frequency band (8 to <13 Hz)
- β
beta frequency band (13 to <30 Hz)
- γ
gamma frequency band (>30 Hz)
- BIS
bispectral index
- CV
controlled ventilation
- ECG
electrocardiogram
- EEG
electroencephalogram
- EMG
electromyogram
- EOG
electrooculogram
- MAC
minimum alveolar concentration
- MAP
mean arterial pressure
- MED
median frequency
- qEEG
quantitative electroencephalogram
- SEF95
95% spectral edge frequency
- SR
suppression ratio
- ST
stimulation
- SV
spontaneous ventilation
The spectral data EEG findings from neurologically normal horses/ponies under inhalation anesthesia are well described.1, 2, 3, 4, 5, 6, 7, 8, 9, 10, 11, 12, 13, 14, 15, 16, 17 EEG of horses has been examined numerically, in terms of: spectral edge frequency (SEF80 or SEF95), median frequency (MED), bispectral index (BIS), amplitude (or power) in specific frequency bands, ratios between paired frequency band values, and/or total amplitude (or power). In addition to the inhaled anesthetics, injectable drugs were given for premedication and induction. Several reports suggest that in the horse it is too difficult to perform general anesthesia without the use of these drugs. One study18 reported that it took a minimum of 1 hour for the premedication and induction agent effects on the EEG to dissipate and the inhalation anesthetic effects to become apparent but, in several others, data recording was begun in 30 minutes or less after induction.3, 4, 17, 19 It is proposed that a study of the effects of isoflurane on BIS values in horses that could be performed without the use of premedication would provide a better understanding of the CNS depression caused by the anesthetic alone.20 This reasoning could also be applied to halothane. BIS is a numeric representation designed to approximate the depth of anesthesia and is based on human qEEG data that have been processed via a proprietary algorithm derived from extensive testing of memory recall during anesthesia. BIS values range from 0 (isoelectric EEG) to 100 (fully awake).21
This study was designed to address the confounding problems inherent with multiple drug administration when studying the effects of inhalant anesthetics on the EEG. It was performed under tightly controlled conditions to ensure that all data obtained were representative of each MAC multiple for every horse. Multiple physiological variables were monitored throughout each recording session using equipment that was calibrated over a wide range for each anesthetic employed.
Materials and Methods
Animals
Six neurologically normal horses (as determined by MA), between the ages of #bib9 #bib10 #bib11 years, were selected for this and the previous 2 studies.22, 23 They were housed on dry lots and provided care in accordance with an approved University of California, Davis Animal Use and Care Protocol.
Anesthesia
After an overnight fast, the horses were induced with isoflurane1 or halothane2 in O2, via face mask, as previously described.24 No premedications or other induction agents were used. With the exception of 1 horse, each horse underwent 1 study using halothane and another with isoflurane. Two sessions (1 isoflurane #bib1 halothane [in different horses]) were performed in a single day, in random sequence. One horse was euthanized after complications from a halothane study before its isoflurane study could be performed resulting in 5 datasets for isoflurane and 6 for halothane. A wash‐out period of at least 9 days took place between recordings on any given animal. Table 1 shows the schedule used for this and the previous study23 based on a Latin Square design.
Table 1.
The Latin Square based schedule used for this and the previous (sedation) study.23
| Session 1 | Session 2 | Session 3 | Session 4 | Session 5 | Session 6 | |
|---|---|---|---|---|---|---|
| Horse 1 | I | X | B | D | A | H |
| Horse 2 | B | H | X | I | D | A |
| Horse 3 | D | A | I | H | B Cn | X |
| Horse 4 | A | D | H | X | I | B Cn |
| Horse 5 | H | I | A | B | X | D |
| Horse 6 | X | B | D | A | H | I Dc |
I, isoflurane; H, halothane; X, xylazine; D, detomidine; A, acepromazine; B, butorphanol. Cn denotes that the study was cancelled and Dc denotes that the horse was deceased, so these studies were not performed. A minimum of 9 days elapsed between studies on any given horse.
Once induced, horses were intubated orotracheally with a 30‐mm‐cuffed tube and positioned in left lateral recumbency. For each session #bib3 anesthetic levels were studied #bib1.2, 1.4, and 1.6 times MAC. Absolute values for MAC were based on previous work25 (they were not determined for individual animals) and presently reported MAC multiples corresponded to end‐tidal concentrations of 1.57% #bib1.83%, and 2.10% for isoflurane and 1.06% #bib1.23%, and 1.41% for halothane. Levels were randomized by session and agent. A catheter was percutaneously placed in the right carotid artery, for intermittently monitoring PaO2, PaCO2, pHa, base balance (BB), packed cell volume (PCV), plasma protein (PP), and mean arterial blood pressure (MAP) was recorded continuously.
Equipment
For arterial blood pressure measurement, a strain‐gauge transducer,3 was used and calibrated immediately before each study against a mercury manometer. Airway pressure (Pairway) was monitored with a pressure transducer4 that had been calibrated using a water manometer. Measurements were continuously recorded on a polygraph.5 Body temperature was measured via a nasopharyngeal temperature probe calibrated with a Bureau of Standards certified thermometer.6 Inhalation anesthetic concentration was measured with an infrared gas analyzer7 after sampling of end‐tidal gases using a catheter whose end was positioned in the distal portion of the endotracheal tube. Before induction, the analyzer was calibrated using multiple standards that spanned the range of concentrations of each anesthetic planned for study and lack of machine drift was verified multiple times throughout each study. A Nihon Kohden digital EEG system8 with video was used to obtain all standard EEG recordings. In addition, a bispectral index (BIS) monitor9 was used to simultaneously acquire processed EEG data.
Electrode Placement
The skin was shaved and prepped, 16 EEG,10 3 EOG,10 2 ECG,11 2 EMG,11 and a ground electrode10 were placed as previously described.22, 23 A piezo respiratory monitor12 was taped in place over the right caudal thorax. Four additional electrodes11 were placed #bib1 each midway between the frontopolar and frontal electrodes on both the left and right, 1 between the frontal and central vertex (reference electrode), and 1 between the central and parietal vertex (ground). These electrodes were connected to the BIS monitor.
Recording Data
The EEG, ECG, EOG, EMG, and BIS data were recorded continuously throughout each session. Controlled (mechanical) ventilation (CV) was implemented to maintain a steady state (a PaCO2 between 40 and 50 mm Hg) for a minimum of 20 minutes to allow time for brain and alveolar gas concentrations to equilibrate. This was followed by a 15‐min period of spontaneous ventilation (SV) during which time alveolar anesthetic concentrations were maintained despite variability in PaCO2 values. With horses still ventilating spontaneously, right peroneal nerve stimulation13 (ST) was then performed at a rate of 1 Hz for 5 s followed by 50 Hz for 3 s. This cycle was repeated at each of the 3 MAC levels at each of the 3 conditions (CV, SV, and ST) for each anesthetic agent with the exception of the first session which did not include ST. Arterial blood pressure and airway pressure were recorded continuously. Blood sample analyses were performed with an automated blood gas analyzer.14 26 They were measured twice for each MAC level, once during CV and again during SV. The blood gas analyzer was calibrated using multiple certified gases.
Data Analysis
Four consecutive 10‐s epochs of EEG were selected at each of the following times: (1) before termination of CV, (2) near the end of the SV period, and (3) during the stimulation period. Epochs were visually examined using a transverse bipolar montage. By applying fast Fourier transform analysis (FFT),15 absolute power (in μV2) in each frequency band (δ, θ, α, β, γ) were obtained for the following derivations: left frontal to frontal vertex (F3–Fz), frontal vertex to right frontal (Fz–F4), left aural to left central (A1–C3), and right central to right aural (C4–A2). The 4 10‐s epochs were averaged. Total power (all bands combined) was calculated from these averaged data. The BIS monitor was used to collect BIS, SEF95, MED, and SR values from the left‐sided and right‐sided derivations, as well as, the combined data.
For statistical purposes mixed effects linear regression analyses were performed to examine the fixed effects of MAC on the electrical measurements. The Bonferroni method was utilized for post hoc analyses. All analyses were performed using Stata IC/12 (StatCorp LP, College Station, TX). Statistical significance was set at P < .05.
Results
Recording length varied, for isoflurane #bib1: #bib9 #bib10 #bib11 :06 (hours:minutes, mean 1:52) and for halothane, from 1:32 to 1:56 (mean 1:47). Combined mean total power, for the A1–C3 derivation, across all MAC levels and conditions, was 303 μV2 for isoflurane and 148 μV2 for halothane. The difference was highly significant (P < .001).
For both agents, peak inspiratory pressure ranged from 18–21 mmH2O during CV. Non‐EEG values were within physiological limits and similar to previously published results from studies using similar anesthetic conditions.24, 25, 27, 28
Isoflurane
Qualitatively, isoflurane EEG findings were variable between horses. Differences between each of the 4 10‐s segments on a given animal were common. At 1.2 MAC with CV, periods of burst suppression (EEG voltage <20 μV) were seen only in the recording from horse #4 (Fig 1). In all horses, sharp waves were present in the EEG. These were often followed by brief (≤1 second) periods of voltage attenuation. The majority of these sharp waves corresponded temporally to high amplitude (90 μV), quasiperiodic sharp waves recorded by the EOG channels. Occasional spikes and spike‐and‐slow wave events were also seen. These paroxysmal discharges were not recorded in EOG channels during attenuation periods and their related EEG events were variable (Fig 1). Horse #1 had the most homogeneous EEG background pattern despite having consistent sharp waves in all channels (Fig 2). After switching to SV there was a loss of burst suppression in horse #4 and fewer sharp waves in the EEGs of all horses. Muscle artifact appeared in the EEG and EOG channels, but it was limited to the right (up) side. Horses showed no change in EEG pattern between the SV and ST periods.
Figure 1.
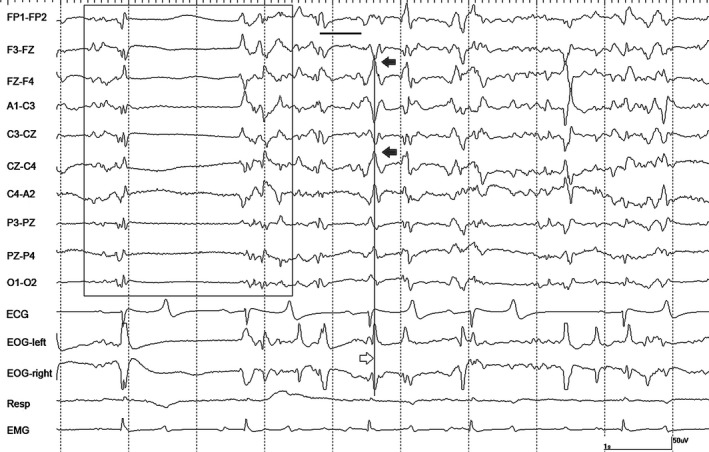
A period of burst suppression (boxed) in horse #4 during isoflurane anesthesia at 1.2 MAC during controlled ventilation. Numerous sharp waves (filled arrows in EEG channels, open arrow in EOG tracings) several associated with voltage attenuation (thick horizontal line), are also present. Gain calibration is shown for EEG and EOG tracings only, others vary. The squaring off of some events recorded in EOG channels, denotes they are outside the dynamic range of the amplifiers.
Figure 2.
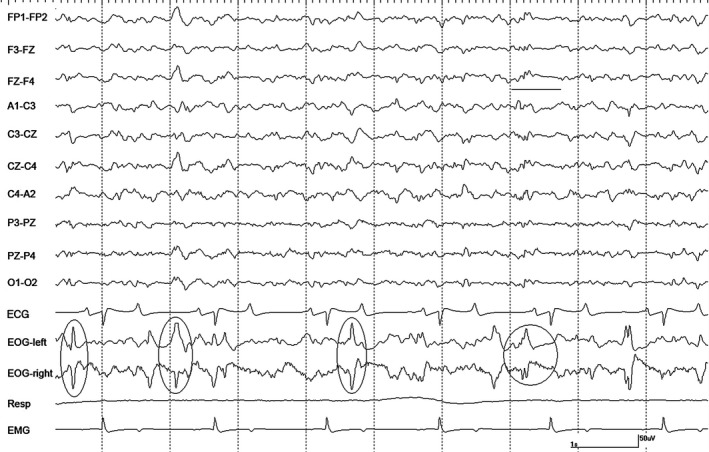
A segment of EEG from horse #1 with isoflurane at 1.2 MAC during controlled ventilation. Sharp waves are evident in the EOG channels (ovals) that occasionally correspond to EEG events followed by a period of voltage attenuation (circled and underlined). Gain calibration is shown for EEG and EOG tracings only, others vary. The squaring off of some events recorded in EOG channels, denotes they are outside the dynamic range of the amplifiers.
Increasing the isoflurane level to 1.4 MAC with CV resulted in an increase in sharp waves with attenuation as compared to 1.2 MAC CV. Burst suppression was present in recordings from all horses. Changing to SV again resulted in fewer sharp waves and less burst suppression. Mild differences were observed during the ST phase in horse #4 only, paradoxically demonstrated by more sharp waves with attenuation and burst suppression. Analyses of total power found significant differences between 1.2 MAC and 1.4 MAC.
Changes noted with an increase to 1.6 MAC CV (as compared to 1.4 MAC CV) showed slight increases in the number of sharp waves with attenuation and burst suppression in most horses. The EEG changes associated with SV were fewer sharp waves with attenuation and less burst suppression with shorter suppression periods in all but horse #4 who's EEG did not change. During ST, changes were variable across horses with minor changes in the amount of burst suppression.
Total power values for isoflurane varied widely over the derivations studied, so statistical analyses were repeated using the A1–C3 derivation only. For MAC, significant differences were found between (1) 1.2 and 1.4, and (2) 1.2 and 1.6 for CV only. Analysis of absolute power by frequency band are shown in Fig 3 for CV. For SV and ST, significant differences were found between 1.2 and 1.6 MAC for θ and 1.4 and 1.6 MAC for γ, respectively. Results for the remaining qEEG are displayed in Table 2. Suppression ratio (SR) values were variable but were representative of what was observed in the unprocessed EEG. There were too few data points for this parameter to test the statistical significance. Individual BIS data are displayed in Appendix 1. Non‐EEG data for isoflurane are displayed in Table 3. Analysis of isoflurane MAP values showed significant differences between MAC levels with the exception of 1.2 and 1.4 for CV, all levels for SV and between 1.2 and 1.6 only for ST.
Figure 3.
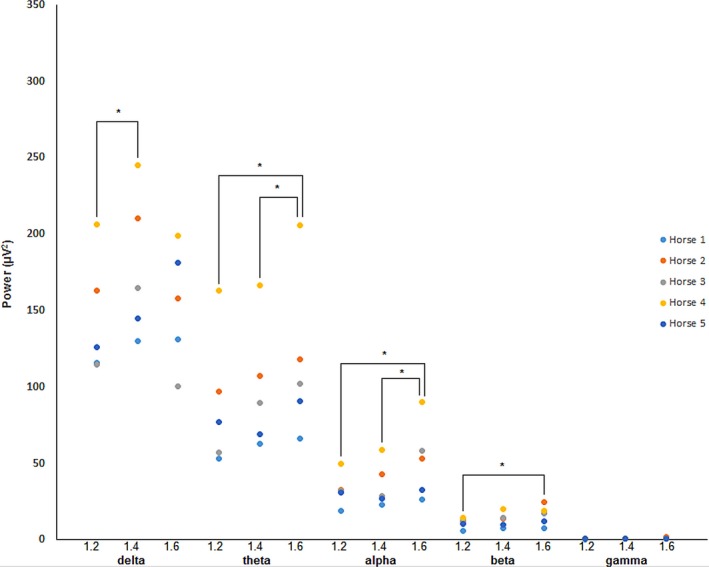
Absolute spectral power data for isoflurane at 1.2 #bib1.4, and 1.6 MAC. Data were obtained during periods of controlled ventilation. All data were taken from the A1–C3 derivation. *Denotes statistical significance between data pairs.
Table 2.
Isoflurane bispectral index (BIS), median frequency (MED) and 95% spectral edge frequency (SEF95) data for each MAC level and each condition. All values are from combined data (both left and right sides)
| Iso MAC Condition | 1.2 CV | SV | ST | 1.4 CV | SV | ST | 1.6 CV | SV | ST |
|---|---|---|---|---|---|---|---|---|---|
| BIS | |||||||||
| Mean | 66.09 | 70.25 | 74.19 | 72.04 a | 71.85 | 71.67 | 56.50 a | 66.31 | 65.69 |
| SD | 6.70 | 11.93 | 10.73 | 3.60 | 9.76 | 10.22 | 16.92 | 8.55 | 10.40 |
| MED | |||||||||
| Mean | 3.47 | 3.23 | 3.35 | 3.47 | 3.22 | 3.36 | 3.61 | 3.48 | 3.16 |
| SD | 0.40 | 0.29 | 0.19 | 0.26 | 0.31 | 0.28 | 0.24 | 0.38 | 0.65 |
| SEF95 | |||||||||
| Mean | 11.78 | 10.75 bc | 11.26 | 12.00 | 11.47 b | 11.02 | 12.33 | 11.44 c | 10.97 |
| SD | 1.35 | 1.53 | 0.85 | 0.40 | 1.41 | 1.14 | 0.83 | 1.30 | 1.47 |
| SR | |||||||||
| Mean | 3.55 | 0 | 0 | 1.87 | 0 | 0 | 8.01 | 8.82 | 6.29 |
| SD | – | – | – | 1.44 | – | – | 10.60 | 8.58 | 6.95 |
SR, suppression ratio; CV, controlled ventilation; SV, spontaneous ventilation; ST, stimulation. Matching letters denote statistical significance between datasets.
Table 3.
Isoflurane physiological monitoring values
| Iso MAC Condition | 1.2 CV | SV | ST | 1.4 CV | SV | ST | 1.6 CV | SV | ST |
|---|---|---|---|---|---|---|---|---|---|
| PaO2 | |||||||||
| Mean | 367.8 | 328.0 | 348.4 | 296.8 | 353.4 | 259.4 | |||
| SD | 184.6 | 145.7 | 179.2 | 162.0 | 165.8 | 117.3 | |||
| PaCO2 | |||||||||
| Mean | 45.2 | 77.4 | 45.4 | 83.0 | 44.6 | 82.2 | |||
| SD | 2.8 | 15.9 | 2.5 | 19.4 | 1.8 | 15.6 | |||
| pHa | |||||||||
| Mean | 7.41 | 7.25 | 7.41 | 7.22 | 7.41 | 07.23 | |||
| SD | 0.04 | 0.08 | 0.03 | 0.09 | 0.03 | .07 | |||
| BB | |||||||||
| Mean | 4.0 | 5.0 | 3.8 | 5.4 | 3.6 | 5.4 | |||
| SD | 2.6 | 1.4 | 1.6 | 1.3 | 1.7 | 0.9 | |||
| PCV | |||||||||
| Mean | 34.9 | 38.5 | 35.5 | 40.3 | 36.0 | 40.9 | |||
| SD | 4.0 | 6.0 | 4.7 | 5.2 | 3.4 | 4.9 | |||
| PP | |||||||||
| Mean | 6.9 | 7.0 | 6.9 | 7.0 | 6.9 | 7.0 | |||
| SD | 0.5 | 0.6 | 0.6 | 0.6 | 0.6 | 0.6 | |||
| Temp | |||||||||
| Mean | 36.8 | 36.8 | 36.8 | 36.9 | 36.9 | 36.8 | |||
| SD | 0.7 | 0.8 | 0.7 | 0.8 | 0.8 | 0.8 | |||
| MAP | |||||||||
| Mean | 72 | 97 | 89 | 71 | 89 | 86 | 57 | 77 | 81 |
| SD | 11 | 12 | 7 | 14 | 7 | 6 | 15 | 11 | 11 |
| HR | |||||||||
| Mean | 34 | 37 | 34 | 34 | 38 | 38 | 34 | 38 | 38 |
| SD | 5 | 10 | 5 | 3 | 7 | 6 | 4 | 4 | 5 |
PaO2, arterial partial pressure of oxygen in mmHg; PaCO2, arterial partial pressure of carbon dioxide in mmHg; pHa, arterial blood pH; BB, base balance in mEq/L; PCV, packed cell volume in %; PP, plasma protein in g/L; Temp, body temperature in °C; MAP, mean arterial pressure in mmHg; HR, heart rate in beats/minute.
Halothane
Three horses did not recover from this anesthesia, all were Quarter horse geldings. One horse died of malignant hyperthermia29 and the second luxated the metatarsophalangeal joint during recovery and was euthanized. These horses were replaced early in the study. The last horse was euthanized after developing a severe bilateral triceps myopathy late in the project resulting in one less horse for the isoflurane and sleep studies.22
Recordings at 1.2 MAC with CV were variable. Moderate amplitude slow waves were the primary feature in recordings from 2 horses, as well as, occasional sharp waves noted in the EOG channels (Fig 4). These sharp waves were occasionally associated with events in the EEG channels but no attenuation/suppression periods were observed. Intermittent α bursts were common in recordings from all horses (Fig 5). Two horses had nystagmus in rostral channels on a background that was low amplitude and high frequency with superimposed intermittent rhythmic beta (Fig 6). The switch to SV resulted in the appearance of right‐sided muscle artifact and rhythmic beta in horse #1. There were no changes seen in 2 horses, an increase in the number of sharp waves and background slowing were noted in the others. Stimulation resulted in a loss of background slowing and the transient appearance of nystagmus in most horses. Generalized movement occurred shortly after the onset of tetanic stimulation in horse #3, but stopped 15 seconds later.
Figure 4.
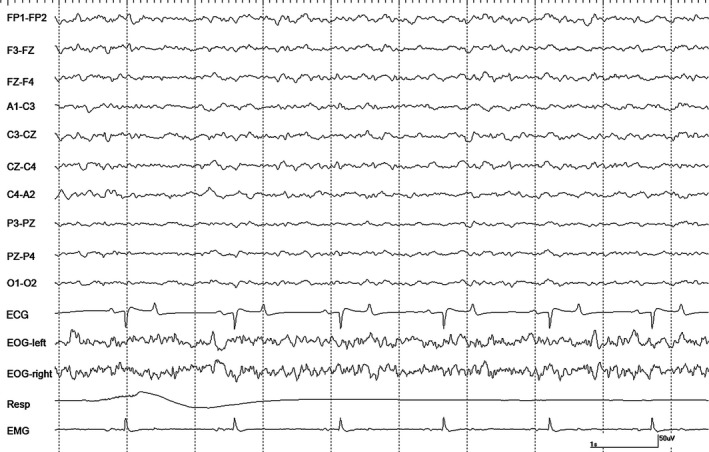
An epoch of EEG from horse #1 during halothane anesthesia at 1.2 MAC during controlled ventilation. Gain calibration is shown for EEG and EOG tracings only, others vary.
Figure 5.
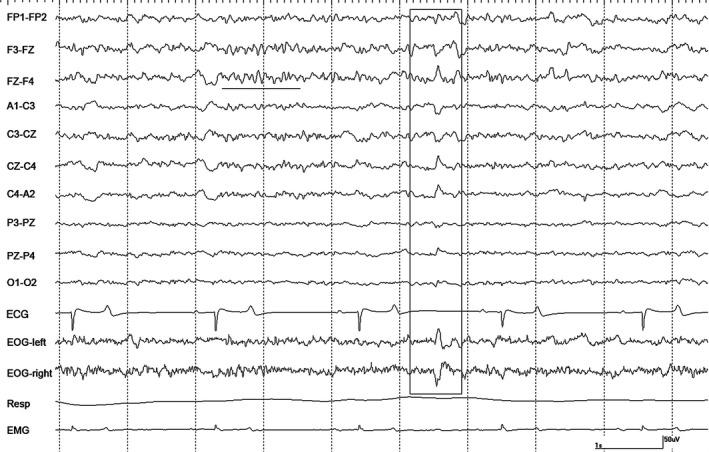
A period of α activity (underlined) and a sharp wave (boxed) in horse #2 during halothane anesthesia at 1.2 MAC with controlled ventilation. Gain calibration is shown for EEG and EOG tracings only, others vary.
Figure 6.
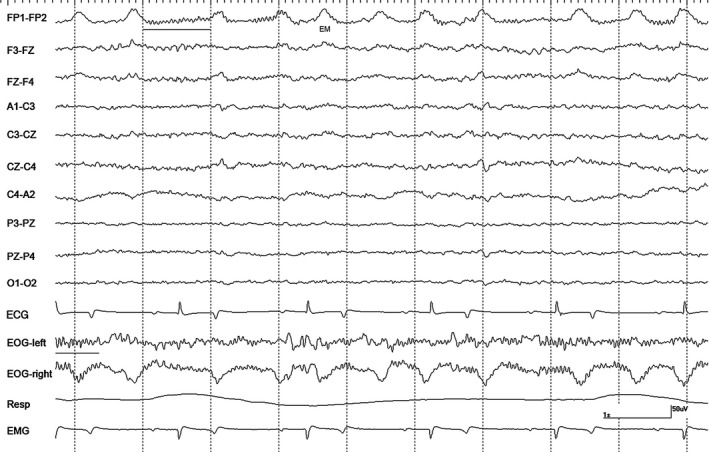
Intermittent bursts of rhythmic β activity (underlined) with nystagmus in horse #3 during halothane anesthesia at 1.2 MAC during controlled ventilation. EM = eye movement. Gain calibration is shown for EEG and EOG tracings only, others vary.
Comparing 1.4 MAC with CV to at 1.2 MAC (also with CV) the EEG findings were variable, ranging from little or no difference to an increase in slowing and sharp waves in most horses. Rhythmic beta was noted in 2 horses. Switching to SV had no effect on 2 horses. It resulted in an increase in sharp waves in 1 horse, but a decrease in sharp waves in another and an increase in slowing in a third horse. With ST, a decrease in slow activity was seen in most horses with nystagmus present in 2. The only finding in horse #4 was a decrease in the number of sharp waves.
An increase to 1.6 MAC resulted in variable changes between horses. A decrease in sharp waves was noted in 1 horse, whereas an increase in these events was seen in another. Rhythmic beta was recorded from 2 horses with no changes seen in a third. A decrease in slow activity and the presence of rhythmic beta was noted in 1 horse after changing to SV. Another had an increase in slow activity and the number of sharp waves with rhythmic beta appearing in another. In the remaining 3 horses, no changes were observed with SV. With tetanic ST #bib1 horse had a burst of rhythmic theta and a transient decrease in slow activity (Fig 7). No response to ST was detected in 3 horses. Two others had a loss of slow wave activity which progressed to nystagmus in one.
Figure 7.
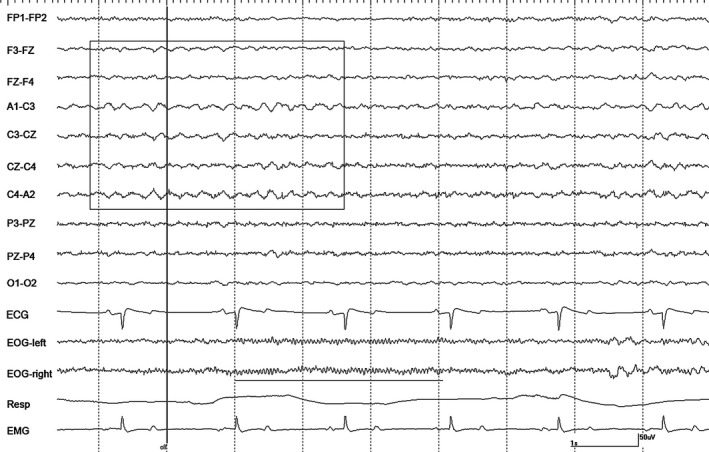
A burst of rhythmic θ activity (boxed) and rhythmic β activity (underlined) in horse #1 associated with the cessation of tetanic stimulation (vertical line/off) during halothane anesthesia at 1.6 MAC during spontaneous respiration. Gain calibration is shown for EEG and EOG tracings only, others vary.
Total power values for halothane varied widely over the derivations studied, so statistical analyses were repeated using the A1‐C3 derivation only. For MAC, significant differences were found between (1) 1.2 and 1.4 and (2) 1.2 and 1.6 for CV only. Analysis of absolute power by frequency band are shown in Fig 8 for CV. For SV and ST, a significant difference was found between 1.2 and 1.6 MAC for β in the former only. Review of qEEG data for halothane found no significant differences in BIS‐left and BIS‐right, so combined BIS (BIS‐both) data were used for all statistical analyses. Results for the remaining qEEG are displayed in Table 4. Individual BIS data are displayed in Appendix 2. Non‐EEG data for halothane are displayed in Table 5. Analysis of halothane MAP values found significant differences between: (1) 1.2 MAC, and (2) 1.6 MAC with CV. Consistent with the raw data findings, SR was 0 for the duration of each halothane recording.
Figure 8.
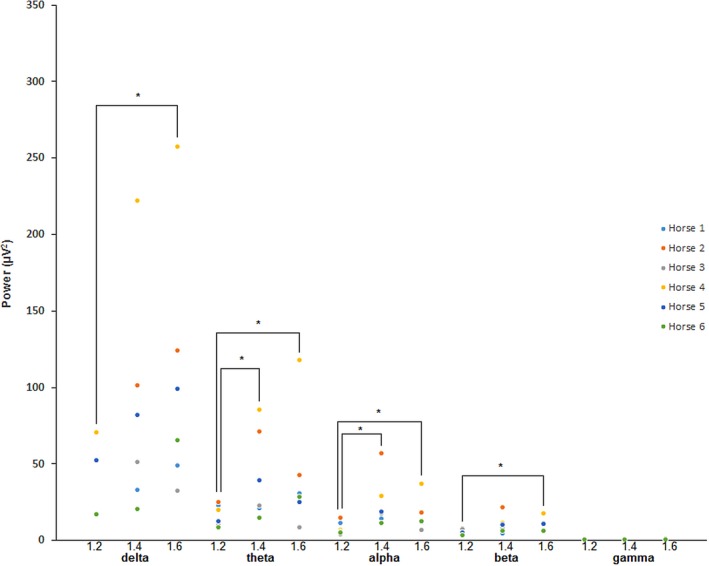
Absolute spectral power data for halothane at 1.2 #bib1.4, and 1.6 MAC. Data were obtained during periods of controlled ventilation. All data were taken from the A1–C3 derivation. *Denotes statistical significance between data pairs.
Table 4.
Halothane bispectral index (BIS), median frequency (MED), and 95% spectral edge frequency (SEF95) data for each MAC level and each condition. All values are from combined data (both left and right sides)
| Hal MAC Condition | 1.2 CV | SV | ST | 1.4 CV | SV | ST | 1.6 CV | SV | ST |
|---|---|---|---|---|---|---|---|---|---|
| BIS | |||||||||
| Mean | 76.82 | 66.94 | 71.57 | 77.48 | 67.43 | 73.07 | 76.12 | 75.00 | 73.99 |
| SD | 11.95 | 8.51 | 7.88 | 9.65 | 8.08 | 7.16 | 6.79 | 8.84 | 9.67 |
| MED | |||||||||
| Mean | 3.47 | 2.68 a | 2.94 | 3.55 | 3.17 | 3.92 | 4.22 | 3.58 a | 3.59 |
| SD | 0.84 | 0.76 | 0.64 | 0.52 | 0.29 | 0.88 | 1.66 | 0.39 | 0.51 |
| SEF95 | |||||||||
| Mean | 16.35 | 12.49 | 15.46 | 14.95 | 13.50 | 15.79 | 15.63 | 15.44 | 16.18 |
| SD | 3.18 | 3.86 | 2.90 | 2.72 | 2.06 | 1.80 | 3.16 | 3.21 | 3.27 |
| SR | |||||||||
| Mean | 0 | 0 | 0 | 0 | 0 | 0 | 0 | 0 | 0 |
| SD | – | – | – | – | – | – | – | – | – |
SR, suppression ration; CV, controlled ventilation; SV, spontaneous ventilation; ST, stimulation. Matching letters denote statistical significance between datasets.
Table 5.
Halothane physiological monitoring values
| Hal MAC Condition | 1.2 CV | SV | ST | 1.4 CV | SV | ST | 1.6 CV | SV | ST |
|---|---|---|---|---|---|---|---|---|---|
| PaO2 | |||||||||
| Mean | 425.7 | 333.5 | 391.2 | 292.3 | 399.8 | 267.2 | |||
| SD | 149.8 | 114.4 | 133.8 | 119.8 | 147.1 | 108.3 | |||
| PaCO2 | |||||||||
| Mean | 41.3 | 65.5 | 44.0 | 66.3 | 43.5 | 69.3 | |||
| SD | 4.2 | 3.6 | 2.8 | 4.3 | 2.4 | 1.6 | |||
| pHa | |||||||||
| Mean | 7.42 | 7.28 | 7.40 | 7.28 | 7.39 | 7.26 | |||
| SD | 0.03 | 0.02 | 0.02 | 0.02 | 0.01 | 0.02 | |||
| BB | |||||||||
| Mean | 2.2 | 3.8 | 2.3 | 3.7 | 2.3 | 3.7 | |||
| SD | 1.5 | 1.2 | 3.1 | 2.2 | 1.9 | 1.5 | |||
| PCV | |||||||||
| Mean | 42.0 | 43.9 | 41.8 | 45.3 | 42.3 | 45.7 | |||
| SD | 4.9 | 5.0 | 2.8 | 3.8 | 4.8 | 5.0 | |||
| PP | |||||||||
| Mean | 6.7 | 6.7 | 6.5 | 6.6 | 6.6 | 6.6 | |||
| SD | 0.5 | 0.5 | 0.5 | 0.5 | 0.5 | 0.5 | |||
| Temp | |||||||||
| Mean | 37.2 | 37.2 | 37.2 | 37.2 | 37.1 | 37.2 | |||
| SD | 0.6 | 0.7 | 0.4 | 0.5 | 0.5 | 0.6 | |||
| MAP | |||||||||
| Mean | 87 | 100 | 96 | 81 | 98 | 97 | 72 | 91 | 87 |
| SD | 20 | 19 | 12 | 24 | 26 | 21 | 20 | 24 | 22 |
| HR | |||||||||
| Mean | 34 | 36 | 35 | 35 | 38 | 37 | 37 | 38 | 37 |
| SD | 3 | 3 | 3 | 4 | 5 | 5 | 5 | 3 | 3 |
PaO2, arterial partial pressure of oxygen in mmHg; PaCO2, arterial partial pressure of carbon dioxide in mmHg; pHa, arterial blood pH; BB, base balance, in mEq/L; PCV, packed cell volume in %; PP, plasma protein in g/L; Temp, body temperature in °C; MAP, mean arterial pressure in mmHg; HR, heart rate in beats/minute.
For comparison to the spectral data for isoflurane and halothane (Figs 3 and 8), natural sleep data from a previous study22 involving the same horses, are displayed in Fig 9.
Figure 9.
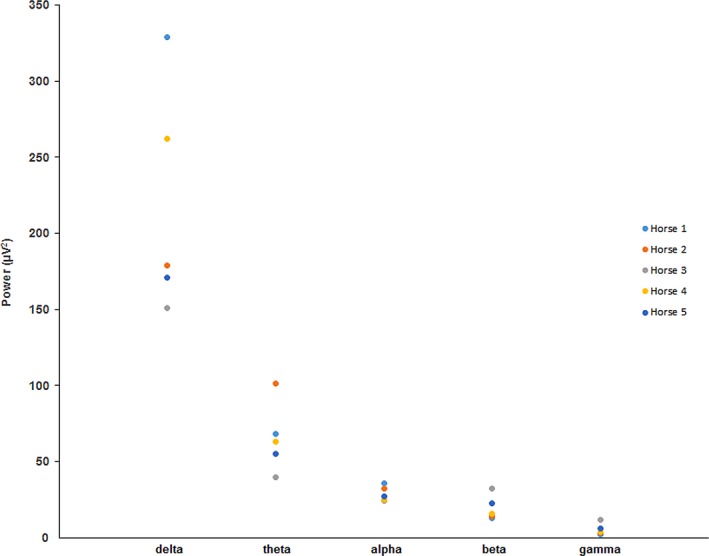
Absolute spectral power data for slow wave sleep. Data were taken from the A1–C3 derivation.
Discussion
The EEG findings of this study show that there are differences between the effects of isoflurane and halothane on cerebral activity in the horse. Isoflurane was associated with periods of suppression in all horses at 1.4 and 1.6 MAC and in 1 horse at 1.2 MAC. These findings were substantiated by the SR data. Suppression was not seen in any of the recordings involving halothane, a finding consistent with previous reports.8, 18 This was also evident in the qEEG (all SR values were 0). There are differences in total amplitude between the 2 anesthetics (halothane < isoflurane).1, 2 In the present study that was also the case for total power (amplitude squared), with isoflurane power double that of halothane (P < .001). This was also evident in the spectral data whereby, each frequency band had less power for halothane than for isoflurane (Figs 3, 8).
Similarities were also noted between the 2 anesthetics. The appearance of sharp waves was a common finding in both (amplitudes were higher in EOG leads likely as the result of the increase in distance between electrodes [nearly 4 times that between most pairs of EEG electrodes]). These events were similar in distribution and polarity. The presence of sharp waves associated with either agent suggested a deeper plane of anesthesia and were more consistent with controlled ventilation (CV). The disappearance of these events, implied a decrease in the level of CNS depression, as was often the case with SV and ST. With isoflurane, the sharp waves appeared to be precursors of burst suppression, as they were often associated with a subsequent period of EEG voltage attenuation. However, these events recorded during halothane anesthesia were not followed by a similar decrease in the amplitude of background activity so their significance is unknown.
Criteria used to identify states of vigilance are based on a combination of EEG findings and behavior22, 23, but with the use of general anesthesia, these criteria could not be applied. However, some of the EEG findings during isoflurane and halothane anesthesia did appear similar to those that occur naturally22 and with the use of the sedatives.23 The background activity in Fig 2 (isoflurane) has the appearance of natural SWS, as does that shown in Fig 4 (halothane). Events resembling vertex sharp waves and sleep spindles can be seen in Figs 2 and 5, respectively. Comparisons between halothane‐induced spindles and those recorded during natural sleep in the cat suggest that the same cholinergic pathways modulate both types.30 Spindling was also previously reported in dogs during halothane anesthesia.31 The rhythmic θ activity seen with tetanic stimulation during halothane (Fig 7) appears identical to that seen during drowsiness and REM sleep,22 thus might be related to hippocampal activity. The rhythmic β activity associated with halothane, while similar in distribution (frontopolar) to that reported with the use of α2 agonists, was not identical. Frequencies were slower #bib16–22 Hz for halothane compared to 28–32 Hz for α2 agonists.23
Derived initially only from specific features of the human EEG (including changes in beta and delta content [the bispectrum]), the BIS is a dimensionless number.32 The original algorithm was later modified after extensive testing of memory recall in human research subjects under examination.33 Reducing the likelihood of intraoperative awareness (which can result in post‐traumatic stress disorder) while minimizing the amount of anesthetic required (leading to reductions in recovery time) were the objectives behind its development.34 This 2004 report summarized the findings of 21 human studies which examined whether BIS monitoring was successful in meeting these goals. Their conclusion was that it did not work reliably in all cases. They did report that it was useful for identifying an alert state, a finding contradicted in a recent publication which examined BIS values from awake subjects after neuromuscular blockade.35 Another study determined that maintaining BIS values within a particular range was no better than doing the same with MAC values in preventing intraoperative awareness or at reducing the amount of volatile anesthetic used.36 With BIS reliability in question in the species it was designed for, its use in other species may be limited to examining less subtle changes in cerebral function. To date, BIS applications in veterinary medicine have had mixed results.20, 37, 38, 39
One study13 used wakefulness, and detomidine/butorphanol sedation with which to compare the BIS values obtained during isoflurane anesthesia in horses. They found that there were no significant differences between the sedation and anesthetic BIS values, but both were much lower than those recorded before drug administration. The most plausible explanation for these results is that detomidine induced SWS in all horses that was quantitatively indistinguishable from the slowing related to isoflurane administration. A 2006 report40 also concluded that detomidine administered alone or in combination with butorphanol resulted in qEEG findings suggestive of sleep in horses. In comparing the spectral data from a previous report of sleep in the same horses described here22, there was more absolute power in the delta band during SWS than in any of the 3 MAC levels for isoflurane (Figs 3, 9) despite similar values for total power (SWS = 338 μV2, isoflurane = 303 μV2). Isoflurane was associated with more power in theta and alpha bands than SWS, but beta and gamma power was higher in SWS than isoflurane.
In one human study, BIS was used to evaluate the depth of sleep.41 The conclusion was that it was a reliable indicator for this purpose. Furthermore, the changes associated with increasing depth of sleep mimicked those seen with increasing depth of general anesthesia. Several recent publications describe the similarities among EEG findings obtained during natural sleep and general anesthesia in other species.42 One report also includes the comatose state in these comparisons.43 There is evidence to support the theory that general anesthesia can substitute for sleep. Isoflurane has been reported to reduce the SWS debt (deficit) in a sleep‐deprived rat model,44 whereas propofol is thought to reduce both SWS and REM sleep debt in a similar model.45
Previous attempts to correlate changes in qEEG parameters to alterations in cerebral responsiveness during general anesthesia in the horse have had mixed results.1, 2, 3, 4, 5, 6, 7, 8, 9, 10, 11, 12, 13, 14, 15, 16, 17 A number of these studies involved surgical stimulation,1, 2, 4, 7, 14 whereas others were concerned with the effects of additional drugs that were administered.6, 9, 10, 11, 15, 17 All involved the use of anesthetic premedications and induction agents in addition to inhalant anesthetics. Techniques varied in regard to electrode placement, duration of wash‐out period, and a number of studies included concurrent auditory stimulation6, 8, 9, 10, 11, 15 making direct comparisons between studies difficult.
In this study qEEG findings were also mixed. Some findings appeared to highlight changes better than others, such as, the differences in theta and alpha power for both anesthetics. Some values were not consistent across MAC levels, BIS for isoflurane was higher at 1.4 MAC than 1.2 MAC (the opposite of what is expected). MED results conflicted between agents with a significant difference for halothane and not for isoflurane. However, halothane MED values increased at higher MAC levels, the reverse of what would be expected. The variation in MAC levels used here were relatively narrow, it is possible that more significance could be found with greater differences between levels.
On an individual basis, findings were quite variable. Nystagmus was common at halothane 1.2 MAC but tended to affect the eye contralateral to the recumbent side. Muscle artifact was more pronounced in this side as well, presumably the weight of the head resting on them prevented contraction of muscles on the downside. One group5 chose to record only from lower electrodes (regardless of position), likely for this reason. Another46 did not mention how their horses were positioned, but based on the presence of muscle artifact only in derivations involving the right hemisphere, left lateral recumbency is suspected.
The concept of MAC was first introduced in the early 1960s as a way to compare the potency of 2 different inhalation anesthestics.30 It is based on the anesthetic concentration needed to prevent purposeful movement in response to a noxious stimulus. By convention, a MAC of 1.0 will block this activity in 50% of the animals so stimulated. Calculated via end tidal partial pressure for a given agent at equilibrium, this measurement represents the concentration in arterial blood and the central nervous system. In their report on dogs, EEG changes were noted with increased anesthetic depth, but varied between agents so were considered unreliable for comparison purposes.30
The effects of 4 anesthetic agents on the unprocessed EEG were detailed in 1 report18. For halothane and isoflurane, they described findings that are very similar to those reported here. They used a wider range of MAC levels (1.0 #bib1.5 and 2.0 times MAC), but they adjusted for the use of premedications and induction agents by using lower MAC values #bib0.98% for isoflurane, and 0.70% for halothane (both MAC 1.0). Isoflurane findings were described as ‘spikes or sharp waves alternating with suppression periods’.18 They concluded that EEG would be more useful for monitoring isoflurane anesthesia than halothane anesthesia but only as an accompaniment to the standard monitoring parameters of ECG and MAP. The present study also demonstrated changes in the latter, as most isoflurane MAP values were significantly different by MAC level and some halothane values also differed.
Although challenging in horses,24 mask induction with inhaled anesthetics permits unequivocal identification and analysis of the EEG effects that can be attributed to the anesthetic alone, without the potential confounding effects of other pharmacological agents administered before or during the EEG recording period. The present study demonstrated that considerable variability exists in EEG findings between horses at identical MAC levels of anesthesia. All EEG findings could be attributed solely to the inhaled anesthetics studied in these horses. This study confirmed that isoflurane and halothane have different effects on cerebral activity. Burst suppression patterns were common with isoflurane, but absent during halothane anesthesia. However, intermittent activity, consisting of transient bursts in the α, θ, or β frequency bands, were seen during halothane anesthesia but were not apparent with the use of isoflurane. The latter agent was also associated with twice the EEG total power of the former. The qEEG parameters (BIS, SEF95, MED, spectral data, total power) may provide additional information beneficial to anesthetic monitoring in the horse, but their value appears to be limited.
Acknowledgments
Grant support: This research was funded by the Center for Equine Health with funds provided by the Oak Tree Racing Association, the State of California Pari‐mutuel Fund, and contributions by private donors. It was also supported by the Clinical Electrophysiology Laboratory at the William R. Pritchard Veterinary Medical Teaching Hospital. The authors thank Mr. Vince Long, Mr. Ramon Cervantes, Mr. Don Hurmes, Mr. Richard Morgan, Dr. Ayako Imai, and Mr. John Doval, for technical assistance. We would also like to thank Aspect Medical Systems for their generous loan of a BIS monitor. Submitted in partial satisfaction of the requirements for the degree of Doctor of Philosophy in Comparative Pathology in the Office of Graduate Studies of the University of California, Davis.
Conflict of Interest Declaration: Authors disclose no conflict of interest.
Off‐label Antimicrobial Declaration: Authors declare no off‐label use of antimicrobials.
Appendix 1.
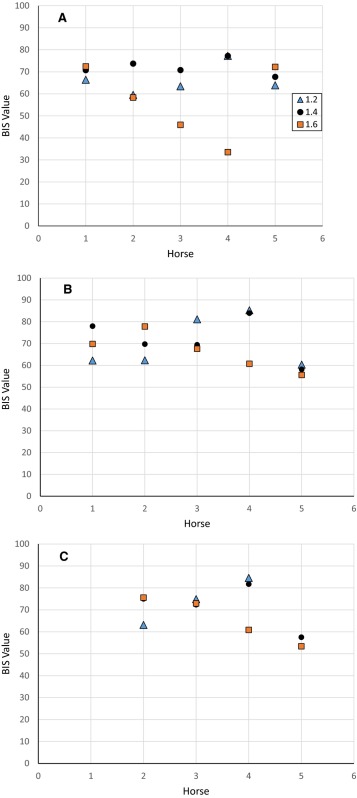
Individual combined mean bispectral index (BIS‐both) values for isoflurane over a 40‐s period for each anesthetic level (1.2 #bib1.4, and 1.6 MAC) during controlled ventilation (A), spontaneous ventilation (B), and common peroneal nerve stimulation (C). Missing data points in C were the result of no stimulation data for horse #1 and technical problems in horse #5. Horse #6 was deceased, thus had no data for all 3 conditions.
Appendix 2.
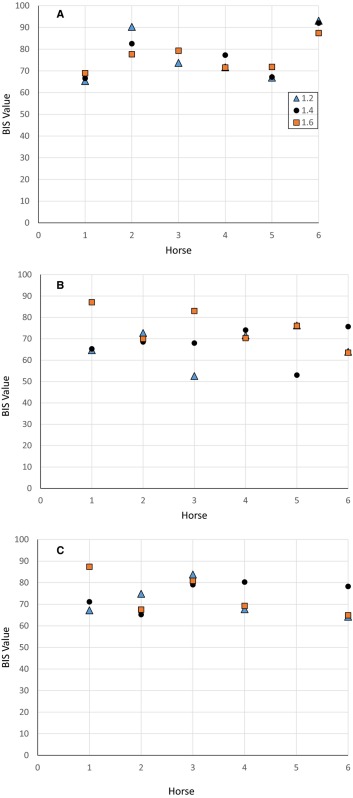
Individual combined mean bispectral index (BIS‐both) values for halothane over a 40‐s period for each anesthetic level (1.2 #bib1.4, and 1.6 MAC) during controlled ventilation (A), spontaneous ventilation (B), and common peroneal nerve stimulation (C). Missing data points in C were the result of no stimulation for horse #5.
This study was performed at the Center for Equine Health, School of Veterinary Medicine, University of California at Davis.
Footnotes
Forane/AErrane, Anaquest, Madison, WI
Flouthane, Ayerst Laboratories Inc, New York, NY
Model P23D, Statham Division, Mark IV Industries, Oxnard, CA
Model PM131TC, Statham Division, Mark IV Industries, Oxnard, CA
Grass Model 7D, Staham Medical Instruments, Hato Rey, Puerto Rico
Yellow Springs Instrument Co, Yellow Springs, OH
LB2, Sensormedics Corp, Anaheim, CA
Neurofax 2110, Nihon Kohden America Inc, Foothill Ranch, CA
BIS Monitor, Aspect Medical Systems, Norwood, MA
F‐E5GH‐120, Grass/Astro‐Med, West Warwick, RI
F‐E2‐120, Grass/Astro‐Med, West Warwick, RI
1497, Nihon Kohden America, Inc, Foothill Ranch, CA
Ministim MS‐1B, Life‐Tech Inc, Stafford, TX
ABL5, Radiometer America Inc., Westlake, OH
Multiview, Nihon Kohden America, Inc, Foothill Ranch, CA
References
- 1. Otto K, Short CE. Cerebral responses in horses to halothane and isoflurane anesthesia: EEG power spectrum analysis and differences in arteriovenous oxygen content. Vet Anaesth Analg 1991;18(S1):85–99. [Google Scholar]
- 2. Ekström PM, Short CE, Geimer TR. Electroencephalography of detomidine‐ketamine‐halothane and detomidine‐ketamine‐isoflurane anesthetized horses during orthopedic surgery: A comparison. Vet Surg 1993;22:414–418. [DOI] [PubMed] [Google Scholar]
- 3. Johnson CB, Young SS, Taylor PM. Analysis of the frequency spectrum of the equine electroencephalogram during halothane anaesthesia. Res Vet Sci 1994;56:373–378. [DOI] [PubMed] [Google Scholar]
- 4. Miller SM, Short CE, Ekström PM. Quantitative electroencephalographic evaluation to determine the quality of analgesia during anesthesia of horses for arthroscopic surgery. Am J Vet Res 1995;56:374–379. [PubMed] [Google Scholar]
- 5. Otto KA, Voigt S, Piepenbrock S, et al. Differences in quantitated electroencephalographic variables during surgical stimulation of horses anesthetized with isoflurane. Vet Surg 1996;25:249–255. [DOI] [PubMed] [Google Scholar]
- 6. Johnson CB, Taylor PM. Effects of alfentanil on the equine electroencephalogram during anaesthesia with halothane in oxygen. Res Vet Sci 1997;62:159–163. [DOI] [PubMed] [Google Scholar]
- 7. Otto KA, Voigt S, Piepenbrock S, et al. Effects of low dose ketamine on haemodynamic and electroencephalographic variables during surgery in isoflurane anaesthetised horses. J Vet Anaesth 1998;25:8–12. [Google Scholar]
- 8. Johnson CB, Taylor PM. Comparison of the effects of halothane, isoflurane and methoxyflurane on the electroencephalogram of the horse. Br J Anaesth 1998;81:748–753. [DOI] [PubMed] [Google Scholar]
- 9. Johnson CB, Bloomfield M, Taylor PM. Effects of ketamine on the equine electroencephalogram during anesthesia with halothane in oxygen. Vet Surg 1999;28:380–385. [DOI] [PubMed] [Google Scholar]
- 10. Johnson CB, Bloomfield M, Taylor PM. Effects of guaiphenesin on the equine electroencephalogram during anaesthesia with halothane in oxygen. Vet Anaesth Analg 2000;27:6–12. [DOI] [PubMed] [Google Scholar]
- 11. Johnson CB, Bloomfield M, Taylor PM. Effects of thiopentone on the equine electroencephalogram during anaesthesia with halothane in oxygen. Vet Anaesth Analg 2000;27:82–88. [DOI] [PubMed] [Google Scholar]
- 12. Otto K, Short CE. Electoencephalographic power spectrum analysis as a monitor of anesthetic depth in horses. Vet Surg 2000;20:362–371. [DOI] [PubMed] [Google Scholar]
- 13. Haga HA, Dolvik NI. Evaluation of the bispectral index as an indicator of degree of central nervous system depression in isofluane‐anesthetized horses. Am J Vet Res 2002;63:438–442. [DOI] [PubMed] [Google Scholar]
- 14. Murrell JC, Johnson CB, White KL, et al. Changes in the EEG during castration in horses and ponies anaesthetized with halothane. Vet Anaesth Analg 2003;30:138–146. [DOI] [PubMed] [Google Scholar]
- 15. Johnson CB, Bloomfield M, Taylor PM. Effects of midazolam and sarmazenil on the equine electroencephalogram during anesthesia with halothane in oxygen. J Vet Pharmacol Ther 2003;26:105–112. [DOI] [PubMed] [Google Scholar]
- 16. Murrell JC, White KL, Johnson CB, et al. Investigation of the EEG effects of intravenous lidocaine during halothane anaesthesia in ponies. Vet Anaesth Analg 2005;32:212–221. [DOI] [PubMed] [Google Scholar]
- 17. Haga HA, Dolvik NI. Electroencephalographic and cardiovascular variables as nociceptive indicators in isoflurane‐anesthetized horses. Vet Anaesth Analg 2005;32:128–135. [DOI] [PubMed] [Google Scholar]
- 18. Auer JA, Amend JF, Garner HE, et al. Electroencephalographic responses during volatile anesthesia in domestic ponies: A comparative study of isoflurane, enflurane, methoxyflurane, and halothane. J Equine Med Surg 1979;3:130–134. [Google Scholar]
- 19. Lacombe VA, Podell M, Furr M, et al. Diagnostic validity of electroencephalography in equine intracranial disorders. J Vet Intern Med 2001;15:385–393. [PubMed] [Google Scholar]
- 20. March PA, Muir WW. Bispectral analysis of the electroencephalogram: A review of its development and use in anesthesia. Vet Anaesth Analg 2005;32:241–255. [DOI] [PubMed] [Google Scholar]
- 21. Rampil IJ. A primer for EEG signal processing in anesthesia. Anesthesiology 1998;89:980–1002. [DOI] [PubMed] [Google Scholar]
- 22. Williams DC, Aleman M, Holliday TA, et al. Qualitative and quantitative characteristics of the electroencephalogram in normal horses during spontaneous drowsiness and sleep. J Vet Intern Med 2008;22:630–638. [DOI] [PubMed] [Google Scholar]
- 23. Williams DC, Aleman M, Tharp B, et al. Qualitative and quantitative characteristics of the electroencephalogram in normal horses following sedative administration. J Vet Intern Med 2012;26:645–653. [DOI] [PubMed] [Google Scholar]
- 24. Steffey EP, Howland D Jr. Comparison of circulatory and respiratory effects of isoflurane and halothane anesthesia in horses. Am J Vet Res 1980;41:821–825. [PubMed] [Google Scholar]
- 25. Steffey EP, Howland D Jr, Giri S, et al. Enflurane, halothane, and isoflurane potency in horses. Am J Vet Res 1977;38:1037–1039. [PubMed] [Google Scholar]
- 26. Grandy JL, Steffey EP, Miller M. Arterial blood PO2 and PCO2 in horses during early halothane‐oxygen anesthesia. Equine Vet J 1987;19:314–318. [DOI] [PubMed] [Google Scholar]
- 27. Steffey EP, Howland D. Cardiovascular effects of halothane in the horse. Am J Vet Res 1978;39:611–615. [PubMed] [Google Scholar]
- 28. Brosnan RJ, Steffey EP, LeCouteur RA, et al. Effects of duration of isoflurane anesthesia and mode of ventilation on intracranial and cerebral perfusion pressure in horses. Am J Vet Res 2003;64:1444–1448. [DOI] [PubMed] [Google Scholar]
- 29. Aleman M, Brosnan RJ, Williams DC, et al. Malignant hyperthermia in a horse anesthetized with halothane. J Vet Intern Med 2005;19:363–367. [DOI] [PubMed] [Google Scholar]
- 30. Keifer JC, Baghdoyan HA, Lydic R. Pontine cholinergic mechanisms modulate the cortical electroencephalographic spindles of halothane anesthesia. Anesthesiology 1996;84:945–954. [DOI] [PubMed] [Google Scholar]
- 31. Merkel G, Eger EI 2nd. A comparative study of halothane and halopropane anesthesia including method for determining equipotency. Anesthesiology 1963;24:346–357. [DOI] [PubMed] [Google Scholar]
- 32. Sigl JC, Chamoun NG. An introduction to bispectral analysis for the electroencephalogram. J Clin Monit 1994;10:392–404. [DOI] [PubMed] [Google Scholar]
- 33. Todd MM. EEGs, EEG processing and the bispectral index. Anesthesiology 1998;89:815–817. [DOI] [PubMed] [Google Scholar]
- 34. Medical Advisory Secretariat . Bispectral index monitor: An evidence‐based analysis. Ont Health Technol Assess Ser 2004;4:1–70. [PMC free article] [PubMed] [Google Scholar]
- 35. Schuller PJ, Newell S, Strickland PA, et al. Response of bispectral index to neuromuscular block in awake volunteers. Br J Anaesth 2015;115(suppl 1):i95–i103. [DOI] [PubMed] [Google Scholar]
- 36. Avidan MS, Zhang L, Burnside BA, et al. Anesthesia awareness and the bispectral index. N Engl J Med 2008;358:1097–1108. [DOI] [PubMed] [Google Scholar]
- 37. Romanov A, Moon RS, Wang M, et al. Paradoxical increase in the bispectral index during deep anesthesia in New Zealand white rabbits. J Am Assoc Lab Anim Sci 2014;53:74–80. [PMC free article] [PubMed] [Google Scholar]
- 38. Bleijenberg EH, van Oostrom H, Akkerdaas LC, et al. Bispectral index and the clinically evaluated anaesthetic depth in dogs. Vet Anaesth Analg 2011;38:536–543. [DOI] [PubMed] [Google Scholar]
- 39. Lamont LA, Greene SA, Grimm KA, et al. Relationship of feline bispectral index to multiples of isoflurane minimum alveolar concentration. Comp Med 2005;55:269–274. [PubMed] [Google Scholar]
- 40. Kruljc P, Nemec A. Electroencephalographic and electromyographic changes during the use of detomidine and detomidine‐butorphanol combination in standing horses. Acta Vet Hung 2006;54:35–42. [DOI] [PubMed] [Google Scholar]
- 41. Sleigh JW, Andrzejowski J, Steyn‐Ross A, et al. The bispectral index: A measure of depth of sleep? Anesth Analg 1999;88:659–661. [DOI] [PubMed] [Google Scholar]
- 42. Tung A, Mendelson WB. Anesthesia and sleep. Sleep Med Rev 2004;8:213–225. [DOI] [PubMed] [Google Scholar]
- 43. Schwartz RS. General anesthesia, sleep and coma. N Engl J Med 2010;363:2638–2650. [DOI] [PMC free article] [PubMed] [Google Scholar]
- 44. Nelson AB, Faraguna U, Tononi G, et al. Effects of anesthesia on the response to sleep deprivation. Sleep 2010;33:1659–1667. [DOI] [PMC free article] [PubMed] [Google Scholar]
- 45. Tung A, Bergmann BM, Herrera S, et al. Recovery from sleep deprivation occurs during propofol anesthesia. Anesthesiology 2004;100:1419–1426. [DOI] [PubMed] [Google Scholar]
- 46. Grabow JD, Anslow RO, Spalatin J. Electroencephalographic recordings with multicontact depth probes in a horse. Am J Vet Res 1969;30:1239–1243. [PubMed] [Google Scholar]


