Summary
Background
The aim of the present study was to identify the contrast patterns of a tumor, and to evaluate the possibility of assessing the invasion of the perivesical fatty tissue in bladder cancer.
Material/Methods
In this study, 26 patients with bladder cancer were included. Multiphasic CT examination was performed to determine the stage of the disease before radical cystectomy.
Results
There were statistically significant differences in tumor and perivesical fatty tissue densities between pre- and post-contrast phases (p<0.05).
Conclusions
Increases in focal density suspected of being invasion of the perivesical fatty tissue can show perivesical invasion with high specificity.
MeSH Keywords: Multidetector Computed Tomography, Neoplasm Staging, Urinary Bladder Neoplasms
Background
Bladder cancer is the seventh most frequent cancer in men and the seventeenth in women [1]. The probability of a person developing bladder cancer by the age of 75 is 2–4% in men and 0.5–1% in women [2]. One of the natural results of population aging is an increase in the frequency with which bladder cancer is seen. In 25% of cases, when bladder cancer is first detected it has invaded the muscle tissue. The treatment for muscle-invasive bladder cancer (MIBC) is surgery or radiotherapy [3].
In bladder cancer survival is directly related to the depth of invasion and the presence of metastatic disease. Five-year survival rates following cystectomy are reported as 55–80% for tumours restricted to the lamina propria, 40% with invasion of the muscularis propria, 20% with invasion of the perivesical fatty tissue, and 6% in metastatic cases [4].
The clinical staging of bladder cancer was carried out in 2010 according to the revised TNM classification of the American Joint Committee on Cancer (AJCC) (7) [5]. Previously, surface and deep muscle invasion was classified as T2 and T3a, but in the new TNM classification this is all assessed as T2. Perivesical spread is currently assessed in the sub-groups of T3a (microscopic) and T3b (macroscopic – extravesical mass).
Imaging methods are used to detect the locoregional spread of bladder cancer, its lymph node involvement, its distant metastases, and synchronous tumours in the upper urinary system. The main aim of imaging methods is to determine the disease at T3 or higher stages, and in particular local lymph node metastases. Computed tomography (CT) is the imaging method of first choice because it is fast and can scan a larger area in the time of a single breath being held, and because it is less affected by individual factors [3].
The aim of the present study was to assess the pre-operative multiphasic CT images in patients in whom cystectomy is performed for bladder cancer, to identify the contrast patterns of bladder cancer, and to evaluate the possibility of assessing the invasion of the perivesical fatty tissue.
Material and Methods
Patient information
Twenty-six patients (21 male, 5 female) were included in the study. They presented between September 2008 and March 2009 with complaints of haematuria, and radical cystectomy was planned as a result of radiological evaluation. Multidedector CT examination followed by conventional cystoscopy (CC) was performed to determine the stage of the disease. An evaluation of perivesical invasion was made when staging was performed by CT. When radical cystectomy was performed, the pathological evaluation of radical cystectomy specimens was taken as a standard reference. Ethical committee approval for the study was obtained from the local institutional committee. Informed consent was obtained from all individuals.
Computed tomography technique
CT examinations were carried out with an eight-channel multidetector CT (LightSpeed QX/i; GE Medical Systems, Milwaukee, Wis., USA). Oral contrast was given 1.5 hours before the CT examination (1000–1500 cc water/2% iodine opaque). Non-ionic intravenous contrast material was given by automatic injection in a dose of 2 mL/kg at an average rate of 3 mL/sec (Omnipaque 350, GE Healthcare, Ireland), after which multiphasic CT examination was performed. In pre-contrast examination, an iliac crest-inferior pubic ramus field was chosen to include the whole bladder, with the bladder full; 120 kVp, 150–200 effective mAs (automatic modulation), soft tissue algorithm, 2.5 mm collimation, 5 mm section thickness and 1.25 mm reconstruction interval were used, and the examination was performed with 1–1.5 normalized pitch and wide FOV (30 cm). After that, non-ionic intravenous contrast material was given and CT examination was performed at 60, 80 and 180 seconds. At delay times of 60 and 180 seconds, the same area was imaged, while at 80 seconds the same parameters were set but the whole abdomen from the diaphragm to the inferior pubic ramus was imaged in order to scan for distant metastasis.
Imaging analysis
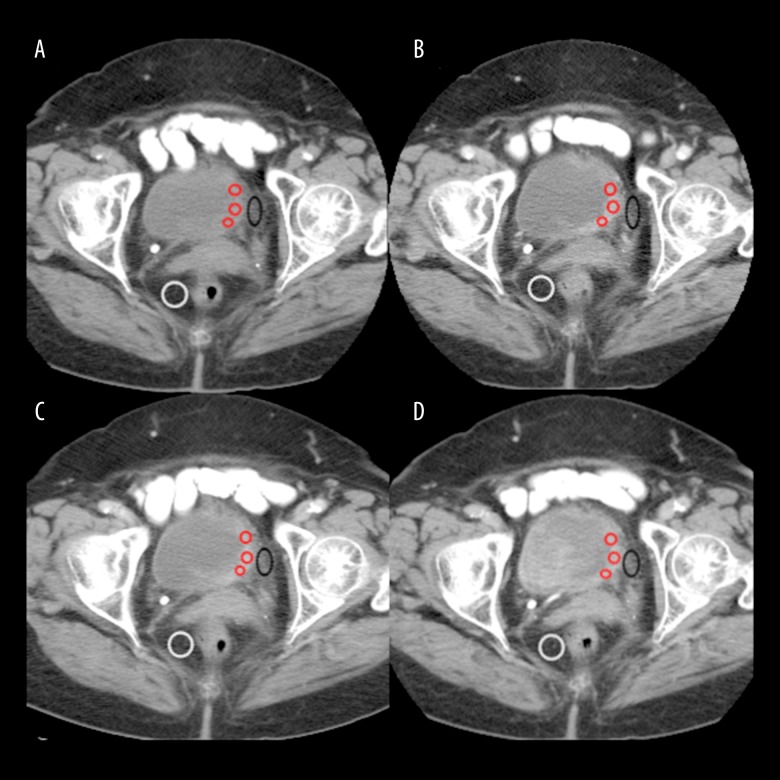
The CT images were assessed by two radiologists in consultation using GE Healthcare Advantage Workstation software. The examination taken with a delay time of 60 seconds was used to show bladder cancer, and the view taken with a delay time of 180 seconds was used to assess perivesical invasion. The examination with a delay time of 80 seconds was used to show the existence of abdominal or retroperitoneal metastasis. In the 60-second CT images, wall thickening which showed a clear contrast uptake in comparison with adjacent bladder wall or a mass extending to the bladder lumen was accepted as a bladder tumour. The short diameter of the largest lesion in patients diagnosed with multi-focus bladder cancer was taken as a reference. Asymmetrical wall thickening which did not show contrast uptake was not assessed as a bladder cancer focus. For all phases, three regions of interest (ROI) which would include more than 50% of the area within the best section of the mass were identified and calculated, and their means were taken (Figure 1). In multi-focus bladder cancer, the scale was made from the focus with the greatest diameter. The ROIs used in our study varied in size between 30 and 1015 mm2.
Figure 1.
Multiphasic CT images of bladder cancer. ROIs of tumour (red circles), ROI of perivesical fatty tissue (black circle) and ROI of perirectal fatty tissue are placed as shown in figures. The attenuation values of tumour are 49.07 HU on pre-contrast image (A), 96.1 HU on 60-second delay (B), 95,57 HU on 80-second delay (C) and 87.4 HU on 180-second delay (D).
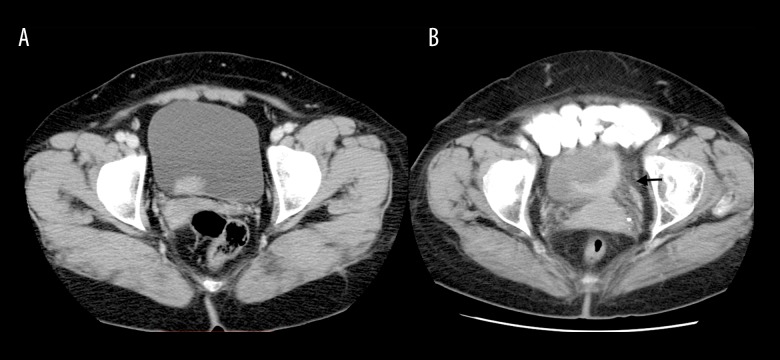
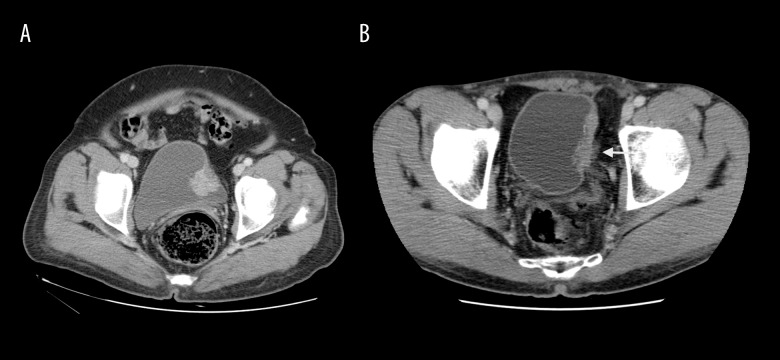
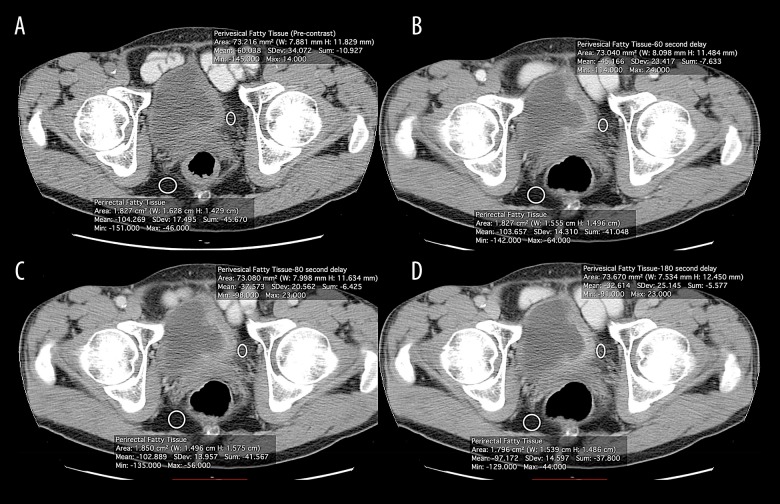
In the CT examination, local staging was carried out for all patients with bladder cancer according to the AJCC/TNM classification system. Because it was difficult to differentiate stages T3a and T3b in CT, the bladder cancer staging was performed according to the existence of perivesical fatty tissue invasion as T3a and below or T3b and above. Disorder of the perivesical fatty layer and/or an accompanying increase in fine linear density, or a spread in the bladder cancer beyond the bladder wall was taken as perivesical fatty tissue invasion (Figures 2, 3). When these findings were established, measurements were taken of perirectal and perivesical fatty tissue density in pre- and post-contrast examinations (Figure 4). The perirectal fatty tissue density found in pre-contrast examinations was taken as a reference value. The ROIs used in our study in the assessment of perirectal and perivesical fatty tissues varied in size from 25 to 70 mm2. The CT findings were compared with the results of the pathological evaluation of the tissue samples in the radical cystectomy material.
Figure 2.
Image of a 56-year-old woman with low-grade papillary urothelial carcinoma without perivesical invasion (A). On axial 80-second delay CT image, the border between tumour and perivesical fat tissue is regular. Images in an 82-year-old woman with high-grade infiltrating urothelial carcinoma with perivesical invasion (B). The axial 80-second delay CT image shows irregularity between tumour and perivesical fatty layer and fine linear densities in perivesical fat tissue (black arrow).
Figure 3.
Image in a 63-year-old woman with high-grade papillary urothelial carcinoma and submucosal infiltration without perivesical invasion (A). The axial 60-second delay CT image shows regular border between tumour and perivesical fatty layer. Images in a 56-year-old man with high-grade invasive papillary urothelial carcinoma with invasion of the muscle layer and perivesical fat tissue (B). On 60-second delay CT image, spread of bladder cancer to perivesical fatty tissue is seen (white arrow).
Figure 4.
(A–D) Axial dynamic contrast-enhanced multiphasic CT images of perivesical and perirectal fatty tissue in invasive bladder cancer.
Statistical analysis
The programs MS Excel and SPSS for Windows 15.0 (SPSS Inc., Chicago IL, USA) were used in the statistical analysis. Descriptive statistics of continuous variables are given as mean, standard deviation, median, minimum, and maximum values. Categorical variables are presented as frequencies and percentages. The Shapiro-Wilk test was used as a test of normality. Two-way comparisons were performed using the Bonferroni test and the Wilcoxon signed rank test. In all comparisons, p<0.05 was taken as the level of significant difference.
Results
A total of 26 patients, 21 male and five female, were accepted into the study. Their mean age was 62.96 (38–88) years. The mean maximum tumour size of the bladder cancer found in the 26 patients was measured as 24.95 mm (10–60 mm). Multi-focus bladder cancer was found in nine patients 34.62%) by CT examination, and was seen in 11 patients (42.3%) after radical cystectomy. The patients’ demographic characteristics and CT findings are given in Table 1.
Table 1.
Patient demographic characteristics and CT findings7.
| Characteristics | n=26 (%) |
|---|---|
| Age ≥60 year | 15 (57.69) |
| Male sex | 21 (80.77) |
| Tumor size ≥3cm | 10 (38.46) |
| Multiple tumors | 9 (34.62) |
| Histological types | |
| Uroepithelial carcinoma | 19 (73.08) |
| Squamous cell carcinoma | 5 (19.23) |
| Other | 2 (7.69) |
| CT finding | Median HU* (min–max) |
| Bladder cancer | |
| Pre-contrast | 33.67 (15.57–49.07) |
| 60. | 72.24 (36–96.10) |
| 80. | 70.68 (40.33–95.57) |
| 180. | 65.38 (28.33–91.95) |
| Perivesical fat tissue | |
| Pre-contrast | −39.28 (−81.37–6.95) |
| 60. | −18.64 (−88.57–29.27) |
| 80. | −22.60 (−90.66–23.16) |
| 180. | −24.56 (−86.45–17.37) |
HU – hounsfield unit.
The mean densities of masses accepted as bladder cancer were measured as 34 HU (15.57–49.07 HU) in the pre-contrast examination, 71.46 HU (36–96.10 HU) in the examination at 60 seconds, 69 HU (40.33–95.57 HU) at 80 seconds, and 66.55 HU (28.33–91.95 HU) at 180 seconds. When the density measurements carried out in the pre-contrast examinations were compared with the density measurements made in the post-contrast phases, the increase in densities of the bladder cancer was found to be statistically significant (p<0.001) (Table 2). However, no significant difference was found in the density increases between the post-contrast phases (p>0.05).
Table 2.
CT enhancement findings of bladder cancer.
| Mean difference of density (HU) | 95% confidence interval for difference of density (HU) | p-value* | |||
|---|---|---|---|---|---|
| 60 seconds | Pre-contrast | 37.45 | 29.19 | 45.72 | <0.001 |
| 80 | 1.44 | −1.93 | 4.81 | 1.000 | |
| 180 | 4.60 | −1.08 | 10.28 | 0.173 | |
| 80 seconds | Pre-contrast | 36.01 | 28.83 | 43.196 | <0.001 |
| 180 | 3.16 | −0.83 | 7.15 | 0.193 | |
| 180 seconds | Pre-contrast | 32.86 | 26.43 | 39.21 | <0.001 |
Bonferroni test was used for multiple comparisons.
In the CT examinations of the 26 patients, perivesical invasion was established in 10 patients, and in the pathological assessment, perivesical fatty tissue invasion was identified in 12. In all of the patients with suspected invasion, perivesical invasion was found in pathological staging. According to these results, the sensitivity of CT examination in the detection of perivesical fatty tissue invasion was 83.3%, and specificity was found to be 100%.
A comparison was made between the pre-contrast and post-contrast density measurements of the areas of perivesical fatty tissue invasion (Table 3). In the pre-contrast examination, the mean was found to be −39.28 HU (−81.37–6.95 HU). In the post-contrast examinations, the means were measured as follows: −18.64 HU (−88.57–29.27 HU) at 60 seconds, −22.60 HU (−90.66–23.16 HU) at 80 seconds, and −24.56 HU (−86.45–17.37 HU) at 180 seconds. Statistically significant differences were found in the increases in perivesical fatty tissue densities with p values of 0.007, 0.013 and 0.014, respectively. However, no statistically significant differences were found in the increases in density of perivesical fatty tissue between the post-contrast phases (p>0.05).
Table 3.
CT enhancement findings od perivesical invasion.
| Mean difference of density (HU) | 95% confidence interval for difference of density (HU) | p-value* | |||
|---|---|---|---|---|---|
| 60 seconds | Pre-contrast | 17.53 | 4.97 | 30.09 | 0.007 |
| 80 | 4.77 | −1.75 | 11.28 | 0.217 | |
| 180 | 6.00 | −4.63 | 16.62 | 0.541 | |
| 80 seconds | Pre-contrast | 12.77 | 2.68 | 22.85 | 0.013 |
| 180 | 1.23 | −4.01 | 6.48 | 1.000 | |
| 180 seconds | Pre-contrast | 11.53 | 2.29 | 20.78 | 0.014 |
Bonferroni test was used for multiple comparisons.
In the pre-contrast examination, the mean density of perirectal fatty tissue was found to be −97.25 HU (−102 – −83 HU). In patients in whom perivesical invasion was found, a comparison between the density measurements of perivesical fatty tissue regions in pre-contrast examination and perirectal fatty tissue densities showed a statistically significant difference (p=0.005).
In the pathological examination of the 26 patients, lymph node metastasis was found in 14 (53.9%), and in the CT examination, six patients (23.1%) were found to have pelvic lymph nodes of a short diameter of 1 cm or more consistent with metastasis. In five of those patients metastasis was confirmed pathologically, while in one a benign lymph node was reported. According to these results, the sensitivity of CT examination in establishing pelvic lymph node metastasis in our study was 35.7% and specificity was 91.7%.
Discussion
Bladder cancers are very close in density values to normal bladder wall in examinations without contrast, and are very difficult to identify when they are very small. It is necessary to know the contrast patterns of bladder cancer in order to distinguish cancer tissue from other bladder pathologies such as non-specific wall oedema, blood clots or debris.
The contrast values of bladder cancer in our study showed a wide distribution, which is consistent with the literature [6]. This may be related to a number of factors. The most important factor affecting this variability is the interstitial space in tumour tissue and the volume of the capillary network along with condition of the patient’s cardiovascular system. In a study by Kim J. K. et al., a maximum mean contrast of 106 HU was shown at 60 seconds in examinations with contrast at 40, 60, 80 and 100 seconds [6]. In the same study, it was established that contrast showed a significant increase at 60 and 80 seconds in bladder cancer. However, no statistically significant difference was found in the increase in contrast between 60 and 80 seconds. Maximum contrast was seen in the present study at 60 seconds, and the mean was 71.46 HU. Kim et al. found a statistically significant washout at 100 seconds, but in our study no washout was seen in 180-second late-phase examination [6]. Maximum contrast was seen in our study with an early delay time, with a slow washout. However, no statistically significant difference was found in the washout rate. Our results show that different imaging times do not create a significant difference in primary tumour diagnosis in bladder cancer, and that they provide a supplementary advantage in diagnosis.
Bladder tumours invade the uterus, cervix and vagina in women and the prostate, seminal vesicles and the fatty tissue between the rectum and the bladder in men because of their neighbouring position in the pelvis [7]. Morphological changes related to tumour invasion or changes related to infiltration of the fat between the bladder and the seminal vesicles are useful in staging [8]. In particular, spread to wall surface muscle, minimal extravesical spread or early-stage invasion of neighbouring organs can cause difficulty in clinical staging performed by CT [9–11]. In addition, oedema and inflammation in the bladder wall after transurethral resection (TUR) can cause errors in staging by CT [12]. However, it has been shown that error rates for bladder cancer and perivesical fatty tissue invasion rates were much lower in studies using multidetector CT despite oedema and inflammation seen in the bladder wall and perivesical fatty tissue after TUR [6].
The densities of pervesical and perirectal fatty tissue were compared in cases in our study in which perivesical invasion was established, and a statistically significant difference was found (p=0.005). In addition, it was found that these regions took up contrast material to a statistically significant extent after intravenous injection of the material. When the difference between contrast phases was evaluated, it was observed that maximum contrast take-up was at 60 seconds with a slow washout, similar to the primary tumour. However, in post-contrast examinations, no statistically significant difference was found between phases to show perivesical invasion. In a study by Voges et al., it was reported that perivesical invasion was established with 69% accuracy [8]. In a study by Kim B. et al. using magnetic resonance imaging, perivesical invasion was shown with 83% accuracy [13]. Kim J. K. et al. established perivesical invasion with a high accuracy of 93% with multidetector CT [6]. Multiparametric MRI that includes dynamic contrast-enhanced MRI and diffusion-weighted MRI is considered as the imaging modality of choice in tumor staging and perivesical invasion, with a reported accuracy of 87% [14,15]. This is important prognostically but does not seem to change the treatment pathway for the patient. In current practices, multiparametric MRI is more expensive than CT and not widely available. In the present study, perivesical invasion was established with a rate of accuracy of 83.3%, which is consistent with the literature. With this result, we believe that CT is as accurate as MRI in staging perivesical invasion.
Conclusions
Pre-contrast examination of the bladder and CT examination for the whole abdomen at 80 seconds post-contrast might be sufficient for the staging of bladder cancer. In this way, bladder cancers will be imaged in a more contrasted time slice than the bladder wall, and the existence of an abdominal organ or retroperitoneal metastases will be shown. With pre-contrast examination of the bladder, bladder cancers will be easily distinguished by their contrast patterns from nonspecific wall oedemas, blood clots, debris and other bladder pathologies. Increases in focal density suspected of being invasion of the perivesical fatty tissue and increased contrasting in post-contrast examination can show perivesical invasion with high specificity.
Footnotes
Conflicts of interest
The authors disclose no conflicts.
References
- 1.Babjuk M, Burger M, Zigeuner R, et al. EAU guidelines on non-muscle-invasive urothelial carcinoma of the bladder: Update 2013. Eur Urol. 2013;64:639–53. doi: 10.1016/j.eururo.2013.06.003. [DOI] [PubMed] [Google Scholar]
- 2.Jemal A, Siegel R, Ward E, et al. Cancer statistics, 2007. Cancer J Clin. 2007;57:43–66. doi: 10.3322/canjclin.57.1.43. [DOI] [PubMed] [Google Scholar]
- 3.Stenzl A, Cowan NC, De Santis M, et al. The updated EAU guidelines on muscle-invasive and metastatic bladder cancer. Eur Urol. 2009;55:815–25. doi: 10.1016/j.eururo.2009.01.002. [DOI] [PubMed] [Google Scholar]
- 4.Reuter VE. Bladder: Risk and prognostic factors – a pathologist’s perspective. Urol Clin North Am. 1999;26:481–92. doi: 10.1016/s0094-0143(05)70196-8. [DOI] [PubMed] [Google Scholar]
- 5.Edge SB, Byrd DR, Compton CC, et al. AJCC cancer staging manual. Springer; New York: 2010. [Google Scholar]
- 6.Kim JK, Park SY, Ahn HJ, et al. Bladder cancer: analysis of multi-detector row helical CT enhancement pattern and accuracy in tumor detection and perivesical staging. Radiology. 2004;231:725–31. doi: 10.1148/radiol.2313021253. [DOI] [PubMed] [Google Scholar]
- 7.MacVicar AD. Bladder cancer staging. BJU Int. 2000;86(Suppl 1):111–22. doi: 10.1046/j.1464-410x.2000.00589.x. [DOI] [PubMed] [Google Scholar]
- 8.Voges GE, Tauschke E, Stockle M, et al. Computerized tomography: An unreliable method for accurate staging of bladder tumors in patients who are candidates for radical cystectomy. J Urol. 1989;142:972–74. doi: 10.1016/s0022-5347(17)38956-5. [DOI] [PubMed] [Google Scholar]
- 9.Hodson NJ, Husband JE, MacDonald JS. The role of computed tomography in the staging of bladder cancer. Clin Radiol. 1979;30:389–95. doi: 10.1016/s0009-9260(79)80215-9. [DOI] [PubMed] [Google Scholar]
- 10.Jeffrey RB, Palubinskas AJ, Federle MP. CT evaluation of invasive lesions of the bladder. J Comput Assist Tomogr. 1981;5:22–26. doi: 10.1097/00004728-198102000-00005. [DOI] [PubMed] [Google Scholar]
- 11.Bryan PJ, Butler HE, LiPuma JP, et al. CT and MR imaging in staging bladder neoplasms. J Comput Assist Tomogr. 1987;11:96–101. doi: 10.1097/00004728-198701000-00019. [DOI] [PubMed] [Google Scholar]
- 12.Husband JE, Olliff JF, Williams MP, et al. Bladder cancer: staging with CT and MR imaging. Radiology. 1989;173:435–40. doi: 10.1148/radiology.173.2.2798874. [DOI] [PubMed] [Google Scholar]
- 13.Kim B, Semelka RC, Ascher SM, et al. Bladder tumor staging: comparison of contrast-enhanced CT, T1- and T2-weighted MR imaging, dynamic gadolinium-enhanced imaging, and late gadolinium-enhanced imaging. Radiology. 1994;193:239–45. doi: 10.1148/radiology.193.1.8090898. [DOI] [PubMed] [Google Scholar]
- 14.Malayeri AA, Pattanayak P, Apolo AB. Imaging muscle-invasive and metastatic urothelial carcinoma. Curr Opin Urol. 2015;25:441–48. doi: 10.1097/MOU.0000000000000208. [DOI] [PMC free article] [PubMed] [Google Scholar]
- 15.Kobayashi S, Koga F, Yoshida S, et al. Diagnostic performance of diffusion-weighted magnetic resonance imaging in bladder cancer: Potential utility of apparent diffusion coefficient values as a biomarker to predict clinical aggressiveness. Eur Radiol. 2011;21:2178–86. doi: 10.1007/s00330-011-2174-7. [DOI] [PubMed] [Google Scholar]


