Abstract
Background
Osteosarcoma is the most frequent primary bone cancer derived from primitive mesenchymal cells. The aim of this study was to explore the molecular mechanism of the development and progression of osteosarcoma.
Material/Methods
The gene expression profiles of osteosarcoma from 17 specimens (3 normal and 14 osteosarcoma) were downloaded from the GEO database. The differentially expressed genes were identified by use of the Limma package. DAVID and Enrichment Map were used to perform GO and KEGG pathways enrichment analysis and to integrate enrichment results of differentially expressed genes (DEGs). Protein-protein interaction network was constructed and analyzed to screen out the potential regulatory proteins using the STRING online tools.
Results
A total of 417 DEGs were screened, including 215 up-regulated and 202 down-regulated ones, accounting for 51.56% and 48.4%, respectively. In GO term, a total of 12 up-regulated expression genes were enriched in Cellular Component. The up-regulated DEGs were enriched in 6 KEGG pathways while the down-regulated expression genes were enriched in 2 KEGG pathways. The constructed PPI network was aggregated with 1006 PPI relationships and 238 nodes, accounting for 57.07% of DEGs. We found that CD20, MCM, and CCNB1 (down-regulated) in cell cycle and ECM, ITGA, RTKin (up-regulated) in focal adhesion had important roles in the progression of osteosarcoma.
Conclusions
The identified DEGs and their enriched pathways provide references for the exploration of the molecular mechanism of the development and progression of osteosarcoma. Moreover, the key genes (CD20, ECM, and ITGA) may be useful in treatment and diagnosis of osteosarcoma.
MeSH Keywords: Biological Markers, Osteosarcoma, Protein Interaction Maps
Background
Osteosarcoma (OS) is the most frequent primary bone cancer in children and adolescents. It is derived from primitive mesenchymal bone-forming cells that undergo aberrant alterations in the differentiation program [1]. The incidence of OS was reported to be 10 cases per million persons per year [2]. Patients with OS for 10 to 20 years account for 60% of cases [3]. With the development of pediatric oncology, orthopedic oncology, and biology, treatment of osteosarcoma now includes aggressive cytotoxic chemotherapy and local control surgery, which achieves a 5-year overall survival approaching 70–80% [4]. However, after patients are treated with aggressive cytotoxic chemotherapy, they finally present with metastatic disease, and there are even those whose tumors recur because of its aggressive malignancy [5]. The overall survival rate of patients with non-metastatic osteosarcoma decreases to 20% when metastases occur [6]. In most cases, unless obvious clinical manifestations such as bone fractures and local pain were observed, the patients may not be diagnosed as having OS; therefore, OS is often found at advanced stage [7]. In order to continue to make progress in the treatment and diagnosis of OS, it is very important to find biomarkers of osteosarcoma.
In recent years, considerable research has focussed on osteosarcoma. Zhu found that SOX9 is up-regulated in aggressive osteosarcoma tissues compared with controls by detecting the SOX9 mRNA and protein expression levels of 30 pairs of osteosarcoma and noncancerous bone tissues [8]. It is reported that FOXM1 is over-expressed and plays an important role in development and progression in various cancers, such as lung, liver, and breast cancer [9,10]. FoxM1 was found to be up-regulated in osteosarcoma tissues, which means that FoxM1may be as a valuable prognostic biomarker for osteosarcoma [11]. Kuan et al. suggested Dual AO/EB staining is an economic and convenient method to detect apoptosis in osteosarcoma cells [12]. However, these molecules do not treat the osteosarcoma efficiently or selectively. Therefore, there is great need for new methods to elucidate the mechanism of osteosarcoma and new therapeutics for osteosarcoma.
In this paper, microarrays were utilized to identify differentially expressed genes (DEGs) between osteosarcoma and normal cells. Significance of differential expression, functions of DEGs, and network module analysis were performed. The identified DEGs and their enriched pathways provide references for the exploration of the molecular mechanism of the development and progression of osteosarcoma. With the analysis of PPI (protein-to-protein interaction) network, we selected out key genes, which appeared to have potential to be used for clinical treatment and diagnosis of osteosarcoma in the future.
Material and Methods
Data source
The gene expression profile of GSE16088 [13] were downloaded from a public functional genomics data repository, the GEO (Gene Expression Omnibus, http://www.ncbi.nlm.nih.gov/geo/) database. A total of 17 specimens, including 3 normal samples and 14 osteosarcoma specimens, were available based on the Affymetrix Human Genome U133A Array.
Data preprocessing
We converted the probe-level data in CEL files into expression measures using the RMA function of the Affy package in R [14]. Then, the R/Bioconductor notes package of the microarray data platform was used to map probe sets to genes. For each sample, the expression values of all probes for a given gene were reduced to a single value by taking the average expression value.
DEGs screening
Limma, the most popular method in the statistical analysis to study the DEGs, was used to compare the normal samples and osteosarcoma samples [15]. Only the genes with the p-value adjusted of 0.01 and |log2(fc)|>1 were screened out as DEGs. We also performed clustering analysis for the DEGs and drew dendrograms.
Functional enrichment analysis of the DEGs
Gene ontology (GO) analysis is a commonly used approach for functional annotation of large-scale genomic data. The KEGG pathways database is a comprehensive and recognized database involving many kinds of biochemistry pathways. To gain further insights into the function of DEGs, we used the DAVID method to perform the GO enrichment analysis and KEGG pathways enrichment analysis related with the up-regulated genes and down-regulated genes, respectively. DAVID (The Database for Annotation, Visualization and Integrated Discovery) [16] was used to perform the Gene Ontology (GO) analysis and KEGG pathways enrichment analysis of DEGs, with a false discovery rate (FDR) less than 0.05.
EnrichmentMap [17], a useful tool to overcome gene-set redundancy and help in the interpretation of large gene lists, was used to integrate function enrichment results by analyzing gene-sets for enrichment significance and then organizing them as a weighted similarity network to define the relationship of different biological processes.
PPI network construction analysis
Recent key research on the interaction of proteins shows that they regularly form individual molecules in the interaction of many molecules and form complicated networks. In the present study, based on the 417 DEGs obtained above, the STRING online tools [18] were used to analyzed the PPI. The combined score >0.4 was the PPI value. Furthermore, we performed KEGG pathways enrichment analysis of the network nodes. After obtaining the PPI, the Network Analyzer plug-in [19] of Cytoscape software was used to analyze the topology property of the networks. In addition, we performed the module analysis of the network by using the ClusterONE plug-in board, then modules with p-value <0.01 were selected to perform the function analysis.
Results
Data source and preprocessing
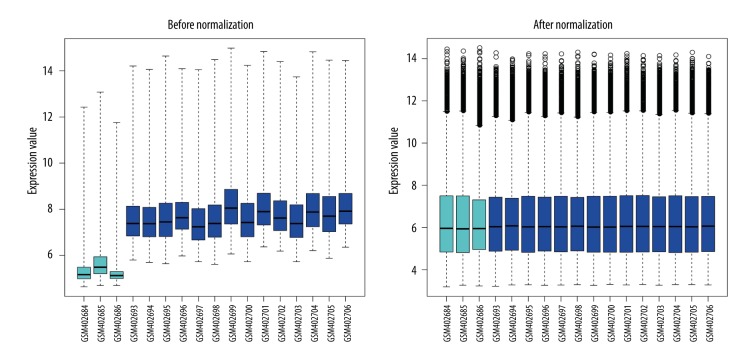
A total of 13 272 genes from 3 normal samples and 14 osteosarcoma specimens in GSE16088 were obtained. The data before normalization and after normalization are shown in Figure 1. The median of different samples was almost on the same line after normalization, indicating an excellent degree of standardization.
Figure 1.
Box-plot of expressed data before and after normalization. Horizontal axis stands for the name of samples; vertical axis stands for expression values. The black line of the box is the median of data of each group, whose distribution stands for the degree of standardization of data.
Identification of DEGs
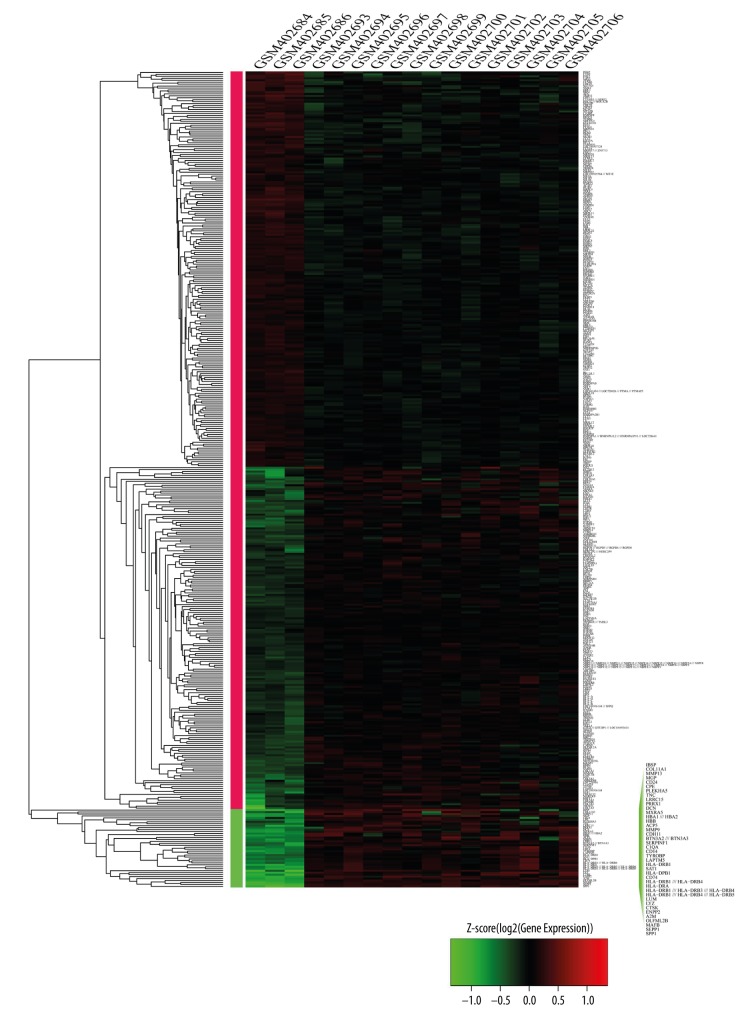
Limma of R software was used to perform the differential expression analysis of 14 osteosarcoma cancer cell samples and 3 controls, with the p-value adjusted to 0.01 and |log2(fc)|>1. Finally, 417 DEGs were identified, including 215 (51.56%) up-regulated and 202 (48.4%) down-regulated DEGs (Figure 2, Table 1). The clustering of samples was mainly separated into 2 clusters: one was a control sample and the other was an osteosarcoma sample. The clustering of genes was mainly separated into 3 clusters: the first was the down-regulated genes of the osteosarcoma sample, the second was the up-regulated genes of the osteosarcoma sample, and the third was significantly up-regulated genes.
Figure 2.
The up- and down-regulated genes. The horizontal axis above stands for the name of sample; the left vertical axis stands for the name of gene; the right vertical stands for the clustering of gene. Red stands for up-regulated gene, green stands for down-regulated gene.
Table 1.
The top 10 up- and down-regulated genes.
| Gene symbol | logFC | Adj.P.Val | Stage |
|---|---|---|---|
| ENPP2 | 5.17547995 | 8.55E-06 | UP |
| OLFML2B | 5.36660264 | 5.06E-08 | UP |
| IBSP | 5.417618485 | 0.002416 | UP |
| COL1A2 | 5.423280162 | 1.81E-05 | UP |
| A2M | 5.536407729 | 5.52E-07 | UP |
| CTSK | 5.887173758 | 1.61E-05 | UP |
| LUM | 5.917915908 | 1.48E-06 | UP |
| MAFB | 5.918869282 | 2.39E-10 | UP |
| SEPP1 | 6.973966588 | 7.43E-12 | UP |
| SPP1 | 7.053656044 | 3.34E-09 | UP |
| TRIP13 | −2.678853735 | 5.47E-06 | Down |
| CTGF | −2.557084806 | 0.00453 | Down |
| DRAP1 | −2.542490314 | 4.88E-09 | Down |
| PFKP | −2.409871977 | 0.001516 | Down |
| SLC7A5 | −2.292679135 | 4.80E-05 | Down |
| KIAA0101 | −2.263301586 | 7.77E-06 | Down |
| FHL2 | −2.2235318 | 0.004587 | Down |
| FEN1 | −2.219024605 | 4.60E-06 | Down |
| CCNB1 | −2.186489871 | 0.002583 | Down |
| HNRNPF | −2.18591996 | 3.75E-05 | Down |
Functional enrichment and integrated analysis of the DEGs
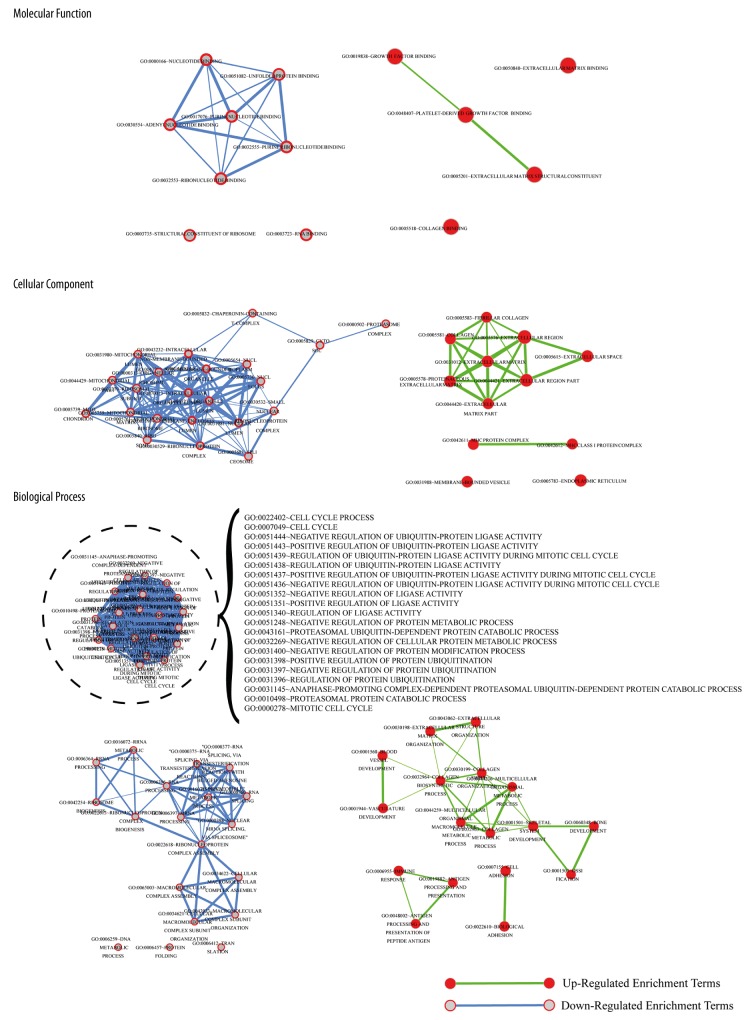
EnrichmentMap was used to analyze the relation between the enriched GO terms (Figure 3). In GO term, a total of 12 up-regulated expression genes were enriched in Cellular Component (CC), while 22 down-regulated ones were not mutually enriched in (Table 2). Down-regulated expression proteins were enriched in the organelles concerned with energy metabolism, such as ribosomes and spliceosomes; while up-regulated expression proteins were enriched in the organelles concerned with energy metabolism such as up-regulated expression proteins were enriched in extracellular domain such as extracellular region part, while in Biological Process (BP), 17 genes were up-regulated and 40 genes were down-regulated (Table 3). Down-regulated expression genes were mainly enriched in 4 biological processes such as positive regulation of ubiquitin-protein ligase activity during mitotic cell cycle. Down-regulated expression proteins influence the proliferation and fission of cell since ubiquitin-protein ligase is related with the cell cycle. Some expression genes of bone development and cell adhesion were up-regulated. Meanwhile, 5 up-regulated and 8 down-regulated genes were enriched in Molecular Function (MF) (Table 4). The 5 MFs which the up-regulated expression proteins enriched have no close connection, while 5 out of the 8 MFs which the down-regulated expression proteins enriched have close connections.
Figure 3.
The GO terms relation schemas of Molecular Function, Cellular Component, and Biological Process after enrichment of up-regulated and down-regulated genes.
Table 2.
The modules of networks.
| Module name | Nodes | Density | p-value |
|---|---|---|---|
| 1 | 29 | 0.399 | 7.99E-09 |
| 2 | 21 | 0.5095 | 2.48E-05 |
| 3 | 13 | 0.8974 | 0.0001 |
| 4 | 12 | 0.7121 | 0.000122 |
| 5 | 14 | 0.5055 | 0.001929 |
| 6 | 13 | 0.5256 | 0.002855 |
| 7 | 21 | 0.5 | 0.003462 |
Table 3.
The KEGG pathways of 7 modules.
| Module ranking | KEGG pathway | Genes | FDR |
|---|---|---|---|
| Module 1 | hsa04512: ECM-receptor interaction | IBSP, COL4A1, ITGAV, COL6A3, COL3A1, COL1A2, COL1A1, COL5A2, COL11A1, COL5A1, FN1 | 5.99E-11 |
| hsa04510: Focal adhesion | IBSP, COL4A1, ITGAV, COL6A3, COL3A1, COL1A2, PDGFRB, COL1A1, COL5A2, COL11A1, COL5A1, FN1 | 1.35E-08 | |
| Module 3 | hsa03050: Proteasome | PSMD14, PSMB6, PSMC4, PSMC3, PSMA3, PSMD1, PSMD6, PSMA7 | 2.04E-10 |
| Module 4 | hsa04612: Antigen processing and presentation | HLA-DRB1, HLA-A, HLA-C, HLA-B, HLA-G, B2M | 6.72E-04 |
| hsa05330: Allograft rejection | HLA-DRB1, HLA-A, HLA-C, HLA-B, HLA-G | 0.004467 | |
| hsa05332: Graft-versus-host disease | HLA-DRB1, HLA-A, HLA-C, HLA-B, HLA-G | 0.00571 | |
| hsa04940: Type I diabetes mellitus | HLA-DRB1, HLA-A, HLA-C, HLA-B, HLA-G | 0.007163 | |
| hsa05320: Autoimmune thyroid disease | HLA-DRB1, HLA-A, HLA-C, HLA-B, HLA-G | 0.012942 | |
| hsa05416: Viral myocarditis | HLA-DRB1, HLA-A, HLA-C, HLA-B, HLA-G | 0.035202 | |
| Module 5 | hsa03030: DNA replication | MCM7, RFC4, MCM2, MCM3, FEN1 | 1.89E-05 |
| hsa04110: Cell cycle | CCNB1, MCM7, CDC20, MCM2, MCM3 | 0.003019 | |
| Module 6 | hsa03030: DNA replication | MCM7, RFC4, MCM2, MCM3, FEN1 | 1.89E-05 |
| hsa04110: Cell cycle | CCNB1, MCM7, CDC20, MCM2, MCM3 | 0.003019 | |
| Module 7 | hsa04510: Focal adhesion | CAV1, COL4A1, ITGAV, COL6A3, COL3A1, COL1A2, PDGFRB, COL1A1, CTNNB1, FN1 | 6.85E-07 |
| hsa04512: ECM-receptor interaction | COL4A1, ITGAV, COL6A3, COL3A1, COL1A2, COL1A1, FN1 | 6.43E-05 |
Table 4.
Genes nriched in molecular function.
| Category | Term | Count | % | P value | |
|---|---|---|---|---|---|
| Up-regulated | GOTERM_MF_FAT | GO: 0048407~platelet-derived growth factor binding | 6 | 2.941176471 | 8.41E-08 |
| GOTERM_MF_FAT | GO: 0005201~extracellular matrix structural constituent | 10 | 4.901960784 | 6.22E-07 | |
| GOTERM_MF_FAT | GO: 0005518~collagen binding | 7 | 3.431372549 | 3.15E-06 | |
| GOTERM_MF_FAT | GO: 0050840~extracellular matrix binding | 6 | 2.941176471 | 1.27E-05 | |
| GOTERM_MF_FAT | GO: 0019838~growth factor binding | 9 | 4.411764706 | 2.85E-05 | |
| Down-regulated | GOTERM_MF_FAT | GO: 0000166~nucleotide binding | 60 | 30.45685279 | 1.63E-09 |
| GOTERM_MF_FAT | GO: 0003723~RNA binding | 30 | 15.2284264 | 1.09E-08 | |
| GOTERM_MF_FAT | GO: 0051082~unfolded protein binding | 13 | 6.598984772 | 1.56E-08 | |
| GOTERM_MF_FAT | GO: 0003735~structural constituent of ribosome | 14 | 7.106598985 | 1.40E-07 | |
| GOTERM_MF_FAT | GO: 0017076~purine nucleotide binding | 47 | 23.85786802 | 3.10E-06 | |
| GOTERM_MF_FAT | GO: 0030554~adenyl nucleotide binding | 39 | 19.79695431 | 2.68E-05 | |
| GOTERM_MF_FAT | GO: 0032553~ribonucleotide binding | 43 | 21.82741117 | 3.12E-05 | |
| GOTERM_MF_FAT | GO: 0032555~purine ribonucleotide binding | 43 | 21.82741117 | 3.12E-05 |
On the other hand, the metabolic pathways of the up-regulated and down-regulated genes were clearly different. The up-regulated expression genes were enriched in 6 KEGG pathways and the down-regulated expression genes were enriched in 2 KEGG pathways (Table 5).
Table 5.
The metabolic pathways of the up-regulated and down-regulated genes.
| Category | Term | Count | % | P value | |
|---|---|---|---|---|---|
| Up-regulated | KEGG_PATHWAY | hsa04512: ECM-receptor interaction | 15 | 7.352941176 | 6.48E-11 |
| KEGG_PATHWAY | hsa04510: Focal adhesion | 17 | 8.333333333 | 1.64E-07 | |
| KEGG_PATHWAY | hsa04940: Type I diabetes mellitus | 8 | 3.921568627 | 5.17E-06 | |
| KEGG_PATHWAY | hsa04612: Antigen processing and presentation | 10 | 4.901960784 | 8.78E-06 | |
| KEGG_PATHWAY | hsa05330: Allograft rejection | 7 | 3.431372549 | 2.55E-05 | |
| KEGG_PATHWAY | hsa05332: Graft-versus-host disease | 7 | 3.431372549 | 4.09E-05 | |
| Down-regulated | KEGG_PATHWAY | hsa03040: Spliceosome | 14 | 7.106598985 | 1.00E-07 |
| KEGG_PATHWAY | hsa03050: Proteasome | 8 | 4.060913706 | 9.62E-06 |
Network analysis
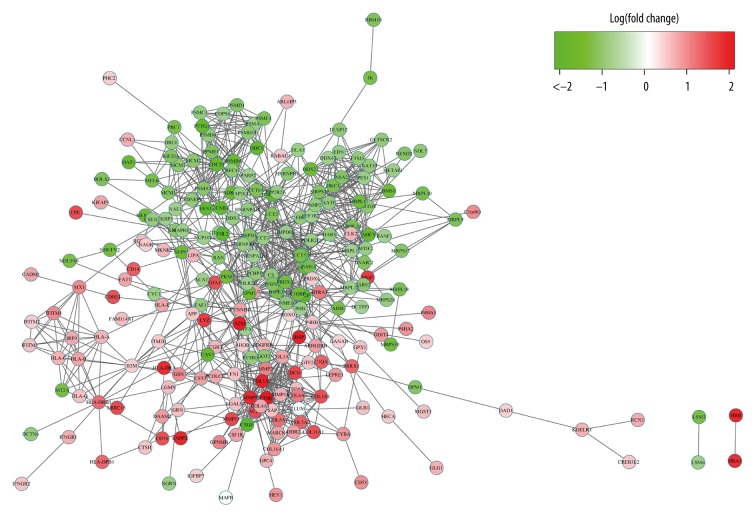
The STRING tool was used to get the PPI relationships of the 417 DEGs. The PPI with the combined score >0.4 was selected and we gained 1006 PPI relationships and 238 nodes, accounting for 57.07% of all DEGs. The network of PPI relationships appeared to be aggregated (Figure 4).
Figure 4.
The network of PPI of DEG.
Network module analysis
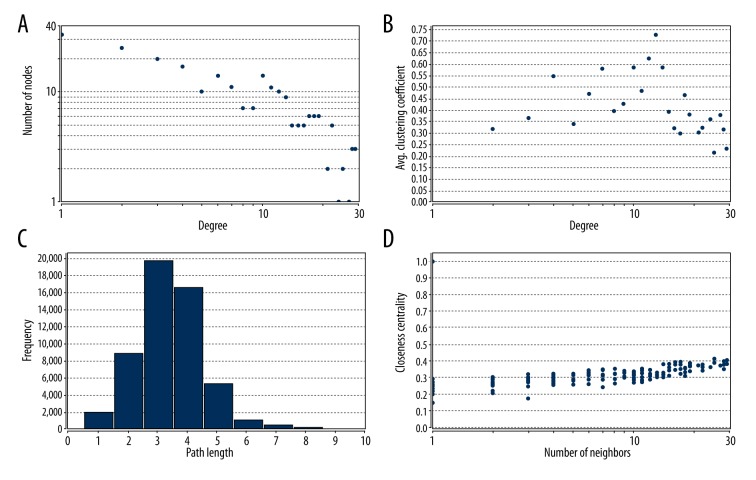
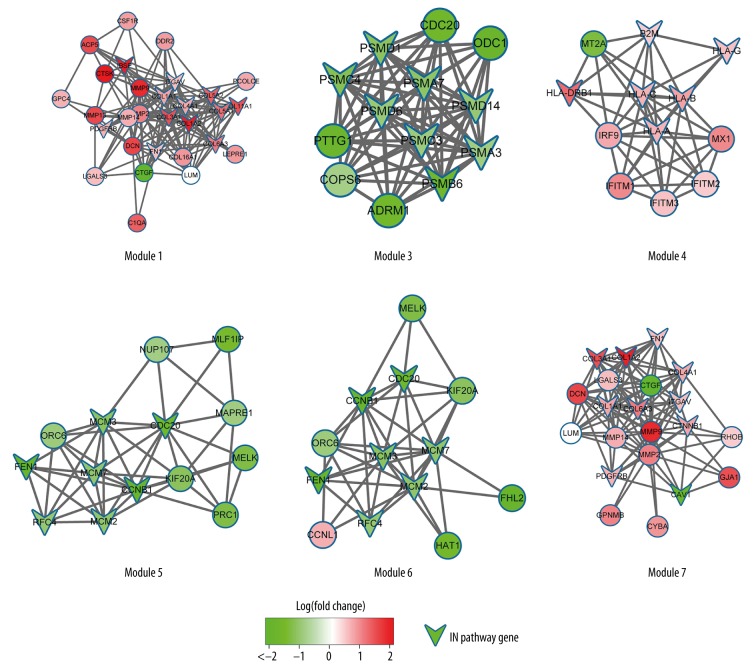
The topology property of the network is shown in Figure 5. The node degree distribution of the PPI was in power-law distribution according to the results shown in Figure 5. We screened 7 modules with 10 nodes and p-value 0.05 by using the ClusterONE plug-in board of Cytoscape (Table 2, Figure 6).
Figure 5.
The topology parameter of the networks. (A) Degree distribution; (B) Average clustering coefficient; (C) Shortest path distribution; (D) Closeness centrality.
Figure 6.
The KEGG pathways of 6 modules.
Discussion
Osteosarcoma is the most frequent primary bone tumor predominantly affecting children and adolescents [20]. Patients with OS commonly are treated with aggressive cytotoxic chemotherapy and local control surgery, and the prognosis for patients is poor [21]. In addition, patients with OS were often diagnosed at advanced stage due to the limited diagnostic methods and unclear clinical manifestations. There is an urgent need to explore the mechanism of osteosarcoma, and the knowledge gained would help develop effectively diagnoses and treatment strategies. In this study, we gained 417 DEGs upon gene expression profiling of osteosarcoma patient samples, among which the down-regulated DEGs were enriched in cell cycle pathways. CDC20, MCM, and CCNB1, the key proteins of the cell cycle, were down-regulated in module analysis of PPI, which facilitated the decline of cell proliferation. Furthermore, ECM, ITGA, and RTKin of focal adhesion were up-regulated.
Cell division cycle (CDC) proteins play important roles in the orderly progression of the cell cycle through complexing with the anaphase-promoting complex/cyclosome (APC/C) to initiate early mitosis [22]. Kata found the over-expression of CDC20 was closely related with the poor prognosis of patients with primary non-small cell lung cancer [23]. Wu found that CDC20 over-expression was a sign of the poor prognosis for patients with colorectal cancer [24]. The high expression of CDC20 and MAD2 were found to predict poor prognosis in urothelial bladder cancer [25]. Zhong-Yang Ding identified CDC20 as an independent marker for predicting the clinical outcome of gastric cancer patients because up-regulation of CDC20 was associated with aggressive progression and poor prognosis in gastric cancer [26]. In this study, we found CDC20 was differentially expressed, suggesting that CDC20 might play an important role in the progression of osteosarcoma. The other key proteins of the cell cycle, MCM and CCNB1, were differentially expressed. It is widely acknowledged that the tumor microenvironment, consisting of not only the cancer cells and all non-malignant cells, but also the interstitial fluids and the extracellular matrix (ECM), play an important role in the progression of cancer. The deregulation of ECM proteins, inducing biochemical and biomechanical changes of cancer, was associated with the progression of cancer [27]. Periostin and tenascin C are the key players in the ECM. The over-expression of periostin was associated with the metastatic growth of breast cancer, colon cancer, lung cancer, and pancreatic cancer [28–31]. The elevated level of tenascin C predicted squamous cell carcinoma of the head and neck [32].
In Lustosa’s study, ITGA-3 was over-expressed in tumors with lymph node and distant metastasis (III/IV-stage tumors compared with I/II tumors), which is associated with advanced-stage tumors [33]. ITGA2 might play an important role in the progress of hepatocellular carcinoma (HCC) as the target genes of miR-128, which is underexpressed in HCC [34]. In our study, ECM and ITGA of focal adhesion was up-regulated, suggesting that ECM and ITGA might be key proteins in the progression of osteosarcoma.
Conclusions
In this study, a total of 417 DEGs were found, protein-protein interaction network was constructed, and the network module analysis of the PPI was performed. Among the identified DEGs, CDC20, MCM, and CCNB1, the key proteins of the cell cycle, were down-regulated, and ECM, ITGA, and RTKin of focal adhesion were up-regulated. Furthermore, CD20, ECM, and ITGA may play important roles in the progression of osteosarcoma. Our results may provide potential data for the exploration of the development and progression of the osteosarcoma, and might be used as biological targets for the treatment of OS.
Footnotes
Source of support: This study was supported by the National Natural Science Foundation of China (Grant No. 81171692)
References
- 1.Broadhead ML, Clark JC, Myers DE, et al. The molecular pathogenesis of osteosarcoma: A review. Sarcoma. 2011;2011:959248. doi: 10.1155/2011/959248. [DOI] [PMC free article] [PubMed] [Google Scholar]
- 2.Whelan J, McTiernan A, Cooper N, et al. Incidence and survival of malignant bone sarcomas in England 1979–2007. Int J Cancer. 2012;131(4):E508–17. doi: 10.1002/ijc.26426. [DOI] [PubMed] [Google Scholar]
- 3.Vander Griend RA. Osteosarcoma and its variants. Orthop Clin North Am. 1996;27(3):575–81. [PubMed] [Google Scholar]
- 4.Anderson ME. Update on survival in osteosarcoma. Orthop Clin North Am. 2016;47(1):283–92. doi: 10.1016/j.ocl.2015.08.022. [DOI] [PubMed] [Google Scholar]
- 5.Fagioli F, Biasin E, Mereuta OM, et al. Poor prognosis osteosarcoma: New therapeutic approach. Bone Marrow Transplant. 2008;41(Suppl 2):S131–34. doi: 10.1038/bmt.2008.71. [DOI] [PubMed] [Google Scholar]
- 6.Biermann JS, Adkins DR, Agulnik M, et al. Bone cancer. J Natl Compr Canc Netw. 2013;11(6):688–723. doi: 10.6004/jnccn.2013.0088. [DOI] [PubMed] [Google Scholar]
- 7.Hamscho N, Grunwald F. Prognosis of primary osteosarcoma. J Nucl Med. 2003;44(6):996–97. author reply 997. [PubMed] [Google Scholar]
- 8.Zhu H, Tang J, Tang M, Cai H. Upregulation of SOX9 in osteosarcoma and its association with tumor progression and patients’ prognosis. Diagn Pathol. 2013;8:183. doi: 10.1186/1746-1596-8-183. [DOI] [PMC free article] [PubMed] [Google Scholar]
- 9.Vidal VP, Ortonne N, Schedl A. SOX9 expression is a general marker of basal cell carcinoma and adnexal-related neoplasms. J Cutan Pathol. 2008;35(4):373–79. doi: 10.1111/j.1600-0560.2007.00815.x. [DOI] [PubMed] [Google Scholar]
- 10.Lü B, Fang Y, Xu J, et al. Analysis of SOX9 expression in colorectal cancer. Am J Clin Pathol. 2008;130(6):897–904. doi: 10.1309/AJCPW1W8GJBQGCNI. [DOI] [PubMed] [Google Scholar]
- 11.Fan CL, Jiang J, Liu HC, Yang D. Forkhead box protein M1 predicts outcome in human osteosarcoma. Int J Clin Exp Med. 2015;8(9):15563–68. [PMC free article] [PubMed] [Google Scholar]
- 12.Liu K, Liu PC, Liu R, Wu X. Dual AO/EB staining to detect apoptosis in osteosarcoma cells compared with flow cytometry. Med Sci Monit Basic Res. 2015;21:15–20. doi: 10.12659/MSMBR.893327. [DOI] [PMC free article] [PubMed] [Google Scholar]
- 13.Paoloni M, Davis S, Lana S, et al. Canine tumor cross-species genomics uncovers targets linked to osteosarcoma progression. BMC Genomics. 2009;10:625. doi: 10.1186/1471-2164-10-625. [DOI] [PMC free article] [PubMed] [Google Scholar]
- 14.Gautier L, Cope L, Bolstad BM, Irizarry RA. affy – analysis of Affymetrix GeneChip data at the probe level. Bioinformatics. 2004;20(3):307–15. doi: 10.1093/bioinformatics/btg405. [DOI] [PubMed] [Google Scholar]
- 15.Ritchie ME, Phipson B, Wu D, et al. limma powers differential expression analyses for RNA-sequencing and microarray studies. Nucleic Acids Res. 2015;43(7):e47. doi: 10.1093/nar/gkv007. [DOI] [PMC free article] [PubMed] [Google Scholar]
- 16.Dennis G, Jr, Sherman BT, Hosack DA, et al. DAVID: Database for Annotation, Visualization, and Integrated Discovery. Genome Biol. 2003;4(5):P3. [PubMed] [Google Scholar]
- 17.Merico D, Isserlin R, Stueker O, et al. Enrichment map: A network-based method for gene-set enrichment visualization and interpretation. PLoS One. 2010;5(11):e13984. doi: 10.1371/journal.pone.0013984. [DOI] [PMC free article] [PubMed] [Google Scholar]
- 18.Jensen LJ, Kuhn M, Stark M, et al. STRING 8 – a global view on proteins and their functional interactions in 630 organisms. Nucleic Acids Res. 2009;37(Database issue):D412–16. doi: 10.1093/nar/gkn760. [DOI] [PMC free article] [PubMed] [Google Scholar]
- 19.Shannon P, Markiel A, Ozier O, et al. Cytoscape: A software environment for integrated models of biomolecular interaction networks. Genome Res. 2003;13(11):2498–504. doi: 10.1101/gr.1239303. [DOI] [PMC free article] [PubMed] [Google Scholar]
- 20.Ando K, Heymann MF, Stresing V, et al. Current therapeutic strategies and novel approaches in osteosarcoma. Cancers (Basel) 2013;5(2):591–616. doi: 10.3390/cancers5020591. [DOI] [PMC free article] [PubMed] [Google Scholar]
- 21.Liu K, He Q, Liao G, Han J. Identification of critical genes and gene interaction networks that mediate osteosarcoma metastasis to the lungs. Exp Ther Med. 2015;10(5):1796–806. doi: 10.3892/etm.2015.2767. [DOI] [PMC free article] [PubMed] [Google Scholar]
- 22.Weinstein J, Jacobsen FW, Hsu-Chen J, et al. A novel mammalian protein, p55CDC, present in dividing cells is associated with protein kinase activity and has homology to the Saccharomyces cerevisiae cell division cycle proteins Cdc20 and Cdc4. Mol Cell Biol. 1994;14(5):3350–63. doi: 10.1128/mcb.14.5.3350. [DOI] [PMC free article] [PubMed] [Google Scholar]
- 23.Kato T, Daigo Y, Aragaki M, et al. Overexpression of CDC20 predicts poor prognosis in primary non-small cell lung cancer patients. J Surg Oncol. 2012;106(4):423–30. doi: 10.1002/jso.23109. [DOI] [PubMed] [Google Scholar]
- 24.Wu WJ, Hu KS, Wang DS, et al. CDC20 overexpression predicts a poor prognosis for patients with colorectal cancer. J Transl Med. 2013;11:142. doi: 10.1186/1479-5876-11-142. [DOI] [PMC free article] [PubMed] [Google Scholar]
- 25.Choi JW, Kim Y, Lee JH, Kim YS. High expression of spindle assembly checkpoint proteins CDC20 and MAD2 is associated with poor prognosis in urothelial bladder cancer. Virchows Arch. 2013;463(5):681–87. doi: 10.1007/s00428-013-1473-6. [DOI] [PubMed] [Google Scholar]
- 26.Ding ZY, Wu HR, Zhang JM, et al. Expression characteristics of CDC20 in gastric cancer and its correlation with poor prognosis. Int J Clin Exp Pathol. 2014;7(2):722–27. [PMC free article] [PubMed] [Google Scholar]
- 27.Venning FA, Wullkopf L, Erler JT. Targeting ECM disrupts cancer progression. Front Oncol. 2015;5:224. doi: 10.3389/fonc.2015.00224. [DOI] [PMC free article] [PubMed] [Google Scholar]
- 28.Bao S, Ouyang G, Bai X, et al. Periostin potently promotes metastatic growth of colon cancer by augmenting cell survival via the Akt/PKB pathway. Cancer Cell. 2004;5(4):329–39. doi: 10.1016/s1535-6108(04)00081-9. [DOI] [PubMed] [Google Scholar]
- 29.Tilman G, Mattiussi M, Brasseur F, et al. Human periostin gene expression in normal tissues, tumors and melanoma: Evidences for periostin production by both stromal and melanoma cells. Mol Cancer. 2007;6:80. doi: 10.1186/1476-4598-6-80. [DOI] [PMC free article] [PubMed] [Google Scholar]
- 30.Fukushima N, Kikuchi Y, Nishiyama T, et al. Periostin deposition in the stroma of invasive and intraductal neoplasms of the pancreas. Mod Pathol. 2008;21(8):1044–53. doi: 10.1038/modpathol.2008.77. [DOI] [PubMed] [Google Scholar]
- 31.Puglisi F, Puppin C, Pegolo E, et al. Expression of periostin in human breast cancer. J Clin Pathol. 2008;61(4):494–98. doi: 10.1136/jcp.2007.052506. [DOI] [PubMed] [Google Scholar]
- 32.Pauli C, Stieber P, Schmitt UM, et al. The significance of Tenascin-C serum level as tumor marker in squamous cell carcinoma of the head and neck. Anticancer Res. 2002;22(5):3093–97. [PubMed] [Google Scholar]
- 33.Lustosa SA, de Viana LS, Affonso RJ, Jr, et al. Expression profiling using a cDNA array and immunohistochemistry for the extracellular matrix genes FN-1, ITGA-3, ITGB-5, MMP-2, and MMP-9 in colorectal carcinoma progression and dissemination. Scientific World Journal. 2014;2014:102541. doi: 10.1155/2014/102541. [DOI] [PMC free article] [PubMed] [Google Scholar]
- 34.Zhao X, Wu Y, Lv Z. miR-128 modulates hepatocellular carcinoma by inhibition of ITGA2 and ITGA5 expression. Am J Transl Res. 2015;7(9):1564–73. [PMC free article] [PubMed] [Google Scholar] [Retracted]


