

Abstract
Aims
Complex visual hallucinations occur in 70% of dementia with Lewy bodies (DLB) cases and significantly affect patient well‐being. Visuo‐cortical and retinal abnormalities have been recorded in DLB and may play a role in visual hallucinations. The present study aimed to investigate the lateral geniculate nucleus (LGN), a visual relay centre between the retina and visual cortex, to see if changes to this structure underlie visual hallucinations in DLB.
Methods
Fifty‐one [17 probable DLB, 19 control and 15 probable Alzheimer's disease (AD)] cases were recruited for a functional magnetic resonance imaging study, in which patients' response to a flashing checkerboard stimulus was detected and measured in the LGN, before comparison across experimental groups. Additionally, post mortem LGN tissue was acquired for a cross‐sectional study using 20 (six DLB, seven control and seven AD) cases and analysed using stereology. α‐Synuclein, phosphorylated tau and amyloid‐β pathology was also assessed in all cases.
Results
DLB cases did not significantly differ from controls on neuroimaging, morphometry or pathology. However, a significant increase in amyloid‐β pathology, a reduction in number of parvocellular neurones and magnocellular gliosis was found in AD cases compared with control and DLB cases.
Conclusions
These findings suggest that the early visual system is relatively spared in DLB, which implies that upstream visual structures may be largely responsible for the generation of hallucinatory percepts. The significance of the degeneration of the LGN in AD cases is uncertain.
Keywords: dementia with Lewy bodies, fMRI, lateral geniculate nucleus, neuropathology, stereology
Introduction
Dementia with Lewy bodies (DLB) accounts for approximately 20% of demented cases at autopsy [1] and is the second most common form of degenerative dementia after Alzheimer's disease (AD) [2]. Visual hallucinations occur in 60–80% of DLB cases [3] and have been shown to have a profound effect on quality of life for patients [4, 5] and their carers [6]. Typically, the hallucinations are well‐formed and often involve people, disembodied faces, animals and objects [7].
Although other visual abnormalities frequently occur in DLB [1], the pathophysiological changes that may give rise to these phenomena remain poorly understood. Four studies using small numbers of DLB patients have shown retinal abnormalities consisting of α‐synuclein deposition [8] (challenged by Ho et al. [9]) and other cytoplasmic inclusions [10], retinal nerve fibre thinning [11] and electroretinogram alterations [12]. Beyond the retina, however, no evidence has yet been provided for pathological alterations in other parts of the afferent visual pathways in DLB.
Changes have also been found in the occipital lobe of DLB cases that have experienced visual hallucinations [13, 14]. Other studies employing transcranial magnetic stimulation to elicit phosphenes, an experience of seeing light in the absence of real visual input, have shown a lower threshold of stimulation in phosphene elicitation in DLB who hallucinate more frequently and severely, suggesting occipital hyperexcitation [15].
The lateral geniculate nucleus (LGN) is the first major visual processing region in the brain, and it plays a vital role in relaying information from the retinal ganglion cells, which comprise the optic nerve emanating from the retina, to the primary visual cortex [16]. Only a few studies have been conducted into how the LGN is affected under neurodegenerative conditions. Sparse tau pathology has been recorded in AD and progressive supranuclear palsy [17], whereas limited amyloid‐β pathology [18] but no Lewy body pathology has been found in DLB [19]. In light of the relative paucity of data on the LGN in DLB, the aim of this study was to investigate whether there are abnormalities in this visual structure in DLB that may contribute to the generation of complex visual hallucinations.
To carry out this study, DLB cases were compared with age‐matched control cases and ‘disease control’ AD cases. The study objectives were:
To investigate whether there are changes to the excitability of the LGN, by assessing functional magnetic resonance imaging (fMRI) in response to a visual stimulus and analysis of local gamma amino‐butyric acid (GABA)ergic interneurons in post mortem tissue.
To evaluate whether there are changes to neuronal and glial cell populations in the LGN across groups using stereological analysis.
To assess whether changes occur to neuronal sub‐populations of the LGN, using densitometric analysis of populations differentiated by calcium‐binding proteins parvalbumin and calretinin [20].
To investigate amyloid‐β, tau and Lewy body pathology to quantify neuropathological lesions within the LGN.
Materials and methods
Neuroimaging protocol
Details of participant selection, neuropsychological and neuropsychiatric assessment, and fMRI protocol have been previously reported [14]. The study was approved by the local ethics committee (Sunderland NREC). The DLB and AD diagnosis was made independently by two experienced senior clinicians (JO'B and JPT).
Participants were scanned on a 3T whole body MRI scanner (Achieva scanner; Philips Medical Systems, Best, The Netherlands). A standard whole brain structural scan (3D) MPRAGE was acquired, and functional MRI data were collected with a gradient‐echo echo planar imaging (EPI) sequence [repetition time (TR) = 1.92 s; echo time (TE) = 40 ms; field of view 192 × 192 mm2; matrix size 64 × 64, flip angle 90°, 27 slices, slice thickness 3 mm, slice gap 1 mm]. The stimulus consisted of five 19.2 s blocks of a circular flashing (7.5 Hz) black‐and‐white checkerboard, alternating with five 19.2 s baseline blocks of a blank screen.
Data were processed using SPM5 (Wellcome Trust Centre for Neuroimaging, University College London, London, UK) (http://www.fil.ion.ucl.ac.uk/spm/). The structural scan was segmented into grey and white matter and spatially normalised using standard segmentation. The fMRI images were aligned together to correct for motion, and spatially normalised via co‐registration with the structural scan, and smoothed with a 6 mm Gaussian kernel. For analysis with the general linear model (GLM) in SPM, a design matrix was created by convolving the onset time of the checkerboard blocks with the canonical haemodynamic response function and its first derivative. The six parameters from the motion correction were also included in the design matrix. A high pass filter of 128 s was used, and serial correlations were removed with SPM's AR(1) model. For analysis of the LGN, the ‘thalamus‐visual’ region of interest (ROI) in the SPM anatomy toolbox [21], which overlies the LGN, was used, with blood oxygen level dependent (BOLD) activity averaged across both hemispheres. For each participant, the magnitude of fMRI activation in the LGN ROI was determined by averaging the relevant beta parameter from the GLM.
Post mortem tissue samples
All brain tissue was obtained from Newcastle Brain Tissue Resource (NBTR), a UK Human Tissue Authority–approved research tissue depository, and ethical approval was granted by Newcastle University ethics board and the Joint Ethics Committee of Newcastle and North Tyneside Health Authority (ref: 08/H0906/136). All subjects had been part of local prospective clinical studies and had received detailed clinical assessments during life (JPT, JO'B, AJT and IGM) and case note review after death. All cases and controls had consented to the use of their brain tissue for research purposes. Neuropathological assessment was conducted by a neuropathologist (JA) according to standardized neuropathological diagnostic procedures [1, 22, 23, 24, 25, 26]. Clinical and pathological data were collated to establish a consensus clinico‐pathological diagnosis.
Three groups of cases were included in the present study: DLB cases that had experienced complex visual hallucinations during life, AD cases that had not experienced visual hallucinations during life and aged‐control cases that showed none, or only low, age‐associated neurodegenerative pathology and had no clinical history of visual hallucinations during life. AD cases were included as disease controls with severe neurodegenerative pathology but without visual hallucinations. Cases with severe ocular pathology, such as glaucoma, were also excluded due to evidence suggesting that the LGN undergoes degeneration in these disorders [27]. Cases that had profound visual impairments were also excluded. Within the criteria specified, cases were selected based upon the availability of complete LGN tissue. The cohort used for neuropathological and morphometric analysis in this study consisted of six DLB cases, seven AD cases and seven controls (Table 1).
Table 1.
Demographic information for post mortem cohort
| Case ID | Age at death | PM delay | Diagnosis | Braak NFT stage | CERAD | Drug treatment |
|---|---|---|---|---|---|---|
| 1 | 84 | 56 | DLB | 3 | Moderate | Rivastigmine |
| 2 | 89 | 88 | DLB | 3 | Sparse | No |
| 3 | 71 | 8 | DLB | 2 | Sparse | Donepezil |
| 4 | 71 | 68 | DLB | 3 | Sparse | Donepezil |
| 5 | 78 | 83 | DLB | 1 | None | Sinemet |
| 6 | 78 | 96 | DLB | 3 | Sparse | Donepezil |
| 7 | 78 | 23 | Control | 2 | Sparse | No |
| 8 | 74 | 45 | Control | 2 | Frequent | No |
| 9 | 85 | 95 | Control | 2 | None | No |
| 10 | 77 | 83 | Control | 2 | None | No |
| 11 | 73 | 25 | Control | 0 | None | No |
| 12 | 80 | 16 | Control | 2 | None | No |
| 13 | 85 | 57 | Control | 2 | None | No |
| 14 | 76 | 6 | AD | 6 | Frequent | Rivastigmine |
| 15 | 91 | 22 | AD | 5 | Frequent | Donepezil |
| 16 | 85 | 32 | AD | 5 | Frequent | Donepezil |
| 17 | 77 | 63 | AD | 6 | Frequent | No |
| 18 | 81 | 73 | AD | 5 | Frequent | No |
| 19 | 93 | 34 | AD | 5 | Moderate | Donepezil |
| 20 | 86 | 51 | AD | 6 | Frequent | No |
Neuropathology sample preparation
At autopsy, the right hemisphere was fixed in 10% formalin, and brain weight and post mortem delay were noted. Following fixation, the hemisphere was cut into 7 mm coronal slices, prior to further dissection into blocks for neuropathological assessment. From these blocks, the LGN was identified by its distinctive architecture (Figure 1 a) and its location on the ventrolateral surface of the posterior thalamus.
Figure 1.
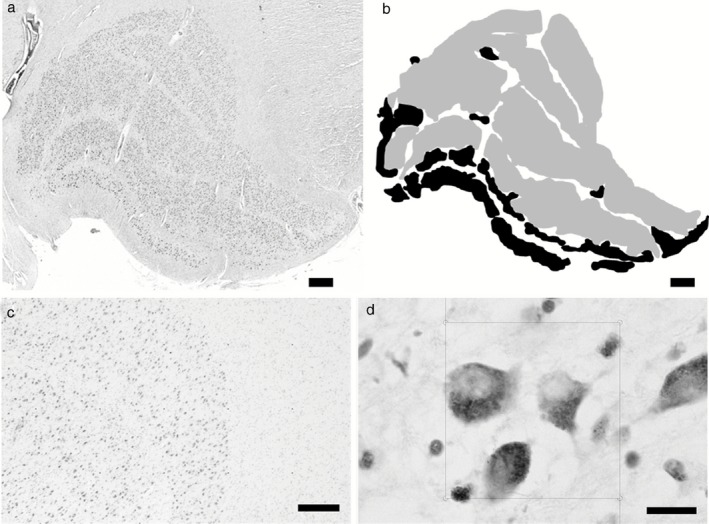
The structure of the LGN. (a) Shows a typical LGN approximately in the middle coronal level, with clear lamination. (b) Shows how the LGN was divided into magnocellular (black) and parvocellular (grey). (c) Shows typical LGN cells with a point grid, and (d) shows disector frames used to perform neuronal and glial cell counts within the LGN. Scale bars: (a) and (b) = 1 mm, (c) = 200 μm and (d) = 10 μm.
Staining of tissues
For stereological analysis, 30 μm sections were sampled at 1 mm intervals from the entire LGN and stained with cresyl fast violet. For immunohistochemical procedures, 10 μm sections were sampled at 1.5 mm intervals from the entire LGN. Sections were incubated in the primary antiserum (5G4 anti‐α‐synuclein, Analytik Jena, Jena, Germany, 1:4500; 4G8 anti‐amyloid‐β peptide, Covance, Princeton, NJ, USA, 1:15 000; AT8 anti‐phosphorylated tau, Autogen, Holliston, MA, USA, 1:4000; anti‐GAD65/67, Sigma Aldrich, St. Louis, MO, USA, 1:12 000; anti‐parvalbumin, Sigma Aldrich, 1:8000; anti‐calretinin, Sigma Aldrich, 1:1000; anti‐calbindin, Sigma Aldrich, 1:500; anti‐calbindin, Merck Millipore, Darmstadt, Germany, 1:100). Visualization of antibody binding utilized the Menarini X‐Cell‐Plus HRP Detection Kit (Menarini, Berkshire, UK).
Stereological analysis
Stereological analysis employed the use of a Zeiss AxioVision Z.1 microscope equipped with a motorised stage (Zeiss, Oberkochen, Germany), coupled to a computer with Stereologer software (Bethesda, MA, USA).
Measures were taken of both the magnocellular and parvocellular cell populations of the LGN. Magnocellular and parvocellular cells were characterized on the basis of location and morphology (Figure 1 b [28]). The laminar structure of the LGN is divided based on cellular populations, with two magnocellular ventral layers (layers 1 and 2) and four parvocellular dorsal layers (layers 3–6). As noted previously [29], ‘islands’ of magnocellular neurones exist outside of the two ventral layers of the LGN that are easily distinguished based on morphology and staining intensity with cresyl fast violet [28]. These were also included in the counts of magnocellular neurones.
To determine the number of cells in the LGN, volume was assessed using Cavalieri's principle, and cell density measures were assessed using the optical disector (as described in Mouton et al. [30] (see Appendix S1).
Disector frames were placed in a uniform, random arrangement (Figure 1 c) to calculate the density of cells within a defined region (Figure 1 d).
For the present study, only points that fell within the layers being investigated (i.e. magnocellular or parvocellular) were sampled for analysis (Figure 1 b). In anterior and posterior regions, the delineation of cell populations is complicated by the absence of corporeal lamination of the LGN. Therefore, a division was made to include cells most resembling magnocellular neurones with magnocellular analyses and those most resembling parvocellular neurones with parvocellular analyses [28].
Magnocellular and parvocellular section thickness did not significantly vary across disease groups (magnocellular F = 1.099, P = 0.356; parvocellular F = 1.154, P = 0.339). The mean coefficient of error (CE) for neuronal and glial cell estimates was calculated using the Gundersen–Jensen method [31] (see Appendix S1). CE values showed a high degree of precision, with magnocellular neurone counts having a mean CE value of 0.0663 and magnocellular glial cell counts having a mean CE value of 0.0391. Parvocellular neurone counts had a mean CE value of 0.0699 and parvocellular glial cell counts had a mean CE value of 0.0449.
Quantification of neuropathological lesions
Images of the entire LGN were captured in sampled sections using a Nikon 90i microscope with a 20 × magnifying objective and DsFi1 camera (Nikon, Tokyo, Japan) coupled to a PC. These images were imported into the NIS elements software, and thresholds were determined separately for AT8, 4G8 and 5G4 immunoreactivity (as described by Mandler et al. [32]). This allowed analysis of immunopositive signals, without detection of nonspecific background staining or physiological amyloid precursor protein, as they did not reach the size nor intensity threshold for detection. The area that was immunopositive for each antibody in the LGN was recorded and a mean generated across all images taken of the LGN, from all sections per case. This gave a final result of the mean percentage area stained per case.
Densitometric analysis of LGN neuronal populations
Images of the entire LGN were acquired in sampled sections using a Zeiss Axioplan 2 microscope (Zeiss, Oberkochen, Germany) with a 20 × magnifying objective and 3‐chip CCD true colour camera (JVC, Yokohama, Japan) coupled to a PC. These images were analysed using ImagePro Plus v.4.1 image analysis system (Media Cybernetics, Bethesda, MA, USA). Based on the techniques described in Perry et al.'s study [33], the mean percentage area stained on sections was determined. Each case, therefore, had a mean value generated across all sections analysed.
Despite a previous study [20] suggesting that calbindin labels koniocellular neurones, no immunoreactivity was observed in the LGN with various titrations of calbindin antibodies.
Statistical methods
Demographic group comparisons from the neuroimaging cohorts were conducted using parametric and categorical statistics where appropriate. Group comparisons of the beta parameter magnitude of fMRI activation in the LGN ROI were carried out using analysis of variance (anova) with post hoc t‐tests.
To assess the differences in neuronal number, glial number, neuronal volume and densitometric data between DLB, AD and control cases, an analysis of covariance was conducted, with age at death and post mortem delay as covariates. Significant main effects were followed by pairwise comparison of differences, and no Bonferroni corrections for multiple comparisons were applied due to the relatively small sample size [28]. These analyses were two way and with the alpha level set at 0.05. Densitometric and neuropathological data were analysed using anova and Kruskal–Wallis tests (as appropriate) and correlated using Spearman's rho.
Results
Demographic variables
In the neuroimaging cohort, patients and controls were matched similarly for age, visual acuity and gender (Table 2). As expected, patients had greater cognitive impairment than controls, although AD and DLB were similarly matched for global measures (Mini Mental State Examination and Cambridge Cognitive Examination total). DLB patients had more parkinsonism, fluctuations and hallucinations but were less impaired in the memory domain compared with AD cases.
Table 2.
Demographic, cognitive and motor characteristics of participants included in neuroimaging study
| Control (n = 19) | AD (n = 15) | DLB (n = 17) | anova P‐value | |
|---|---|---|---|---|
| Age (years) | 77.6 (7.1) | 82.5 (9.2) | 81.5 (5.5) | 0.12 |
| Gender (males : females) | 11:8 | 9:6 | 9:8 | 1.00 |
| UPDRS motor subscale | 0.9 (1.6) | 2.8 (3.0) | 33.5 (14.4) | <0.001*,† |
| MMSE | 29.0 (1.2) | 20.8 (4.4) | 19.0 (5.1) | <0.001*,‡ |
| CAMCOG total score | 96.5 (3.4) | 66.5 (14.4) | 64.5 (14.4) | <0.001*,‡ |
| CAMCOG executive subscore | 22.1 (3.4) | 12.7 (5.2) | 10.5 (4.9) | <0.001*,‡ |
| CAMCOG memory subscore | 23.6 (2.1) | 10.3 (5.1) | 15.4 (4.3) | <0.001*,†,‡ |
| Visual acuity (decimalised) | 0.64 (0.29) | 0.68 (0.22) | 0.58 (0.22) | 0.62 |
| CAF | – | 3.0 (4.6) | 7.9 (4.5) | <0.001 § |
| NPIhall | – | 0.4 (0.9) | 2.9 (2.3) | 0.006 § |
| On cholinesterase inhibitor | – | 14 (93.3) | 13 (76.5) | N/A |
| On antiparkinson medication | – | – | – | N/A |
| L‐dopa dose equivalent (mg) § | – | – | 145.8 (72.1) | N/A |
*Controls vs. DLB P ≤ 0.001; †AD vs. DLB P ≤ 0.001; ‡Controls vs. AD P ≤ 0.001; §AD vs. DLB comparison only. DLB, dementia with Lewy bodies; UPDRS, Unified Parkinson's Disease Rating Scale; MMSE, Mini‐Mental State Examination; CAMCOG, Cambridge Cognitive Examination; CAF, Clinician Assessment of Fluctuation; NPIhall, Neuropsychiatric Inventory hallucinations subscale score (frequency × severity of hallucinations).
For the post mortem cohort, no significant differences in post mortem delay (P = 0.253) or age (P = 0.415) were found between groups.
Neuroimaging results
On ROI analysis, significant BOLD activity was noted in the LGN (Figure 2) in DLB (0.24 ± 0.24; t = 4.22, P = 0.001) and controls (Beta estimate 0.16 ± 0.21; t = 3.18, P = 0.005) but failed to reach significance in AD (0.16 ± 0.35; t = 1.82, P = 0.09). However, there were no differences in activity between groups for the checkerboard stimulus in LGN (F = 0.54; P = 0.59). There were also no significant correlations between BOLD activation in the LGN and any of the clinical variables including neuropsychiatric inventory hallucinations subscale, a clinical marker for the severity and frequency of visual hallucinations.
Figure 2.
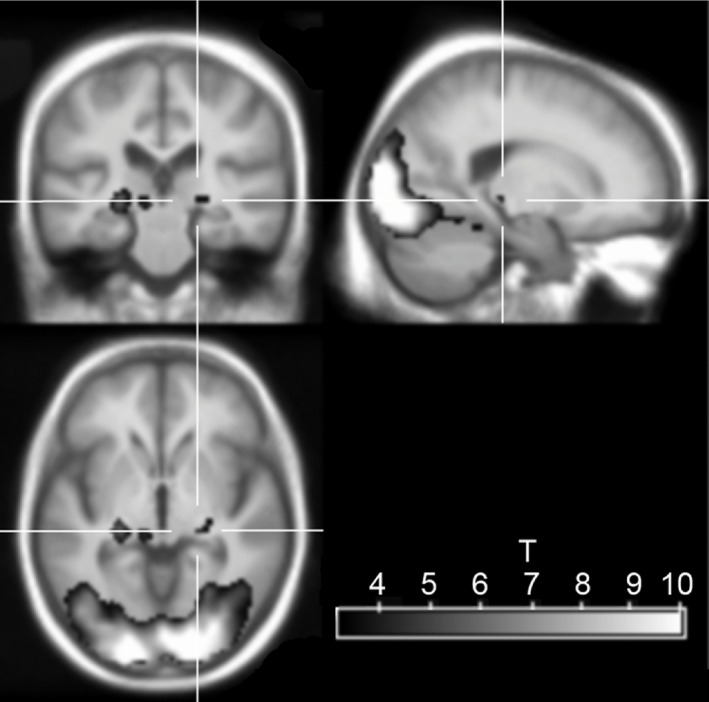
fMRI image of activation in response to checkerboard stimulus in the whole group, overlaid on an age‐matched average structural scan. Crosshair is centred on the right LGN. Yellow‐red colour scale shows the t statistic, thresholded at P < 0.001 (uncorrected for multiple comparisons).
Stereological analyses
Results from stereological analyses are summarised in Table 3.
Table 3.
Stereological data showing magnocellular (MG) and parvocellular (PV) neuronal and glial cell counts in the LGN
| Control | DLB | AD | |
|---|---|---|---|
| MG neuron number | 161 × 103 ± 12 954 | 155 × 103 ± 13 992 | 132 × 103 ± 12 954 |
| MG glia number | 821 × 103 ± 79 053 | 879 × 103 ± 85 387 | 928 × 103 ± 79 053 |
| MG neuron: glial cell ratio | 5.13 ± 0.319 | 5.74 ± 0.345 | 7.08 ± 0.319* |
| PV neuron number | 131 × 104 ± 89 641 | 141 × 104 ± 96 823 | 111 × 104 ± 89 641* |
| PV glia number | 475 × 104 ± 463 999 | 578 × 104 ± 501 177 | 423 × 104 ± 463 999 |
| PV neuron: glial cell ratio | 3.66 ± 0.26 | 4.01 ± 0.28 | 3.89 ± 0.26 |
*P < 0.05.
There was a significant main effect of diagnosis on parvocellular neurone number (F = 5.845, P = 0.013) with post hoc pairwise comparisons showing a significant 21.6% decrease in AD compared with DLB (P = 0.004) and a trend towards a significant 15.8% reduction in AD compared with controls (P = 0.064). Glial cell number differed across diagnostic groups (F = 4.118, P = 0.038) in parvocellular layers, with a significant 26.8% decrease in AD compared with DLB cases (P = 0.012). Magnocellular neurone and glial cell number was not significantly different across diagnostic groups.
In parvocellular layers, no significant difference in the ratio between glial cells and neurones across groups was observed. However, in magnocellular layers, a significant main effect of glial: neuronal cell number ratio across groups (F = 7.733, P = 0.005) was found, with a significant 38% increase noted in AD compared with control (P = 0.001) and a significant 23.3% increase in AD compared with DLB (P = 0.041).
Across all cases and controls, Braak stage was negatively correlated with the number of parvocellular neurones (rho = −0.473, P = 0.035) and the number of magnocellular neurones (rho = −0.444, P = 0.05).
The results of the stereological analysis showed high levels of variation in cell number between cases (Table 3). However, neither the duration of cognitive decline nor the age at onset of clinical symptoms was significantly correlated with magnocellular or parvocellular neuronal or glial cell number.
Neuropathology
All cases exhibited an absence of both Lewy body and tau pathology within the LGN, apart from occasional sparse AT8‐immunoreactive threads in Braak stage 6 AD cases. 4G8 immunoreactivity, as an indicator of amyloid‐β pathology, was present in all cases in varying degrees and was primarily situated in the parvocellular layers of the LGN. anova suggested a significant main effect of diagnosis upon percentage area stained for amyloid‐β (F = 7.336, P = 0.005), with a significant 790% increase in amyloid‐β density observed in AD (Figure 3) when compared with controls (P = 0.004), whereas no respective significant difference was seen between DLB and control, and a trend towards a significant difference was seen between AD and DLB (P = 0.055; Figure 3). Across all cases and controls, amyloid‐β was significantly positively correlated with Braak stage (rho = 0.574, P = 0.007).
Figure 3.
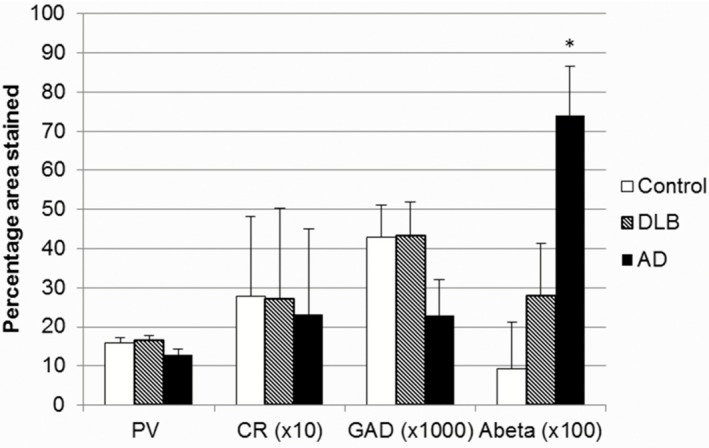
Bar chart showing percentage area stained by antibodies in the LGN across groups (*P = 0.005).
Densitometric analysis of GABAergic interneurones and neuronal populations in the LGN
GAD65/67 was used to identify GABAergic neurones present within the LGN. The percentage area of GAD65/67 immunoreactivity (Figure 3) did not differ significantly between DLB (0.43 ± 0.008), control (0.43 ± 0.009) and AD (0.23 ± 0.009; Figure 3). However, GAD65/67 percentage area was significantly correlated with parvalbumin immunoreactivity (rho = 0.58, P = 0.006), suggesting that interneurone populations increase linearly with the projection neurone populations.
Calcium‐binding proteins were used to identify neuronal subpopulations present within the LGN [20]. Parvalbumin percentage area immunoreactivity (see Figure 3) did not significantly differ between DLB (16.28 ± 1.4), control (15.99 ± 1.2) and AD (12.98 ± 1.3). Calretinin percentage area stained (see Figure 3) also did not significantly differ between DLB (2.69 ± 0.23), control (2.79 ± 0.2) and AD (2.33 ± 0.22). However, parvalbumin percentage area was negatively correlated with Braak stage (rho = −0.562, P = 0.008) in all cases and controls.
Discussion
The present study revealed similar levels of BOLD activity in the LGN ROI across groups, although in AD a significant BOLD response could not be detected. Stereological analysis showed no changes in the number of neurones in the LGN between aged‐control and DLB cases using post mortem tissue. However, in AD, the severity of gliosis in the magnocellular layers was significantly higher than in DLB and controls. These changes were accompanied by a moderate loss of parvocellular neurones in AD compared with DLB cases, and increased amyloid‐β pathology was found in AD cases.
There is a paucity of work describing how the LGN is affected in degenerative dementia disorders, particularly DLB. However, the visual symptomatology of DLB, which includes hallucinations and delusional misidentification [1], suggests that there may be pathological changes in the visual system that influence these phenomena.
Despite previous findings showing occipital changes in DLB cases using functional neuroimaging, the present study revealed no significant difference between DLB and control cases in the LGN. This suggests that physiological changes to the visual system that may promote hallucinations in DLB do not occur through alterations to the LGN. A weakness of the present study is that the fMRI was done on a different set of subjects to the post mortem sample, which precluded direct comparison of alterations in fMRI activity with findings from stereological and pathological analyses. In addition, the resolution of the fMRI is large compared with the size of the LGN, and a standard ROI was used to determine LGN activity. Thus, it may be that in the AD group, greater global atrophy could have resulted in less accurate placement of the ROI, which may explain the difficulty in detecting a significant signal in the AD group. However, this is unlikely to have affected the finding of no significant difference in activity between the control and DLB groups.
As previously reported [18], an increase in amyloid‐β pathology was found in the LGN in AD cases. However, the general absence of tau pathology in the LGN, contrasted with a previous report [17], but was consistent with another [18]. The absence of Lewy body pathology was also consistent with previous work [19]. Although the amyloid‐β burden was high in some DLB cases, it was typically indistinguishable from control cases, and no overall significant difference was observed between DLB and control cases. Braak stage was also found to be positively correlated with the amount of amyloid‐β in the LGN and negatively correlated with the number of magnocellular and parvocellular neurones and the percentage area of parvalbumin immunoreactivity. This suggests that the degree of degeneration in the LGN may be related to global neurofibrillary pathology burden.
Although previous work on the visual system in DLB has revealed retinal abnormalities [8, 10, 11, 12], the relative sparing of the LGN in DLB shown in the present study is unprecedented. It is tempting to speculate that abnormal retinal input, processed by an intact LGN, may play a role in the pathophysiology of visual hallucinations in DLB. Normal processing of abnormal retinal input could lead to the distribution of fragmented or distorted visual information, which requires completion, to visual cortical areas. In AD, where LGN abnormalities were found, and retinal abnormalities have been described [11], altered LGN processing may act as a gating function and avoiding cortical processing of altered perceptions.
The finding of specific gliosis in the magnocellular layers of the LGN in AD suggests potentially inflammatory conditions in this population of LGN neurones in AD. This may be related to the finding of specific magnocellular deficits in AD patients who have undergone physiological testing with electroretinograms and visual evoked potentials [34].
Neuropathological changes occur to the primary visual cortex in AD [35], whereas less pathology is typically observed in DLB [36]. As there is considerable reciprocal connectivity between the primary visual cortex and LGN [37], it is possible that the pathological changes observed in the LGN in AD, but not DLB, result from degeneration of the primary visual cortex in AD [35]. As pathology occurs in the primary visual cortex in late stages of AD [23, 26], and the LGN degeneration observed is relatively mild, it is tempting to speculate that the changes observed in the LGN are a late feature of AD pathology. However, if the changes do occur at late stages of AD, it is difficult to say how much of an influence that these changes may have upon the clinical phenotype.
As with most human post mortem studies of this nature, sample size was limited by tissue availability. Moreover, the strict sampling strategy demanded by stereological protocol, where whole, intact structures are required, further reduced the patient cohort. Shrinkage following formalin fixation is well understood [38] and, despite efforts to conduct this study based on unbiased principles, the unwitting introduction of bias by the differential rate of shrinkage across disease groups, while unlikely, cannot be excluded.
The present study implies that the LGN and, by extension, the geniculocortical visual pathway are relatively preserved in DLB but not AD. This preservation of the LGN suggests that the manifestation of visual hallucinations in DLB may be due to normal processing of altered visual input, upstream pathology in the visual system and/or pathological changes to brain structures elsewhere that have yet to be identified.
Author contributions
DE performed neuropathological and stereological analysis of the LGN in the post mortem cohort and wrote and edited the manuscript.
JPT clinically assessed patients from both cohorts, conducted the fMRI study and conceived the idea for the fMRI study. He also assisted in preparing and editing the manuscript.
MJF conducted the fMRI study, conceived the idea for the fMRI study and assisted in preparing and editing the manuscript.
LP assisted with staining of tissue and analysis in the post mortem cohort, and also assisted in editing the manuscript.
MO provided insights into study design and helped prepare and edit the manuscript.
JO'B clinically assessed the patients from both cohorts, conducted the fMRI study and conceived the idea for the fMRI study. He also assisted in preparing and editing the manuscript.
IGM clinically assessed the patients from the post mortem cohort during life and assisted in preparing and editing the manuscript.
JA conducted neuropathological assessment of the cases from the post mortem cohort and assisted in preparing and editing the manuscript.
AJT clinically assessed patients, obtained funding for the project and helped prepare and edit the manuscript.
CMM conceived the idea, obtained funding for the project, and helped prepare and edit the manuscript. He also helped select the cases for use in the post mortem cohort.
AAK supervised this project, conceived the idea, obtained funding for the project, and helped prepare and edit the manuscript.
Funding
Tissue for this study was provided by the Newcastle Brain Tissue Resource which is funded in part by a grant from the UK Medical Research Council (G0400074), by NIHR Newcastle Biomedical Research Centre and Unit awarded to the Newcastle upon Tyne NHS Foundation Trust and Newcastle University, and as part of the Brains for Dementia Research Programme jointly funded by Alzheimer's Research UK and Alzheimer's Society.
This study was funded by the Wellcome Trust and the NHS National Institute of Health Research Biomedical Research Unit for Lewy body dementia at Newcastle upon Tyne Hospitals NHS Foundation Trust and Newcastle University. DE is funded from the NHS National Institute of Health Research Biomedical Research Unit for Lewy body dementia, from the Yvonne Emily Mairy bequest. AAK is funded by the Alzheimer's Society. The funding source had no role in study design, data collection/analysis, the writing of the paper or the decision of when or where to publish it. The views expressed here are the views of the authors and not necessarily those of the NHS, NIHR or the Department of Health.
Disclosures
None.
Supporting information
Appendix S1. Stereology methods.
Acknowledgements
The authors wish to express their gratitude to the participants who volunteered to take part in the neuroimaging study and the individuals who kindly donated their brain tissue to the Newcastle Brain Tissue Resource. The technical assistance of Lynne Ramsay, Mary Johnson and Ros Hall is gratefully acknowledged, as is the help afforded by Becky Tench, Rhys Parry and Madhurima Dey. We also thank Professor Peter Mouton and Scott McElhiney at the Stereology Resource Centre for their assistance, and Arthur Oakley for his advice and support.
References
- 1. McKeith IG, Dickson DW, Lowe J, Emre M, O'Brien JT, Feldman H, Cummings J, Duda JE, Lippa C, Perry EK, Aarsland D, Arai H, Ballard CG, Boeve B, Burn DJ, Costa D, Del Ser T, Dubois B, Galasko D, Gauthier S, Goetz CG, Gomez‐Tortosa E, Halliday G, Hansen LA, Hardy J, Iwatsubo T, Kalaria RN, Kaufer D, Kenny RA, Korczyn A, Kosaka K, Lee VM, Lees A, Litvan I, Londos E, Lopez OL, Minoshima S, Mizuno Y, Molina JA, Mukaetova‐Ladinska EB, Pasquier F, Perry RH, Schulz JB, Trojanowski JQ, Yamada M. Diagnosis and management of dementia with Lewy bodies: third report of the DLB Consortium. Neurology 2005; 65: 1863–1872 [DOI] [PubMed] [Google Scholar]
- 2. Heidebrink JL. Is dementia with Lewy bodies the second most common cause of dementia? J Geriatr Psychiatry Neurol 2002; 15: 182–187 [DOI] [PubMed] [Google Scholar]
- 3. Burghaus L, Eggers C, Timmermann L, Fink GR, Diederich NJ. Hallucinations in neurodegenerative diseases. CNS Neurosci Ther 2012; 18: 149–159 [DOI] [PMC free article] [PubMed] [Google Scholar]
- 4. Bostrom F, Jonsson L, Minthon L, Londos E. Patients with dementia with Lewy bodies have more impaired quality of life than patients with Alzheimer disease. Alzheimer Dis Assoc Disord 2007; 21: 150–154 [DOI] [PubMed] [Google Scholar]
- 5. Weintraub D, Moberg PJ, Duda JE, Katz IR, Stern MB. Effect of psychiatric and other nonmotor symptoms on disability in Parkinson's disease. J Am Geriatr Soc 2004; 52: 784–788 [DOI] [PubMed] [Google Scholar]
- 6. Ricci M, Guidoni SV, Sepe‐Monti M, Bomboi G, Antonini G, Blundo C, Giubilei F. Clinical findings, functional abilities and caregiver distress in the early stage of dementia with Lewy bodies (DLB) and Alzheimer's disease (AD). Arch Gerontol Geriatr 2009; 49: e101–104 [DOI] [PubMed] [Google Scholar]
- 7. Mosimann UP, Rowan EN, Partington CE, Collerton D, Littlewood E, O'Brien JT, Burn DJ, McKeith IG. Characteristics of visual hallucinations in Parkinson disease dementia and dementia with lewy bodies. Am J Geriatr Psychiatry 2006; 14: 153–160 [DOI] [PubMed] [Google Scholar]
- 8. Beach TG, Carew J, Serrano G, Adler CH, Shill HA, Sue LI, Sabbagh MN, Akiyama H, Cuenca N. Phosphorylated alpha‐synuclein‐immunoreactive retinal neuronal elements in Parkinson's disease subjects. Neurosci Lett 2014; 571: 34–38 [DOI] [PMC free article] [PubMed] [Google Scholar]
- 9. Ho CY, Troncoso JC, Knox D, Stark W, Eberhart CG. Beta‐amyloid, phospho‐tau and alpha‐synuclein deposits similar to those in the brain are not identified in the eyes of Alzheimer's and Parkinson's disease patients. Brain Pathol 2014; 24: 25–32 [DOI] [PMC free article] [PubMed] [Google Scholar]
- 10. Maurage CA, Ruchoux MM, de Vos R, Surguchov A, Destee A. Retinal involvement in dementia with Lewy bodies: a clue to hallucinations? Ann Neurol 2003; 54: 542–547 [DOI] [PubMed] [Google Scholar]
- 11. Moreno‐Ramos T, Benito‐Leon J, Villarejo A, Bermejo‐Pareja F. Retinal nerve fiber layer thinning in dementia associated with Parkinson's disease, dementia with Lewy bodies, and Alzheimer's disease. J Alzheimers Dis 2013; 34: 659–664 [DOI] [PubMed] [Google Scholar]
- 12. Devos D, Tir M, Maurage CA, Waucquier N, Defebvre L, Defoort‐Dhellemmes S, Destee A. ERG and anatomical abnormalities suggesting retinopathy in dementia with Lewy bodies. Neurology 2005; 65: 1107–1110 [DOI] [PubMed] [Google Scholar]
- 13. Lobotesis K, Fenwick JD, Phipps A, Ryman A, Swann A, Ballard C, McKeith IG, O'Brien JT. Occipital hypoperfusion on SPECT in dementia with Lewy bodies but not AD. Neurology 2001; 56: 643–649 [DOI] [PubMed] [Google Scholar]
- 14. Taylor JP, Firbank MJ, He JB, Barnett N, Pearce S, Livingstone A, Vuong Q, McKeith IG, O'Brien JT. Visual cortex in dementia with Lewy bodies: magnetic resonance imaging study. Br J Psychiatry 2012; 200: 491–498 [DOI] [PMC free article] [PubMed] [Google Scholar]
- 15. Taylor JP, Firbank M, Barnett N, Pearce S, Livingstone A, Mosimann U, Eyre J, McKeith IG, O'Brien JT. Visual hallucinations in dementia with Lewy bodies: transcranial magnetic stimulation study. Br J Psychiatry 2011; 199: 492–500 [DOI] [PMC free article] [PubMed] [Google Scholar]
- 16. Jones EG. A new view of specific and nonspecific thalamocortical connections. Adv Neurol 1998; 77: 49–71, discussion 72–3. [PubMed] [Google Scholar]
- 17. Dugger BN, Tu M, Murray ME, Dickson DW. Disease specificity and pathologic progression of tau pathology in brainstem nuclei of Alzheimer's disease and progressive supranuclear palsy. Neurosci Lett 2011; 491: 122–126 [DOI] [PMC free article] [PubMed] [Google Scholar]
- 18. Leuba G, Saini K. Pathology of subcortical visual centres in relation to cortical degeneration in Alzheimer's disease. Neuropathol Appl Neurobiol 1995; 21: 410–422 [DOI] [PubMed] [Google Scholar]
- 19. Yamamoto R, Iseki E, Murayama N, Minegishi M, Marui W, Togo T, Katsuse O, Kato M, Iwatsubo T, Kosaka K, Arai H. Investigation of Lewy pathology in the visual pathway of brains of dementia with Lewy bodies. J Neurol Sci 2006; 246: 95–101 [DOI] [PubMed] [Google Scholar]
- 20. Munkle MC, Waldvogel HJ, Faull RL. The distribution of calbindin, calretinin and parvalbumin immunoreactivity in the human thalamus. J Chem Neuroanat 2000; 19: 155–173 [DOI] [PubMed] [Google Scholar]
- 21. Eickhoff SB, Stephan KE, Mohlberg H, Grefkes C, Fink GR, Amunts K, Zilles K. A new SPM toolbox for combining probabilistic cytoarchitectonic maps and functional imaging data. Neuroimage 2005; 25: 1325–1335 [DOI] [PubMed] [Google Scholar]
- 22. Montine TJ, Phelps CH, Beach TG, Bigio EH, Cairns NJ, Dickson DW, Duyckaerts C, Frosch MP, Masliah E, Mirra SS, Nelson PT, Schneider JA, Thal DR, Trojanowski JQ, Vinters HV, Hyman BT. National Institute on Aging‐Alzheimer's Association guidelines for the neuropathologic assessment of Alzheimer's disease: a practical approach. Acta Neuropathol 2012; 123: 1–11 [DOI] [PMC free article] [PubMed] [Google Scholar]
- 23. Thal DR, Rub U, Orantes M, Braak H. Phases of A beta‐deposition in the human brain and its relevance for the development of AD. Neurology 2002; 58: 1791–1800 [DOI] [PubMed] [Google Scholar]
- 24. Gearing M, Mirra SS, Hedreen JC, Sumi SM, Hansen LA, Heyman A. The Consortium to Establish a Registry for Alzheimer's Disease (CERAD). Part X. Neuropathology confirmation of the clinical diagnosis of Alzheimer's disease. Neurology 1995; 45: 461–466 [DOI] [PubMed] [Google Scholar]
- 25. Braak H, Muller CM, Rub U, Ackermann H, Bratzke H, de Vos RA, Del Tredici K. Pathology associated with sporadic Parkinson's disease – where does it end? J Neural Transm Suppl 2006; 70: 89–97 [DOI] [PubMed] [Google Scholar]
- 26. Braak H, Alafuzoff I, Arzberger T, Kretzschmar H, Del Tredici K. Staging of Alzheimer disease‐associated neurofibrillary pathology using paraffin sections and immunocytochemistry. Acta Neuropathol 2006; 112: 389–404 [DOI] [PMC free article] [PubMed] [Google Scholar]
- 27. Zikou AK, Kitsos G, Tzarouchi LC, Astrakas L, Alexiou GA, Argyropoulou MI. Voxel‐based morphometry and diffusion tensor imaging of the optic pathway in primary open‐angle glaucoma: a preliminary study. AJNR Am J Neuroradiol 2012; 33: 128–134 [DOI] [PMC free article] [PubMed] [Google Scholar]
- 28. Dorph‐Petersen K‐A, Caric D, Saghafi R, Zhang W, Sampson AR, Lewis DA. Volume and neuron number of the lateral geniculate nucleus in schizophrenia and mood disorders. Acta Neuropathol 2009; 117: 369–384 [DOI] [PMC free article] [PubMed] [Google Scholar]
- 29. Hickey TL, Guillery RW. Variability of laminar patterns in the human lateral geniculate nucleus. J Comp Neurol 1979; 183: 221–246 [DOI] [PubMed] [Google Scholar]
- 30. Mouton PR, Price DL, Walker LC. Empirical assessment of synapse numbers in primate neocortex. J Neurosci Methods 1997; 75: 119–126 [DOI] [PubMed] [Google Scholar]
- 31. Gundersen HJ, Jensen EB. The efficiency of systematic sampling in stereology and its prediction. J Microsc 1987; 147: 229–263 [DOI] [PubMed] [Google Scholar]
- 32. Mandler M, Walker L, Santic R, Hanson P, Upadhaya AR, Colloby SJ, Morris CM, Thal DR, Thomas AJ, Schneeberger A, Attems J. Pyroglutamylated amyloid‐beta is associated with hyperphosphorylated tau and severity of Alzheimer's disease. Acta Neuropathol 2014; 128: 67–79 [DOI] [PubMed] [Google Scholar]
- 33. Perry EK, Johnson M, Ekonomou A, Perry RH, Ballard C, Attems J. Neurogenic abnormalities in Alzheimer's disease differ between stages of neurogenesis and are partly related to cholinergic pathology. Neurobiol Dis 2012; 47: 155–162 [DOI] [PMC free article] [PubMed] [Google Scholar]
- 34. Sartucci F, Borghetti D, Bocci T, Murri L, Orsini P, Porciatti V, Origlia N, Domenici L. Dysfunction of the magnocellular stream in Alzheimer's disease evaluated by pattern electroretinograms and visual evoked potentials. Brain Res Bull 2010; 82: 169–176 [DOI] [PMC free article] [PubMed] [Google Scholar]
- 35. Hof PR, Morrison JH. Quantitative analysis of a vulnerable subset of pyramidal neurons in Alzheimer's disease: II. Primary and secondary visual cortex. J Comp Neurol 1990; 301: 55–64 [DOI] [PubMed] [Google Scholar]
- 36. Perry RH, Irving D, Blessed G, Fairbairn A, Perry EK. Senile dementia of Lewy body type. A clinically and neuropathologically distinct form of Lewy body dementia in the elderly. J Neurol Sci 1990; 95: 119–139 [DOI] [PubMed] [Google Scholar]
- 37. Murphy PC, Duckett SG, Sillito AM. Feedback connections to the lateral geniculate nucleus and cortical response properties. Science 1999; 286: 1552–1554 [DOI] [PubMed] [Google Scholar]
- 38. Haug H, Kuhl S, Mecke E, Sass NL, Wasner K. The significance of morphometric procedures in the investigation of age changes in cytoarchitectonic structures of human brain. J Hirnforsch 1984; 25: 353–374 [PubMed] [Google Scholar]
Associated Data
This section collects any data citations, data availability statements, or supplementary materials included in this article.
Supplementary Materials
Appendix S1. Stereology methods.