

Abstract
OBJECTIVE
High out-of-pocket (OOP) costs can be an obstacle to health care access and treatment compliance. This study investigated trends in high OOP health care burden in people with diabetes.
RESEARCH DESIGN AND METHODS
Using Medical Expenditure Panel Survey 2001–2011 data, we examined trends in the proportion of people aged 18–64 years with diabetes facing a high OOP burden. We also examined whether the trend differed by insurance status (private insurance, public insurance, or no insurance) or by income level (poor and near poor, low income, middle income, or high income).
RESULTS
In 2011, 23% of people with diabetes faced high OOP burden. Between 2001–2002 and 2011, the proportion of people facing high OOP burden fell by 5 percentage points (P < 0.01). The proportion of those who were publicly insured decreased by 22 percentage points (P < 0.001) and of those who were uninsured by 12 percentage points (P = 0.01). Among people with diabetes who were poor and near poor and those with low income, the proportion facing high OOP burden decreased by 21 (P < 0.001) and 13 (P = 0.01) percentage points, respectively; no significant change occurred in the proportion with private insurance or middle and high incomes between 2001–2002 and 2011.
CONCLUSIONS
The past decade has seen a narrowing of insurance coverage and income-related disparities in high OOP burden in people with diabetes; yet, almost one-fourth of all people with diabetes still face a high OOP burden.
Due to rising costs, increasing insurance premiums, and declining insurance benefits, health care has recently become less affordable. Stagnant incomes, which are partly due to the recession that started in 2007, have made this situation worse (1–4). Unaffordability can pose a barrier to seeking recommended health care. People with chronic diseases, such as diabetes, need extensive self-management support, medications, regular screening for signs of complications, and treatment of possible complications and comorbidities, all of which can increase out-of-pocket (OOP) costs of ongoing care in patients and their families compared with people without diabetes. Previous studies have shown that 45.1% of people with diabetes faced a high OOP burden (total family OOP spending on health care that exceeds 10% of family income). In comparison, the prevalence of high OOP burden in the overall population was 19.0% (1,5).
In recent years, several studies have reported an increase in the proportion of people in the general population facing a high health care–related OOP burden (2,6,7), but there have been no recent estimates of how the OOP burden has changed over time in those with diabetes. Furthermore, insurance coverage and income level have been strongly associated with OOP burden (1,8). In the current study, we used nationally representative data from 2001 to 2011 to examine trends in high OOP burden from health care costs in people with diabetes aged 18–64 years. We also examined how rates of high OOP burden differed by type of insurance coverage and income level.
RESEARCH DESIGN AND METHODS
Data Source
The analysis was based on 2001–2011 data from the Medical Expenditure Panel Survey (MEPS). MEPS is a nationally representative household survey of the U.S. civilian noninstitutionalized population sponsored by the Agency for Healthcare Research and Quality (9). It includes data on medical conditions, health status, health insurance coverage, and health care costs and spending. Rather than examining data 1 year at a time, we pooled adjacent years (2001–2002, 2003–2004, 2005–2006, 2007–2008, 2009–2010) to increase sample sizes, yielding more stable estimates. We used a single year’s data from 2011 because 2012 data were unavailable at the time of this analysis. The study population comprised adults aged 18–64 years with self-reported diabetes (N = 13,128). We excluded people aged ≥65 years due to Medicare eligibility because this subset of the population often has different health care needs than younger people (1,8,10). However, we retained people aged <65 years who were covered by Medicare for disabilities or dialysis or as a recipient’s spouse, which accounted for ~16% of the total sample (11). We included this group to provide a representative sample of high OOP burden among all people with diabetes aged <65 years.
Definition of the Outcome Variable
We used a widely accepted definition to measure high OOP burden, which takes into account not only OOP spending but also the ability to pay (1,8,12). OOP burden was calculated by dividing total family OOP spending on health care for all members in a given year by the family’s self-reported pretax income for that year. We used total self-reported OOP spending on health care services, including coinsurance, copayments, deductibles, and medical items; services not covered by insurance; and any portion of health insurance premiums paid OOP, including Medicare Part B premiums, if applicable. OOP burden was calculated at the family level and assigned to the individual in the family. This family-level measure was considered more appropriate for calculating OOP burden than individual-level measures because families often share resources and make decisions on resource allocation based on family needs. Thus, family income better reflects the standard of living than individual income, and family spending represents the family’s financial burden better than individual spending (1,13).
A person with diabetes is considered to have high OOP burden if the family total OOP spending on health care exceeds 10% of the family income. All costs were converted to 2011 U.S. dollars based on the Consumer Price Index (14). Those in the top 0.1% of spending were omitted as outliers. Negative spending was discarded as implausible.
Definition of Insurance and Income Categorization
Insurance status was categorized as privately insured, publicly insured (Medicare or Medicaid), or uninsured. We identified insurance coverage for each month in the 12 months before the time of the survey. Having no insurance coverage was defined as not having health insurance for the entire past year. To make insurance categories mutually exclusive, we designated the insurance type (private or public) with the longest coverage (1,8).
Income category was designated based on family income and the federal poverty level (FPL). The FPL is an annual, federally formulated dollar figure based on cost-of-living estimates and family size and composition. Poor was defined as having a family income <100% FPL, near poor as family income ≥100% but <125% FPL, low income as family income ≥125% but <200% FPL, middle income as family income ≥200% but <400% FPL, and high income as family income ≥400% FPL.
Statistical Analyses
We estimated over time the proportion of people with diabetes aged 18–64 years with high OOP burden and repeated this analysis with stratification by insurance status and family income level. We used t tests to examine changes from the 2001–2002 baseline to the subsequent time periods. Although we compared findings across years, we did not formally test for trend, such as a successive differences test or testing the null hypothesis in which the Spearman correlation between time and proportion with a high OOP burden was 0. With only six time periods, such a test would have had such low power that its results would have been difficult to interpret.
To explore the drivers behind the changes in high OOP burden, we estimated the changes over time in OOP spending on different types of health care services (i.e., prescription drugs, including diabetic equipment and supplies; inpatient care; outpatient care; other care), annual insurance premiums paid OOP, and family income. We also calculated the OOP expenses for all health care services from individuals with diabetes. We stratified these analyses by insurance status because OOP burden was largely affected by insurance coverage.
Sensitivity Analyses
We conducted three sensitivity analyses to address three independent questions about the impacts of our methods. The first analysis tested the impact of changes in the MEPS data editing method for prescription drug data in 2007. MEPS made major changes to the data editing rule in 2007 and 2009 related to imputing the prescription drug price and expenditure information. These changes may have reduced measured OOP expenditures for prescription drugs compared with the previous editing method on the same data (15,16). We tested the impact of the data editing rule change in 2007 on the current study results by separately applying the 2007 editing rule and the pre-2007 rule to the 2006 MEPS prescription drug file data (internally created for MEPS). We then used the proportional difference in test results to adjust the 2007–2011 measures to be consistent with those from before 2007, assuming the same change effect would apply to data during 2007 and 2011. Unfortunately, we were unable to test the impact of the data editing rule in 2009 because the data were unavailable.
In the second sensitivity analysis, we excluded people covered by Medicare aged <65 years because receiving Medicare benefits might make this group intrinsically different from people in the same age range not receiving Medicare benefits. In the third sensitivity analysis, we excluded people who had had more than one type of insurance (private and public) over the previous year so that we could isolate the effect of each insurance type.
We used SAS version 9.2 statistical software for all analyses. To account for the complex sampling design of MEPS, survey procedures were used to determine a representative U.S. civilian noninstitutionalized population. Results were considered significant if P < 0.05.
RESULTS
Overall, from 2001–2002 to 2011, there was a 5-percentage point decrease in the proportion of people with diabetes aged <65 years who faced high OOP burden (Fig. 1). From the 2001–2002 baseline, at which 28% of people with diabetes faced high OOP burden, the proportion did not change significantly (P > 0.05 for all time period comparisons) through 2008, but it decreased to 23% by 2009–2010 and 2011 (P < 0.01 for both).
Figure 1.
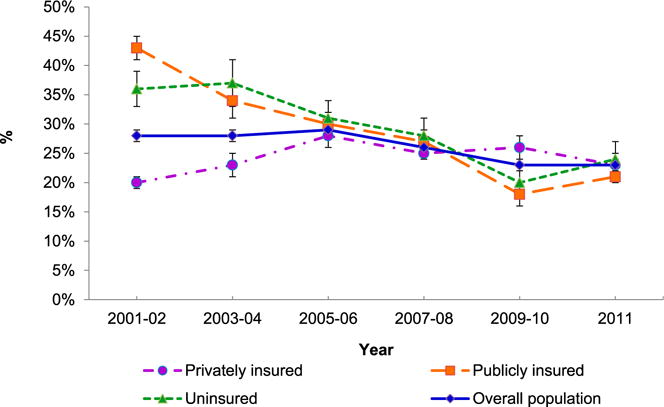
Percentage of people aged 18–64 years with diabetes facing high OOP burden for health care in the overall population and stratified by type of insurance from 2001–2002 through 2011. Error bars represent the 95% CIs.
After stratification, the baseline estimates of and changes in the proportion of people with diabetes with high OOP burden varied by insurance type (Fig. 1) and income level (Fig. 2). For privately insured people, high OOP burden increased from a 20% baseline in 2001–2002 to 28% by 2005–2006 (P < 0.001), declined gradually during 2008–2010 (but was still higher than the 2001–2002 level [P < 0.05]), and reduced to 23% by 2011 (P > 0.05). For publicly insured people, from a 2001–2002 baseline of 43%, the proportion declined to 21% by 2011 (P < 0.05 for all time periods). For uninsured people, from a 2001–2002 baseline of 36%, the proportion did not change significantly by 2007–2008 (P > 0.05), declined to 20% by 2009–2010 (P < 0.001), and increased to 24% by 2011 (P = 0.01) (Fig. 1).
Figure 2.
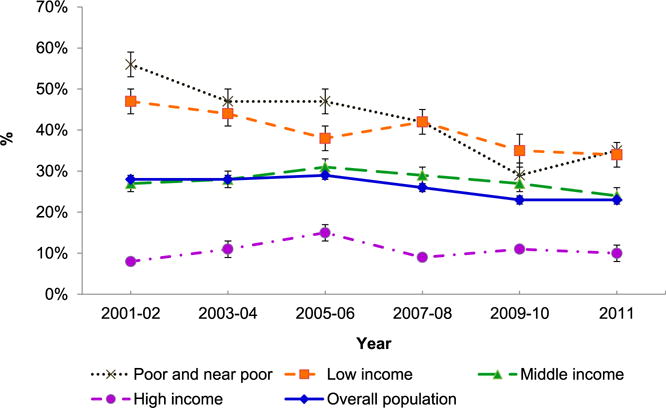
Percentage of people aged 18–64 years with diabetes facing high OOP burden for health care in the overall population and stratified by income level from 2001–2002 through 2011. Error bars represent the 95% CIs.
Figure 2 shows trends in OOP burden in people with diabetes stratified by income level. For people in the poor and near-poor group, from a 2001–2002 baseline of 56%, the proportion declined to 35% (P < 0.001) by 2011. For the low-income group, from a 2001–2002 baseline of 47%, the proportion declined to 34% (P = 0.01) by 2011. For the middle-income group, from a 2001–2002 baseline of 27%, there were no significant changes in the proportion by 2011. For the high-income group, from a 2001–2002 baseline of 8%, the proportion increased to 15% by 2005–2006 (P = 0.001) and returned to 10% by 2011 (P > 0.05).
Table 1 shows the changes in the components of OOP burden in the overall population and by insurance type. In the overall study population, OOP costs paid as insurance premiums increased from 2001–2002 to 2003–2004 (P < 0.001) and remained at a high level in the later years of the study (P < 0.05 for all). On the other hand, annual family income and OOP expenses for health care services declined from the 2001–2002 baseline through 2009 and 2011(P < 0.05).
Table 1.
Mean annual family income and OOP burden from premiums and different components of health care expenses for people with diabetes aged 18–64 years by type of insurance coverage from 2001–2002 through 2011
| Sample size | Mean annual family income ($) | Mean annual OOP family premium& ($) | Mean annual total family OOP spending# ($)
|
||||||
|---|---|---|---|---|---|---|---|---|---|
| All health care services† | Prescription drugs | Inpatient care | Outpatient care | Other care | People with diabetes | ||||
| Overall | |||||||||
| 2001–2002 | 2,112 | 67,385 | 1,416 | 2,511 (31) | 1,431 (47) | 93 (5) | 482 (21) | 505 (38) | 1,567 |
| 2003–2004 | 2,079 | 64,370 | 1,744** | 2,527 (29) | 1,534 (42) | 61 (4) | 424 (18) | 509 (39) | 1,589 |
| 2005–2006 | 2,422 | 62,156** | 1,642* | 2,476 (28) | 1,457 (41) | 74 (5) | 435 (18) | 423 (35) | 1,540 |
| 2007–2008 | 2,548 | 64,774 | 1,637* | 2,324 (26) | 1,117*** (34) | 95 (5) | 532 (20) | 580 (36) | 1,421 |
| 2009–2010 | 2,541 | 62,450* | 1,813*** | 1,726*** (23) | 822*** (32) | 96 (6) | 401** (18) | 407* (33) | 1,098*** |
| 2011 | 1,426 | 61,679* | 1,839* | 1,782*** (23) | 902*** (35) | 90 (4) | 413 (17) | 376** (29) | 1,180*** |
|
| |||||||||
| Privately insured | |||||||||
| 2001–2002 | 1,206 | 82,861 | 1,898 | 2,348 (28) | 1,177 (42) | 73 (4) | 541 (21) | 556 (40) | 1,360 |
| 2003–2004 | 1,063 | 80,170 | 2,464*** | 2,611* (28) | 1,401** (40) | 64 (5) | 514 (19) | 632 (44) | 1,526* |
| 2005–2006 | 1,192 | 77,849* | 2,404*** | 2,711** (28) | 1,448*** (40) | 819 (6) | 543 (20) | 531 (41) | 1,612* |
| 2007–2008 | 1,395 | 79,976 | 2,349** | 2,443 (25) | 1,069 (33) | 86 (4) | 643 (20) | 645 (38) | 1,434 |
| 2009–2010 | 1,272 | 78,608 | 2,782*** | 2,008*** (24) | 904*** (34) | 95 (6) | 495 (20) | 532 (36) | 1,203* |
| 2011 | 701 | 80,076 | 2,767*** | 1,979** (24) | 957*** (36) | 65 (3) | 518 (18) | 439* (32) | 1,256 |
|
| |||||||||
| Publicly insured | |||||||||
| 2001–2002 | 596 | 37,238 | 654 | 2,818 (24) | 1,976 (44) | 116 (2) | 295 (10) | 431 (27) | 1,944 |
| 2003–2004 | 728 | 35,009 | 585 | 2,221* (19) | 1,717 (34) | 44 (2) | 189** (7) | 270* (23) | 1,582* |
| 2005–2006 | 846 | 36,723 | 505 | 1,962*** (18) | 1,386*** (30) | 71 (3) | 190* (8) | 265* (19) | 1,327*** |
| 2007–2008 | 726 | 34,766 | 550 | 1,835*** (16) | 988*** (23) | 60 (2) | 278 (9) | 508 (28) | 1,197*** |
| 2009–2010 | 785 | 37,955 | 506 | 1,223*** (11) | 671*** (16) | 37 (1) | 270 (8) | 245** (21) | 859*** |
| 2011 | 447 | 35,486 | 653 | 1,442*** (13) | 847*** (20) | 37 (1) | 263 (9) | 296*** (20) | 910*** |
|
| |||||||||
| Uninsured | |||||||||
| 2001–2002 | 310 | 44,412 | 315 | 2,780 (68) | 1,700 (83) | 156 (15) | 548 (45) | 376 (57) | 1,933 |
| 2003–2004 | 288 | 44,707 | 384 | 2,822 (62) | 1,865 (82) | 87 (12) | 488 (45) | 382 (59) | 2,002 |
| 2005–2006 | 384 | 40,207 | 339 | 2,471 (56) | 1,681 (76) | 44 (4) | 483 (36) | 245 (47) | 1,672 |
| 2007–2008 | 427 | 48,961 | 291 | 2,684 (50) | 1,588 (66) | 206 (17) | 484 (36) | 405 (456) | 1,787 |
| 2009–2010 | 484 | 41,439 | 262 | 1,494*** (41) | 761*** (57) | 207 (22) | 257*** (32) | 269 (45) | 1,105*** |
| 2011 | 278 | 40,070 | 453 | 1,681*** (42) | 783*** (62) | 317 (17) | 293** (37) | 287 (35) | 1,180*** |
Data are mean (%) unless otherwise indicated.
Percentage represents the relative portion of expenditures paid OOP from total expenditures on this type of health care service. &The premium for these publicly insured and the uninsured individuals is likely to be from other members in the family because it was the total insurance premium paid OOP for all the members in the family.
The OOP expenditure for all health care services, including all coinsurance, copayments, deductibles, and medical items, and services not covered by insurance paid OOP in a year, which equals the OOP expenditure from prescription drugs, inpatient care, outpatient care, and other care.
Significantly different from estimates in 2001–2002 at α < 0.05.
Significantly different from estimates in 2001–2002 at α < 0.01.
Significantly different from the estimates in 2001–2002 at α < 0.001.
By service type, OOP expenditure for prescription drugs declined through 2007 and 2011 from the 2001–2002 level (P < 0.001 for all); the magnitude of reduction was 70–100% of that in overall health care services. OOP expenses for outpatient and other health care services declined from the 2001–2002 baseline through 2009 and 2011 (P < 0.05 for outpatient care in 2009–2010; P < 0.05 for both for other care). Inpatient care did not change over the study period (P > 0.5 for all) (Supplementary Fig. 1 and Table 1).
For people with private insurance, OOP spending on insurance premiums increased steadily from the 2001–2002 baseline level (P < 0.01 for all). OOP spending on all health care services and prescription drugs increased from the 2001–2002 baseline through 2003 and 2006 (P < 0.05 for both) then declined through 2009 and 2011 (P < 0.01 for both).
For people with public insurance, OOP spending on health care services overall and prescription drugs decreased steadily from the 2001–2002 baseline (P < 0.001 for all). OOP spending on other health care expenses by publicly insured people also decreased from the 2001–2002 baseline (P < 0.01 for both).
For uninsured people, OOP spending on prescription drugs did not change significantly from the 2001–2002 baseline through 2003 and 2008 but decreased by 2009–2010 and through 2011 (P < 0.001 for both). OOP spending on outpatient care also decreased in 2009–2010 and 2011 from the 2001–2002 baseline level (P < 0.01 for both) (Table 1).
People with diabetes account for more than one-half of the OOP expenses on health care services in the family. The trends in individual-level OOP expenses spent on people with diabetes are similar to the trends of the total family OOP expenses (Table 1).
Using the 2007 data editing rule change to process 2006 prescription data on reported family OOP spending on prescription drugs produced a result $147 less than the result using the old data editing rule on the same data. The data editing change resulted in a 2-percentage point decrease in the proportion of patients facing high OOP burden in the overall group, a 4-percentage point decrease in the publicly insured group, a 1-percentage point decrease in the privately insured group, and no change in the uninsured group. By income level, the data editing change caused a 5-percentage point decrease in the proportion of high OOP burden in the poor and near-poor groups, a 1-percentage point reduction in the low-income group, a 2-percentage point reduction in the middle-income group, and no change in the high-income group. When adjustments for the differences owing to the 2007 data editing change were applied to the 2007–2008 data, the general trend did not change.
After excluding families of people aged <65 years with Medicare coverage, the proportion of people with high OOP burden was 33% in 2001–2002 and 17% in 2011. OOP spending in people without Medicare was about one-half of the OOP spending in those with Medicare (Supplementary Table 1). When we limited the private insurance and public insurance coverage groups to only people with full 12-month coverage, the proportion with high OOP burden varied by 1–2 percentage points compared with findings from the primary analysis.
CONCLUSIONS
The proportion of people with diabetes aged 18–64 years having high OOP burden declined between 2001–2002 and 2011. This was a result of a decline in the proportion of people with high OOP burden among those with public insurance, with no insurance, and in poor and near-poor or low-income groups. In the people with private insurance, the burden increased at first and then declined to the baseline level. There were no significant changes in the proportion of people facing high OOP burden in the middle- or high-income groups over the study period.
The findings have two major implications. First, the proportion of people with high OOP burden declined for those with public insurance or no insurance and for those in the poor and near-poor and low-income groups. Reducing OOP burden may improve the affordability of health care for these people because they could use the same amount of money to pay for more health care than before. Second, at the beginning of the study period, there was a substantial difference in high OOP burden between privately insured people and publicly or uninsured people and between people in the poor and near-poor and low-income groups and those in the high-income group. By the end of the study period, these differences disappeared or became smaller; that is, disparity in high OOP burden by insurance status and income level decreased. It is plausible that this difference might have resulted in a reduction in those disparities in health outcomes previously associated with differences in insurance and income level. Future studies could examine whether this reduced disparity in high OOP burden has indeed reduced disparity in access to health care and in health outcomes across the diabetic subgroups of the overall population aged <65 years.
The reduction in high OOP burden is mainly attributable to the reduction in OOP spending on prescription drugs. In those with public insurance, this reduction probably reflects Medicaid’s post-2001 cost-containment strategies, such as a preferred drug list (formulary), prior authorization requirement and quantity limitations for brand name drugs, and bundled payments (17–21). For example, by 2012, 48 states and the District of Columbia had a Medicaid formulary in place, which required higher copayment for nonformulary drugs (mostly higher-cost brand name drugs) than drugs on the formulary (mostly generic drugs) (20). These strategies gave patients and providers incentives to purchase or prescribe less-expensive drugs. An earlier study found that the proportion of prescriptions filled with generic drugs increased dramatically among people with public insurance from ~43% in 2003 to 55% by 2006 and then to >60% by 2008 (10).
The 2006 introduction of Medicare Part D could partially explain the reduction in high OOP burden in families of publicly insured people with diabetes. Through the Part D program, Medicare provided insurance coverage for the first time for outpatient prescription drugs. Medicare Part D was associated with reduced OOP expenditure on prescription drugs in the Medicare population (22–24). Among people in our study population, this change affected the 16% who were aged <65 years receiving Medicare benefits (11).
Other factors may also have contributed to the decrease in OOP spending on prescription drugs among people with diabetes who had public insurance. For example, some states eliminated co-payments for their Medicaid plans (25). By 2003 and 2007, several drugs for treating diabetes and its risk factors, including metformin, angiotensin-converting enzyme inhibitors, and statins, went off patent, and their generic forms became available on the market (7,26,27). Between 2000 and 2006, at least 26 states authorized or started drug assistance programs to help people who could not afford prescription drugs. By 2009, 42 states had such a program in place (28). The 2009 change in MEPS data editing methods for prescription drug files may also have contributed to the observed reduction for the 2009–2010 and 2011 period because we observed a substantial decline in OOP spending on prescription drugs from the 2007–2008 level in all insurance-type groups. However, we could not determine the size of the impact resulting from the data editing rule change. Many of these changes could have affected all people with diabetes, not just those with public insurance. For example, in people without insurance or with private insurance, we also observed a reduction in OOP spending during 2009 and 2011.
Compared with the general U.S. population, publicly insured people with diabetes had a more substantial reduction in high OOP burden (2,6,7). As prescription drugs account for a larger part of OOP spending, this difference might have been because people with diabetes, who on average rely more heavily on prescription drugs, were more likely to respond to the cost-containment policies or subsidy programs (19). Prescription drugs accounted for a large portion of OOP health care spending. For people with diabetes, OOP spending on prescription drugs was >60% of the total OOP health care spending; in the general population, it was <40% (8,13). Thus, for people with diabetes, total OOP burden was more sensitive to changes in prescription drug costs than it was in the general population.
Although we observed an upward trend in the proportion of people in the privately insured group with high OOP burden between 2001–2002 and 2005–2006, the trend turned downward during 2007 and through 2011. This downward trend mainly resulted from a decline in OOP spending on prescription drugs among this group. A similar finding was also reported for the general population during 2007 and 2008 (7). It is unlikely that the 2007 change in MEPS prescription data editing accounts for the reduction because the impact of the rule change was minimal in people with private insurance. Increased use of generic drugs might partially explain the decrease. From 2003 to 2008, the proportion of all prescriptions filled with generic drugs for privately insured individuals increased from 35 to 54%. However, the slope of increase was steepest for 2007–2008 (10).
One concern for the reduction in OOP spending we observed in the groups with public insurance and no insurance is the possible underuse of health care services during the recession. However this explanation is unlikely because we found that total medical spending for all health care services did not decrease during the study period, as shown in a study by Cunningham (7). Rather, the proportion of expenses paid OOP declined, for example, for prescription drugs, outpatient care, and other health care services.
Trends in high OOP burden among people who are poor or near-poor were similar to those observed in people with public insurance. Trends in high OOP burden among people with high incomes were similar to those observed in people with private insurance. These findings were not surprising because there was substantial overlap between the poor and publicly insured groups and between the high-income and privately insured groups.
This study also provides an assessment of the impact of the change in the MEPS data editing rule for prescription drugs in 2007 on high OOP burden in 2007–2008. Although the impact might have been minimal in the general population, it was substantial among people with diabetes. Almost all the observed reductions in the proportions of people with high OOP burden in the publicly insured and poor and near-poor groups between 2005–2006 and 2007–2008 were because of the data editing rule change in 2007. However, the downward trend in high OOP burden remained even after adjusting for the changes in data editing.
Although the percentage of people with diabetes aged <65 years experiencing a high OOP burden declined for the publicly insured and poor and near-poor groups, as of 2011, 23% of all people with diabetes still faced a high family OOP burden. Because the number of people with diabetes almost doubled from 1997 to 2007, the absolute number of people with diabetes at risk for high OOP burden likely also increased substantially (12).
The current study has several limitations. First, as in any survey, responses to MEPS could be subject to recall and social desirability biases. Second, MEPS changed its data editing rule on prescription drugs in both 2007 and 2009, which could plausibly have introduced bias into the process of estimating OOP spending for prescription drugs compared with estimates derived at using the old data editing rules. We tested the impact of the 2007 rule change in a sensitivity analysis. Unfortunately, we could not directly test how much of the reduced OOP spending on prescription drugs during the 2009–2011 period could be attributed to the data editing rule change in 2009 as opposed to a real change in spending. Third, we used family pretax (gross) income rather than disposable (net) income to calculate OOP burden. However, another study using the same data found that whether using pretax or disposable income, trends in OOP burden remained essentially the same (2). Fourth, the current OOP burden measures included both diabetes- and nondiabetes-related expenses for people with diabetes and their family members. It is not possible to attribute high OOP burden entirely to diabetes. However, the trends in OOP expenses on health care services in people with diabetes is consistent with the trend in OOP burden for the whole family. Finally, some people might have had both private insurance and public insurance within a single year. For grouping purposes, we assigned them to the insurance type under which they were covered for the longer part of the year. However, a sensitivity analysis using different definitions for insurance categories showed that the impact of this grouping method was minimal.
In summary, in people with diabetes aged 18–64 years, we found a 5-percentage point decline between 2001 and 2011 in the proportion facing high OOP burden. When stratified by insurance status and family income, we found a decrease in disparity in OOP burden associated with insurance status and family income. However, the number of people with diabetes facing high OOP burden remained high. Because high OOP burden could be a barrier to treatment compliance and needed health care services and people with diabetes who do not receive adequate medical care are at substantial risk for costly and debilitating complications, policies that reduce this burden should be considered.
Acknowledgments
The findings and conclusions of this article are those of the authors and do not necessarily represent the official position of the Centers for Disease Control and Prevention.
Footnotes
Duality of Interest. No potential conflicts of interest relevant to this article were reported.
Author Contributions. R.L. and E.W.G. contributed to the study design and writing, review, and final approval of the manuscript. L.E.B. and S.S. contributed to the method, analysis, and drafting, review, and final approval of the manuscript. P.Z., O.K.D., and T.P.-C. contributed to the interpretation of the results and drafting, review, and final approval of the manuscript. R.L. is the guarantor of this work and, as such, had full access to all the data in the study and takes responsibility for the integrity of the data and the accuracy of the data analysis.
Prior Presentation. Parts of this study were presented in poster form at the 72nd Scientific Sessions of the American Diabetes Association, Philadelphia, PA, 8–12 June 2012.
References
- 1.Banthin JS, Cunningham P, Bernard DM. Financial burden of health care, 2001–2004. Health Aff (Millwood) 2008;27:188–195. doi: 10.1377/hlthaff.27.1.188. [DOI] [PubMed] [Google Scholar]
- 2.Cunningham PJ. The growing financial burden of health care: national and state trends, 2001–2006. Health Aff (Millwood) 2010;29:1037–1044. doi: 10.1377/hlthaff.2009.0493. [DOI] [PubMed] [Google Scholar]
- 3.Gabel JR, McDevitt R, Lore R, Pickreign J, Whitmore H, Ding T. Trends in underinsurance and the affordability of employer coverage, 2004–2007. Health Aff (Millwood) 2009;28:w595–w606. doi: 10.1377/hlthaff.28.4.w595. [DOI] [PubMed] [Google Scholar]
- 4.Schoen C, Collins SR, Kriss JL, Doty MM. How many are underinsured? Trends among U.S. adults, 2003 and 2007. Health Aff (Millwood) 2008;27:w298–w309. doi: 10.1377/hlthaff.27.4.w298. [DOI] [PubMed] [Google Scholar]
- 5.Bernard DS, Farr SL, Fang Z. National estimates of out-of-pocket health care expenditure burdens among nonelderly adults with cancer: 2001 to 2008. J Clin Oncol. 2011;29:2821–2826. doi: 10.1200/JCO.2010.33.0522. [DOI] [PMC free article] [PubMed] [Google Scholar]
- 6.Collins SR, Doty MM, Davis K, Schoen C, Holmgren AL, Ho A. The Affordability Crisis in US Health Care: Findings From the Commonwealth fund Biennial Health Insurance Survey. New York, NY: The Commonwealth Fund; 2004. [Google Scholar]
- 7.Cunningham PJ. Despite the recession’s effects on incomes and jobs, the share of people with high medical costs was mostly unchanged. Health Aff (Millwood) 2012;31:2563–2570. doi: 10.1377/hlthaff.2012.0148. [DOI] [PubMed] [Google Scholar]
- 8.Banthin JS, Bernard DM. Changes in financial burdens for health care: national estimates for the population younger than 65 years, 1996 to 2003. JAMA. 2006;296:2712–2719. doi: 10.1001/jama.296.22.2712. [DOI] [PubMed] [Google Scholar]
- 9.Agency for Healthcare Research and Quality. Medical Expenditure Panel Survey [article online] 2012 Available from http://meps.ahrq.gov/mepsweb. Accessed 26 November 2012. [PubMed]
- 10.Gellad WF, Donohue JM, Zhao X, Zhang Y, Banthin JS. The financial burden from prescription drugs has declined recently for the non-elderly, although it is still high for many. Health Aff (Millwood) 2012;31:408–416. doi: 10.1377/hlthaff.2011.0469. [DOI] [PMC free article] [PubMed] [Google Scholar]
- 11.Li R, Zhang P, Venkat Narayan KM. Self-monitoring of blood glucose before and after Medicare expansion among Medicare beneficiaries with diabetes who do not use insulin. Am J Public Health. 2008;98:358–364. doi: 10.2105/AJPH.2007.112185. [DOI] [PMC free article] [PubMed] [Google Scholar]
- 12.Sarpong EM, Bernard DM, Miller GE. Changes in pharmaceutical treatment of diabetes and family financial burdens. Med Care Res Rev. 2012;69:474–491. doi: 10.1177/1077558712442570. [DOI] [PubMed] [Google Scholar]
- 13.Bernard DM, Banthin JS, Encinosa WE. Health care expenditure burdens among adults with diabetes in 2001. Med Care. 2006;44:210–215. doi: 10.1097/01.mlr.0000199729.25503.60. [DOI] [PubMed] [Google Scholar]
- 14.Agency for Healthcare Research and Quality. Using appropriate price indices for analyses of health care expenditures or income across multiple years [article online] 2012 Available from http://meps.ahrq.gov/mepsweb/about_meps/Price_Index.shtml. Accessed 28 December 2012.
- 15.Agency for Healthcare Research and Quality. Using MEPS data for trend analysis [article online] 2011 Available from http://meps.ahrq.gov/mepsweb/data_stats/download_data/pufs/h126a/h126adoc.shtml#34UsingMEPS. Accessed 6 June 2012.
- 16.Zodet MW, Hill SC, Miller GE. Comparison of retail drug prices in the MEPS and MarketScan: implications for MEPS editing rules [article online] 2010 Available from http://meps.ahrq.gov/mepsweb/data_files/publications/workingpapers/wp_10001.pdf. Accessed 6 June 2012.
- 17.National Conference of State Legislatures. Use of generic prescription drugs and brand-name discounts & prescription drug agreements and volume purchasing- health cost containment [article online] 2012 Available from http://www.ncsl.org/research/health/prescription-drugs-overview-generics-brands.aspx. Accessed 22 August 2012.
- 18.Smith C, Cowan C, Heffler S, Catlin A. National health spending in 2004: recent slowdown led by prescription drug spending. Health Aff (Millwood) 2006;25:186–196. doi: 10.1377/hlthaff.25.1.186. [DOI] [PubMed] [Google Scholar]
- 19.The Health Strategies Consultancy; Duke University, The Fuqua School of Business. Medicaid cost containment and potential effects on diabetic beneficiaries: white paper [article online] 2003 Available from http://www.avalerehealth.net/research/docs/HSC_Diabetes_White_Paper_20031021.pdf. Accessed 16 August 2012.
- 20.National Conference of State Legislatures. Recent Medicaid prescription drug laws and strategies, 2001–2012 [article online] 2012 Available from http://www.ncsl.org/research/health/medicaid-pharmaceutical-laws-and-policies.aspx. Accessed 22 August 2012.
- 21.National Conference of State Legislatures. Medicaid payment reform [article online] 2014 Available from http://www.ncsl.org/research/health/medicaid-payment-reform.aspx. Accessed 13 January 2014.
- 22.Briesacher BA, Zhao Y, Madden JM, et al. Medicare Part D and changes in prescription drug use and cost burden: national estimates for the Medicare population, 2000 to 2007. Med Care. 2011;49:834–841. doi: 10.1097/MLR.0b013e3182162afb. [DOI] [PMC free article] [PubMed] [Google Scholar]
- 23.Liu FX, Alexander GC, Crawford SY, Pickard AS, Hedeker D, Walton SM. The impact of Medicare Part D on out-of-pocket costs for prescription drugs, medication utilization, health resource utilization, and preference-based health utility. Health Serv Res. 2011;46:1104–1123. doi: 10.1111/j.1475-6773.2011.01273.x. [DOI] [PMC free article] [PubMed] [Google Scholar]
- 24.Li R, Gregg EW, Barker LE, et al. Medicare Part D is associated with reducing the financial burden of health care services in Medicare beneficiaries with diagnosed diabetes. Med Care. 2013;51:888–893. doi: 10.1097/MLR.0b013e3182a53d95. [DOI] [PubMed] [Google Scholar]
- 25.The Council of State Governments. Medicaid 101:a primer for state legislators [article online] 2009 Available from http://www.csg.org/knowledgecenter/docs/Medicaid_Primer_final_screen.pdf. Accessed 14 January 2014.
- 26.Kesselheim AS, Fischer MA, Avorn J. Extensions of intellectual property rights and delayed adoption of generic drugs: effects on Medicaid spending. Health Aff (Millwood) 2006;25:1637–1647. doi: 10.1377/hlthaff.25.6.1637. [DOI] [PubMed] [Google Scholar]
- 27.US Food and Drug Administration. FDA approves first generic simvastatin [article online] 2006 Available from http://www.fda.gov/NewsEvents/Newsroom/PressAnnouncements/2006/ucm108675.htm. Accessed 16 January 2013.
- 28.National Conference of State Legislatures. State pharmaceutical assistance programs [article online] 2013 Available from http://www.ncsl.org/research/health/state-pharmaceutical-assistance-programs.aspx. Accessed 15 August 2013.