Significance
A method for absolute quantification of proteins for targeted proteomics is developed. It introduces a simple and high-throughput synthesis of internal standards for peptide quantification and thereby facilitates both multiplexed and sensitive absolute quantification of proteins. Application of this method to the systems-level dynamic analysis of core circadian clock proteins and detection of internal body time using quantified values of circadian clock proteins is shown. The results demonstrate the validity of the developed method in which quantified values from wild-type mice can predict the endogenous state of the circadian clock.
Keywords: absolute quantification, mass spectrometry, cell-free protein synthesis system, mammalian circadian clock protein, targeted proteomics
Abstract
Absolute values of protein expression levels in cells are crucial information for understanding cellular biological systems. Precise quantification of proteins can be achieved by liquid chromatography (LC)–mass spectrometry (MS) analysis of enzymatic digests of proteins in the presence of isotope-labeled internal standards. Thus, development of a simple and easy way for the preparation of internal standards is advantageous for the analyses of multiple target proteins, which will allow systems-level studies. Here we describe a method, termed MS-based Quantification By isotope-labeled Cell-free products (MS-QBiC), which provides the simple and high-throughput preparation of internal standards by using a reconstituted cell-free protein synthesis system, and thereby facilitates both multiplexed and sensitive quantification of absolute amounts of target proteins. This method was applied to a systems-level dynamic analysis of mammalian circadian clock proteins, which consist of transcription factors and protein kinases that govern central and peripheral circadian clocks in mammals. Sixteen proteins from 20 selected circadian clock proteins were successfully quantified from mouse liver over a 24-h time series, and 14 proteins had circadian variations. Quantified values were applied to detect internal body time using a previously developed molecular timetable method. The analyses showed that single time-point data from wild-type mice can predict the endogenous state of the circadian clock, whereas data from clock mutant mice are not applicable because of the disappearance of circadian variation.
Quantitative information on protein expression levels is important to define the dynamic state of cells. Accurate measurements of absolute protein abundance in cells can be performed by emerging quantitative proteomics approaches such as selected reaction monitoring (SRM) or high-resolution mass spectrometry (MS) in combination with isotope dilution strategies (1). The methods require a known concentration of internal standards, typically prepared as the tryptic digests of target proteins, which are labeled with isotopically heavy atoms. The standard peptides are combined with samples containing the same peptides, and the mixtures are analyzed by MS. Quantities of peptides, which represent the target proteins, can be calculated by comparing ion intensities for isotopically light and heavy peptides.
The preparation of isotope-labeled peptides plays a major role in these approaches. The most common way to prepare such peptides is by absolute quantification, which uses chemical synthesis of peptides containing isotopically labeled amino acids (1, 2). It provides not only normal proteotypic peptides, but also modified peptides that mimic posttranslational modification. However, the method has several limitations originating from the use of the chemical synthesis. It requires individual peptide synthesis using large amounts of isotopically labeled amino acids as substrates. Difficulties of synthesis vary depending on the peptide sequence. Due to these features, it is difficult to reduce the cost per peptide, which leads to difficulties in preparing large numbers of peptides for the quantification. Multiple peptide production enables not only the multiplexed protein quantification but also highly sensitive detection and quantification of the proteins of interest by selecting effective internal standards with good signal/noise ratio from candidate peptides (3).
Several methods using a cellular gene-expression system have been developed in recent years for multiple peptide production. Multiple peptides can be obtained by the proteolysis of recombinantly expressed full-length proteins of interest (4, 5) or artificial proteins that compose a set of proteotypic peptides concatenated with each other (6, 7). These peptides are metabolically labeled with stable isotopes through Escherichia coli or other cellular gene-expression systems, allowing them to function as internal standards. The methods have advantages in that multiple peptides are produced from a single construct, which can be applied to both multiplexed and sensitive quantification.
A cell-free protein synthesis system is a useful tool for the expression of such proteins (3, 5, 6, 8). The cost for expensive stable isotope-labeled amino acids can be reduced because the volume for reaction mixtures is much lower than for culturing media. Protein expression and purification occurs in a high-throughput manner because there is no need for culturing, harvesting, and disrupting cells. Notably, cellular metabolism causes isotope scrambling and dilution, which is a problem where the homogeneity of isotope-labeled peptides is reduced due to conversion of labeled amino acids into others, or vice versa (9). This problem can be overcome in a cell-free system by artificial adjustment of the system components (10).
Here we describe a workflow for multiplexed absolute quantification of proteins using SRM-based targeted proteomics. The workflow, termed MS-based Quantification by isotope-labeled Cell-free products (MS-QBiC), has several features that expand advantages of the internal standard synthesis using a cell-free system. It is based on the use of the PURE system, a reconstituted cell-free protein synthesis system (11). Because the PURE system consists of purified factors and enzymes for E. coli translation machinery, synthesized peptides are rarely challenged by protease degradation that usually occurs in cell-extract systems. Additionally, isotope scrambling or dilution is avoided without the need to adjust system components (10). The developed workflow was applied to the absolute quantification of core circadian clock proteins in mouse livers across the circadian day. To obtain optimal peptides for the detection and quantification by the SRM-based targeted proteomics analysis, we synthesized 120 peptides for 20 circadian clock proteins. All of the peptides were successfully synthesized from PCR-amplified genes by the PURE system. Dynamic changes of copy numbers for 16 proteins during the circadian day were successfully quantified, demonstrating the potential of this method for the multiplexed targeted proteomics approaches.
Results
Design of the MS-QBiC Workflow.
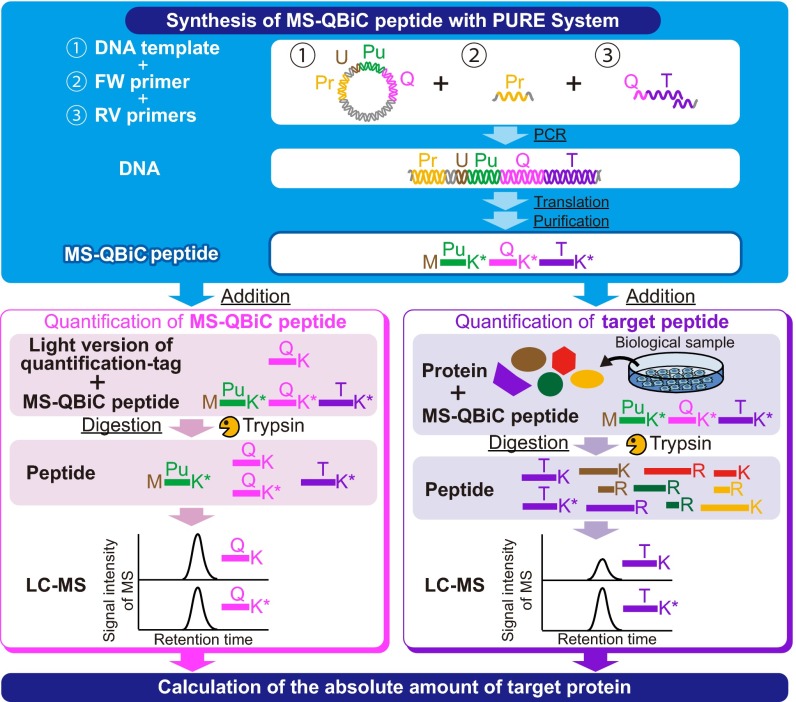
To develop a simple strategy for the multiplexed absolute quantification of protein using SRM-based targeted proteomics, we devised the MS-QBiC workflow (Fig. 1). This method takes advantage of the PURE system, a reconstituted cell-free protein synthesis system (11) for internal peptide synthesis without peptide degradation and without isotope scrambling or dilution (10). It is also noteworthy that the PURE system is suitable for protein or peptide expression from linear DNA, which enables the direct addition of the PCR-amplified gene into reaction mixtures. Thus, gene preparation, peptide synthesis, and purification can be performed in a simple and a high-throughput manner. The whole process can be carried out in 1 d from one or two DNA primers per peptide.
Fig. 1.
Development of the MS-QBiC workflow. Schematic description of the MS-QBiC workflow. A purification tag, a quantification tag, and a tryptic peptide of the target protein (target peptide) are sequentially arrayed as a single peptide sequence (MS-QBiC peptide). The target peptide sequence is attached by one- or two-step PCR. The MS-QBiC peptide is synthesized in the PURE system in the presence of stable isotope-labeled Arg and Lys for isotopic labeling both the quantification tag and the target peptide. Trypsin digestion of purified MS-QBiC peptide produces equal amounts of isotopically labeled quantification tag and target peptide. The quantification tag is used to measure purified MS-QBiC peptide, and the target peptide is used as an internal standard for the target protein quantification.
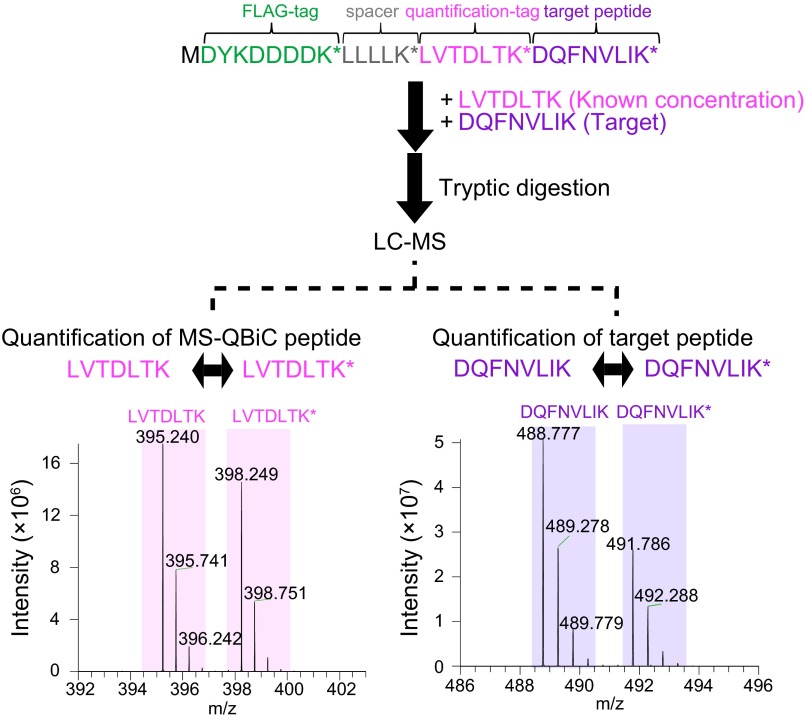
After examination and validation of the workflow by several liquid chromatography (LC)-MS analyses (Fig. S1 and SI Results), the MS-QBiC peptide was designed as shown in Fig. S2. A FLAG tag was selected as a purification tag and the quantification tag was obtained from the tryptic digest of bovine serum albumin (BSA), which was attached downstream of the FLAG tag and a spacer peptide sequence. The gene for the peptide was cloned into the plasmid vector comprising a T7 promoter and the 5′-UTR sequence for the E. coli translation system. The target peptide was designed to be directly attached to the quantification tag by PCR using the plasmid as a template. The MS-QBiC peptide can be quantified by comparing ion peak intensities of the stable isotope-labeled quantification tag with those of the chemically synthesized quantification tag (Fig. S2, Lower Left) or the tryptic digest of commercially available BSA (Fig. S1D). The quantified MS-QBiC peptide can be then used to quantify the target peptide by comparing the intensities of stable isotope-labeled target peptide in MS-QBiC peptide with those of the nonlabeled target peptide in the sample (Fig. S2, Lower Right).
Fig. S1.
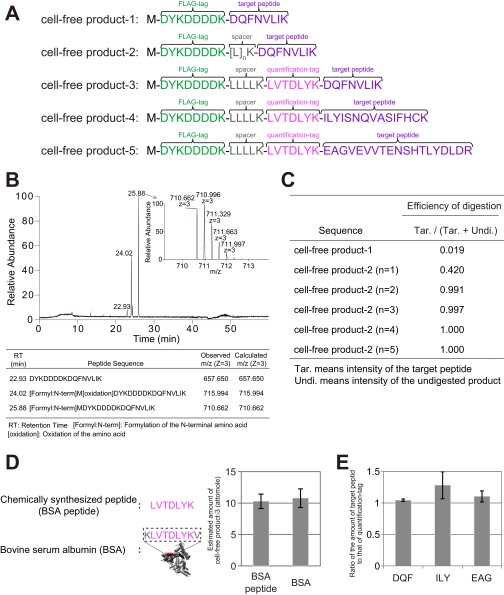
Examination and validation of the MS-QBiC workflow. (A) Amino acid sequences of test peptides used for the examination and validation of the MS-QBiC workflow. (B) LC-MS analysis of the synthesized cell-free product-1. A base peak chromatogram of the purified peptide and a mass spectrum of the ion peak with highest intensity (Inset) are shown. The table indicates three identified peptides that correspond to the three ion peaks in the chromatogram. (C) Effect of spacer sequence on the tryptic digestion efficiency. Digestion efficiency was calculated as the ion peak intensities of the digested peptide divided by the sum of those of the digested and undigested peptide. (D) Measuring the abundance of the quantification tag. Stable isotope-labeled cell-free product-3 was mixed with chemically synthesized LVTDLYK peptide (BSA peptide) or the tryptic digests of commercially available BSA. Concentration of the quantification tag was determined by comparing ion peak intensities of the stable isotope-labeled quantification tag with nonlabeled peptides. (E) Validation of the quantification of a target peptide. Stable isotope-labeled cell-free product-3, -4, and -5 were mixed with the chemically synthesized target peptides DQFNVLIK (DQF), ILYISNQVASIFHCK (ILY), and EAGVEVVTENSHTLYDLDR (EAG), respectively. Concentration of the target peptide was determined by comparing ion peak intensities of the stable isotope-labeled target peptide with nonlabeled peptides.
Fig. S2.
Peptide quantification by the MS-QBiC method. Quantification of the quantification tag and the target peptide using LC-MS. Purified MS-QBiC peptide (Upper) was digested by trypsin. The quantification tag was quantified by comparing ion peak intensities of the stable isotope-labeled quantification tag with those of the chemically synthesized quantification tag (Lower Left). The target peptide was quantified by comparing the stable isotope-labeled target peptide with the nonlabeled target peptide (Lower Right). The target peptide was derived from CLOCK, a circadian protein.
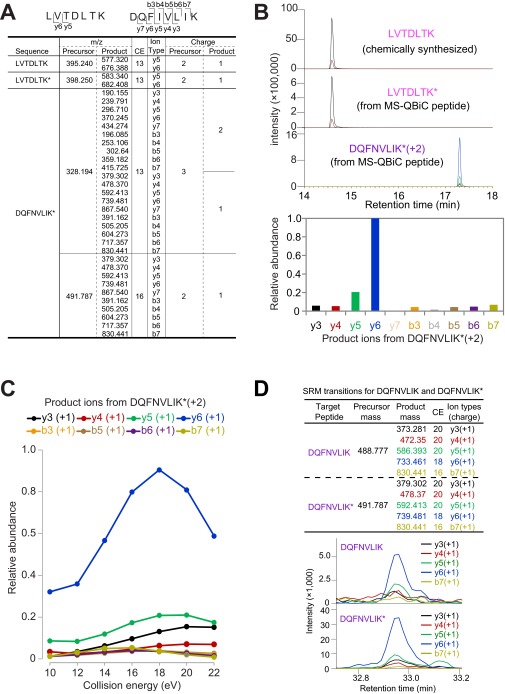
The workflow was further examined for SRM analysis. Both the quantification of the MS-QBiC peptide and the data collection for the development of the SRM method for the target peptide (Fig. S3 A–C) were carried out by the LC-SRM analysis using mixtures containing digested MS-QBiC peptide and the chemically synthesized quantification tag. The developed SRM method was then applied to target peptide quantification in mouse liver. The quantified MS-QBiC peptide was mixed with cellular protein extracts from a mouse liver and subjected to tryptic digestion and LC-SRM analysis. By comparing the ion peak intensities of the fragment peptides, the quantification of the target peptide could be performed (Fig. S3D), indicating that the MS-QBiC workflow can be applied to the SRM analysis.
Fig. S3.
Application of the MS-QBiC workflow to the SRM analysis. (A) Development of the primary SRM method for screening of optimal SRM transitions. The table shows an example for cell-free product-1. Optimal SRM transitions for LVTDLTK and LVTDLTK* (the asterisk indicates that the amino acid is isotope-labeled) to quantify the MS-QBiC peptide and primary SRM transitions for DQFNVLIK* to quantify the target peptide are shown in the table. The primary transitions were developed as follows: Both doubly and triply charged monoisotopic precursors for the target peptide were considered. For the doubly charged precursors, singly charged monoisotopic products y3 to yn−1 were monitored (n represents the number of residues of the peptide). For the triply charged precursors, both singly and doubly charged monoisotopic products y3 to yn−1 were monitored. In the case that the peptide was short enough (n ≤ 10), b ions were used according to the same rule as y ions. (B) SRM chromatograms of LVTDLTK (Upper Top), LVTDLTK* (Upper Middle), and DQFNVLIK* (Upper Bottom). (C) Optimization of collision energy for each SRM transition. (D) Quantification of the target peptide in a mouse liver using LC-SRM. The SRM transitions (Upper) were developed by using purified MS-QBiC peptide. The target peptide was quantified by comparing ion peak intensities of the fragment peptides from the stable isotope-labeled target peptide (Lower ) with the nonlabeled target peptide in mice livers (Lower). CE, collision energies.
Quantification of Core Circadian Clock Proteins.
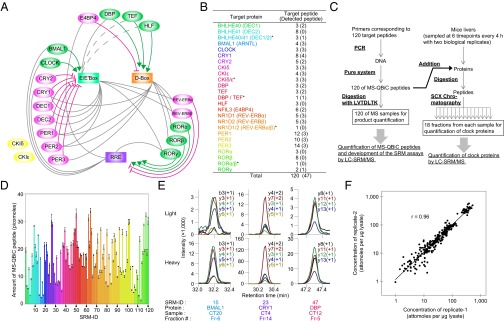
The workflow was applied to the quantification of core circadian clock proteins. The mammalian circadian clock is driven through complex feedback and feed-forward loops regulated by a variety of circadian clock proteins and three clock-controlled elements (12–15) (Fig. 2A). Although quantitative analyses of mRNA-level gene-expression of circadian clock proteins have been performed previously (13, 16), direct quantification of these proteins across the circadian day is essential for the accurate description and simulation of circadian clock networks. According to previous mRNA-level gene-expression profiles (13, 16), 20 circadian clock proteins were examined and 120 tryptic peptides were selected as target peptides for quantification of these proteins (Fig. 2 A and B, Datasets S1 and S2, and SI Results). Note that some peptides overlapped a common region of similar genes for DEC1 (BHLHE40) and DEC2 (BHLHE41), CKIδ and CKIε, REV-ERBα (NR1D1) and REV-ERBβ (NR1D2), RORα and RORβ, and DBP and TEF.
Fig. 2.
Quantification of 20 circadian clock proteins in mice livers. (A) The transcriptional circuit of the mouse circadian clock. Clock-controlled elements (CCE; rectangles), transcriptional factors (green or magenta ovals) with their effects (lines), and kinases (yellow ovals) are shown in the circuit. Green ovals represent activators, and magenta ovals represent repressors. Gray lines indicate that the CCE is located on the promoter (or enhancer) regions of the corresponding transcription factor genes. Dashed lines indicate that the putative CCE is encoded. (B) A list of target proteins to be quantified. The numbers indicate the number of prepared target peptides and, in parentheses, the number of detected target peptides in the LC-SRM analyses. An asterisk indicates that target peptides are shared between two target proteins. (C) An experimental workflow for the absolute quantification of 20 circadian clock proteins. (D) Yields of 120 MS-QBiC peptides synthesized in the PURE system. The colors of each bar are same as those used in B. (E) Examples of SRM chromatograms corresponding to target peptides derived from clock proteins (Upper) and their internal standards (Lower). (F) Comparison of the quantified values between two biological replicates. Correlation coefficient (r) is indicated in the plot.
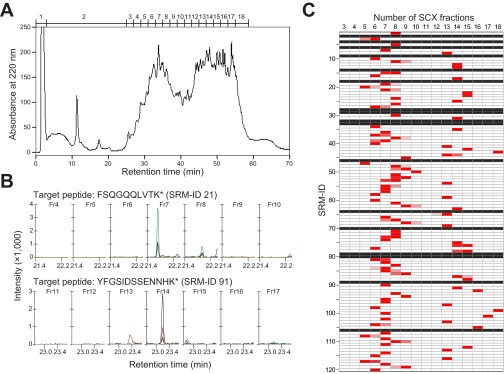
An experimental workflow used for quantification of circadian clock proteins is shown (Fig. 2C). Mice were entrained in a 12-h light/12-h dark (LD) cycle for 2 wk. After transferring to constant darkness, mice livers were collected at six time points with 4-h intervals at circadian times (CT0, CT4, CT8, CT12, CT16, and CT20). Livers from two mice were collected at each time point. The 120 synthesized and purified MS-QBiC peptides were mixed with protein extracts from the mice liver. The mixtures were subjected to tryptic digestion and then prefractionated with super cation exchange (SCX) chromatography. The resultant 18 fractions were individually subjected to LC-SRM analysis (Fig. S4 and Dataset S2), and quantification of each peptide was performed. Prefractionation by SCX was adopted in the workflow because it was essential for the detection of proteins with low copy numbers (17, 18).
Fig. S4.
Prefractionation of tryptic digests composed of cellular protein extracts from mice livers and MS-QBiC peptides using SCX chromatography. (A) A chromatogram of the tryptic digests separated with the SCX chromatography. Numbers above the chromatogram indicate numbers of the SCX fractions. (B) Examples of the SRM chromatogram. SRM chromatograms of FSQGQQLVTK* (SRM-ID 21, Upper) contained in the SCX fractions from no. 4 to no. 10 and those of YFGSIDSSENNHK* (SRM-ID 91, Lower) in the fractions from no. 11 to no. 17 are shown. (C) Distribution of the signal intensities corresponding to the target peptides originated from the MS-QBiC peptide in the SCX fractions from no. 3 to no. 18. A red color indicates that the corresponding signal was detected in the fraction. Black rows indicate that the signal was not able to be detected in any fraction.
Quantification of the quantification tag showed that all of 120 MS-QBiC peptides were successfully synthesized from PCR-amplified genes by the PURE system. The amounts of purified peptide from the same volume of reaction mixtures (25 µL) ranged between 1.4 and 33.3 pmol (Fig. 2D). Although the yields were variable, implying dependency on the sequence of the target peptide, they were sufficient for our SRM-based quantification. These data demonstrate the versatility of our workflow for many peptides regardless of their sequence.
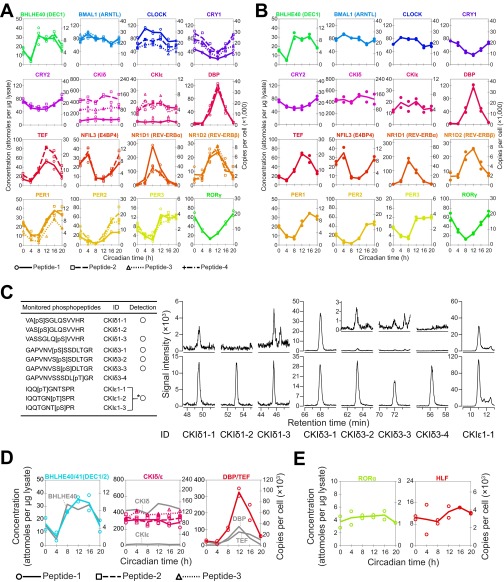
Quantification of the target peptide (Fig. 2E) showed that 47 peptides (42 peptides were derived from a single protein and 5 peptides were in the common region of two proteins) could be used for detection of circadian clock proteins in mice liver samples (Fig. 2B and Dataset S2). The remaining 73 peptides were classified into two classes: in one class, internal standards were not detected probably because of unsuccessful separation with SCX chromatography (black rows in Fig. S4C) and in the other class signal/noise ratios were not high enough for detection of endogenous targets. The quantified values of 47 peptides at six time points were compared between two biological replicates by a double-logarithmic plot (Fig. 2F). The quantified values were highly correlated between replicates, indicating the biological reproducibility of circadian clock protein dynamics as well as the technical reproducibility of the developed workflow. Fifteen proteins were detected with two or more internal standards whereas one protein, RORγ, was detected with a single internal standard (Fig. 2A and Fig. S5A). Peptides for the common region of DEC1 (BHLHE40) and DEC2 (BHLHE41), CKIδ and CKIε, and DBP and TEF were also successfully quantified, but four proteins [DEC2 (BHLHE41), HLF, RORα, and RORβ] were not detected clearly in our analysis (Fig. S5 D and E and SI Results).
Fig. S5.
A summary of the expression levels of each peptide. (A, B, D, and E) Concentrations are expressed as attomol per microgram of lysate (Left axis) or copies per cell (Right axis). Copy numbers were calculated by estimating a total amount of proteins per cell is 0.5 ng (19). (A) Quantification of each of the peptides from a protein. Time courses of the quantified peptides arranged according to their parental proteins are shown. The correspondence of detected peptides to plots is shown in Dataset S2. (B) Time course of the quantified proteins calculated from two biological replicates. Closed circles indicate average peptide concentrations derived from same protein in each biological replicate. (C) SRM detection of phosphorylated peptide-1 and peptide-3 from CKIδ and peptide-3 from CKIε. Monitored phosphopeptides are summarized in the table (Left). SRM chromatograms (Right) corresponding to peptides derived from mouse liver (Upper) and isotope-labeled internal standards (Lower) are shown. An asterisk (*) indicates that the peptides were not separated by chromatography and therefore could not be differentiated from each other in the chromatogram. (D) Quantification of peptides for common region of two circadian clock proteins. Time courses of the quantified peptides for common region of DEC1 (BHLHE40) and DEC2 (BHLHE41), CKIδ and CKIε, and DBP and TEF are shown. The correspondence of detected peptides to plots is shown in Dataset S2. Gray lines indicate the time course of quantified parental proteins. (E) Quantification of peptides with low signal intensities. Time courses of the peptides for HLF and RORα are shown.
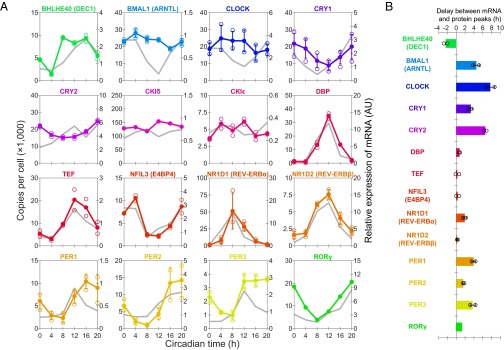
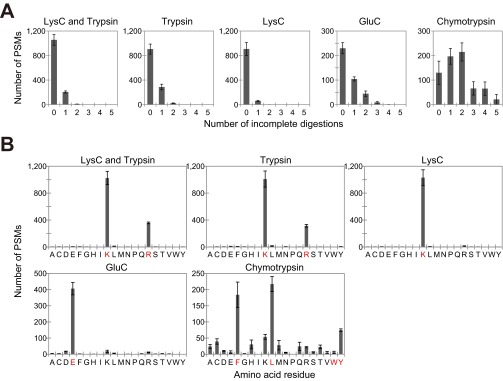
Time courses for the concentrations of 16 proteins (Fig. 3A) were shown as averaged peptide concentrations derived from same protein with errors between peptides. The differences in concentration between peptides (Fig. S5A and Dataset S3) were relatively higher than those between biological replicates (Fig. S5B and Dataset S3). Various factors, such as posttranslational modification, the presence of unknown protein isoforms, and inefficient or missed cleavages by the proteolysis, in addition to measurement error itself, may cause these differences, which are common to MS-based absolute quantification (20). Despite these problems, the data showed similar values from peptides derived from same protein, which suggests that the observed values reflect absolute copy numbers in cells. Six proteins [DEC1 (BHLHE40), CRY2, DBP, CKIε, TEF, and NFIL3 (E4BP4)] were quantified with only two target peptides, and two proteins (CKIδ and RORγ) were quantified with only a single peptide. Although target peptides were selected from as many as possible according to our criteria (Dataset S2 and SI Results), the number of detected peptides depends on both a trypsin cleavage site in the amino acid sequence of the protein and the signal/noise ratio of each target peptide in the SRM analysis. The use of alternative proteases may increase the number of usable peptides for more reliable quantification. However, absolute quantification depends on the efficiency and specificity of the selected proteases, which is highest with the use of a tandem LysC (Lysyl Endopeptidase)/trypsin cleavage (Fig. S6). Thus, this method is currently the best way for MS-based protein quantification (21) and our studies (SI Results). To show errors between peptides for the six proteins, maximum and minimum quantified values from each measurement were additionally plotted in the graph (Fig. 3A). It should be noted that peptide-1 and peptide-3 from CKIδ and peptide-1 from CKIε (Fig. S5A) were excluded from protein quantification. The concentrations of these peptides were consistently lower compared with the maximum peptide concentration for each protein, i.e., the coefficient of variation between peptides was more than 50% at all time points (Dataset S3). Additional experiments showed that these peptides were phosphorylated (Fig. S5C), which indicated that the peptides were not suitable for quantification. Phosphorylation of peptide-1 from CKIε was also reported previously in phosphoproteomics analyses including that of mice liver (22, 23).
Fig. 3.
A summary of the expression levels of circadian clock proteins and their corresponding mRNA. (A) Time course of the quantified proteins with their corresponding mRNA. Expression levels of the protein are shown in the same color as used in Fig. 2B. Concentrations are expressed as copies per cell (left axis). Copy numbers were calculated by assuming that the total amount of protein per cell is 0.5 ng (19). Bars on the graph indicate the SD of quantified values using three or more internal standard peptides. Open circles indicate maximum and minimum quantified values using two or more peptides. Relative expressions of mRNA, which are the replots of Fig. S7, are shown in gray (right axis). (B) Phase delay of the variations between circadian clock proteins and their corresponding mRNA. The phases of each variation were calculated by 24-h cosine curve fitting to time-course data of each internal standard peptide and mRNA expression (Dataset S3). The bars indicate the SD of calculated phases of proteins using three or more internal standard peptides. Open circles indicate the maximum and minimum phase delay calculated from the phases of proteins using two or more internal standard peptides.
Fig. S6.
Digestion efficiency and specificity of alternative proteases. BSA digests, which were prepared by both trypsin and LysC (Lysyl Endopeptidase), trypsin, LysC, GluC (Glutamyl endopeptidase), or chymotrypsin, were analyzed by LC-MS/MS. The numbers of PSMs were classified by the number of incomplete digestions (A) to show efficiency and by the C-terminal amino acid residues of the identified peptides (B) to show specificity of selected proteases. The amino acid residues specific to each protease are highlighted in red.
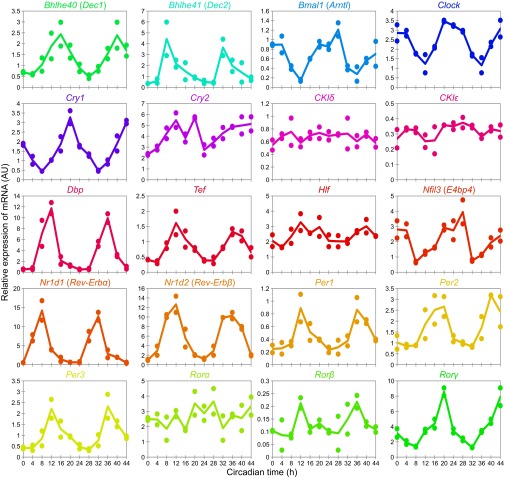
The relative abundance of the mRNA corresponding to each protein, obtained by quantitative PCR (qPCR) using livers from same samples (Fig. S7), is additionally shown in the time course in Fig. 3A, which shows that copy number of the 14 proteins, as well as the abundance of mRNA, fluctuated across the circadian day except for CKIδ and CKIε (Dataset S3). The phase differences between the proteins and mRNA, calculated by a 24-h cosine curve fitting to the time-course data, varied with each protein (Fig. 3B). There was relatively little phase delay for some proteins [DEC1 (BHLHE40), DBP, TEF, E4BP4 (NFIL3), REV-ERBα (NR1D1), REV-ERBβ (NR1D2), PER2, and RORγ], indicating that these protein levels are governed mainly by mRNA abundance. Phase differences were relatively large for BMAL1, CLOCK, CRY1, CRY2, PER1, and PER3, suggesting that these expression levels are regulated through complicated processes, including posttranscriptional regulation, translation control, posttranslational modification, and degradation (24–28). These observations demonstrated that the direct quantification of proteins is essential for the description of protein-level dynamics of biological systems.
Fig. S7.
Time course of the relative expression levels of mRNA for 20 circadian clock genes. Expression levels of each mRNA were quantified by qPCR with two biological replicates.
Circadian variation of PER1, PER2, CRY1, and CRY2 was investigated previously by Western blot analyses (24). The time points for the maximum and minimum quantity of these proteins in that report corresponded well with this study. Both studies showed that the amplitudes of PER1 and PER2 were larger compared with CRY1 and CRY2. In contrast, significantly high variations of BMAL1 and CLOCK expression level observed in the Western blot analysis were not observed in our results. Although we have no explanation for this inconsistency, our observations suggested that the amplitude of the variation of these proteins was relatively low. It is noteworthy that the copy numbers and variations of these proteins matched each other, which reflects that they function through the formation of a heterodimer (29). It is interesting that these copy numbers also matched CRY1 at CT0, the peak time for CRY1. A recent report suggested that the three proteins form a ternary complex to inhibit the E/E′-Box promoters at this time point (30). Finally, the mRNA-level expression of all of the proteins, except for CKIδ and CKIε, is known to fluctuate across the circadian day (13), which is consistent with our analysis.
Construction of a Molecular Timetable.
The quantified values of peptides for 14 circadian clock proteins except for CKIδ and CKIε showed circadian rhythmicity (Dataset S3). The time points for maximum or minimum quantity varied among the proteins. Our previous studies demonstrated that such data sets can provide a molecular timetable that acts as a reference for body-time (BT) detection from only one or two time points (31–33). BT detection has been performed for mRNA-level gene-expression profiles of mouse cells and the mouse and human blood metabolite profiles. In the present study, the method was further applied for protein-level expression profiles using the quantified values of each peptide to show whether they indicate the endogenous state of the circadian clock.
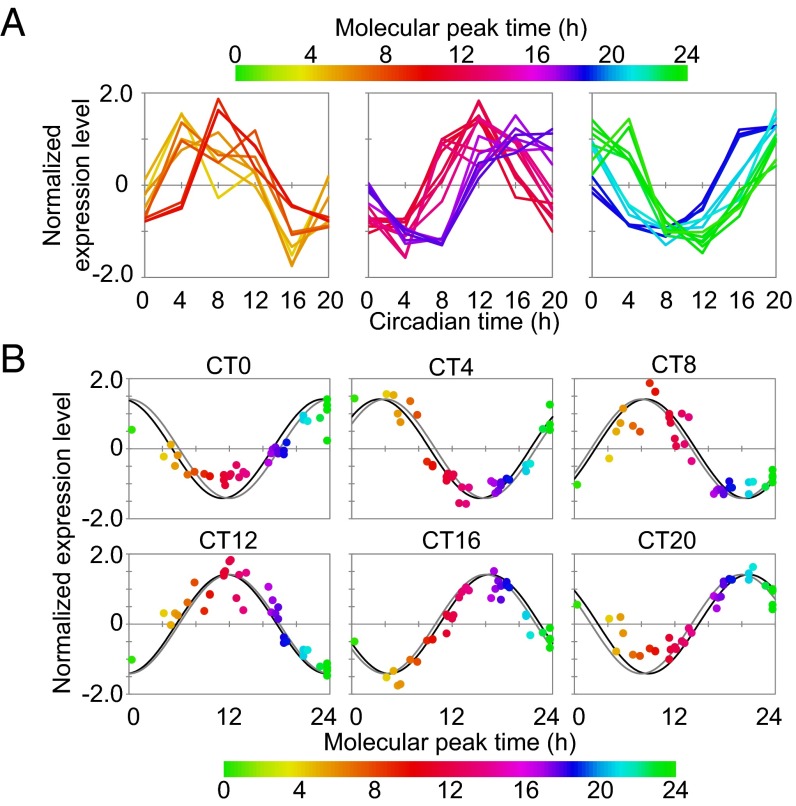
To construct a molecular timetable, the quantified values of 36 peptides for 14 circadian clock proteins at each time point were normalized according to the previous study. Peak time of each peptide was calculated by the time-course data of the normalized values (Fig. 4A and Dataset S3), which indicated the molecular timetable of each peptide. The calculated peak time corresponded well if the peptide originated from a same protein, suggesting that the molecular timetable of each peptide represented that of the corresponding protein. The normalized quantity of each peptide at each time point was plotted against the calculated molecular timetable, and then 24-h period cosine curves were fitted to these plots, where the peak time of the best-fitted curve indicated the estimated BT (Fig. 4B). The estimated BT matched well with the actual circadian phase with a mean error of 0.67 ± 0.29 h, demonstrating that a molecular timetable can be constructed for the protein-level expression profiles.
Fig. 4.
Molecular timetable based on the protein expression of core clock genes. (A) Time course of normalized expression levels of peptides. The colors—in ascending order from green to orange (CT2-10, Left), from orange to purple (CT10-16, Center), and from purple to green (CT16-2, Right)—were assigned to represent the molecular peak time, which corresponds to the molecular timetable of each peptide. The color code is represented above the diagrams. (B) Expression profiles of peptides at each circadian time point. Normalized expression levels of peptides at each circadian time point are plotted against their molecular peak time. Best-fitted cosine curves (black) and those based on the actual circadian time point (gray) are shown. The peak time of the best-fitted curves indicates the estimated BT.
BT Detection in Wild-Type and Clock Mutant Mice.
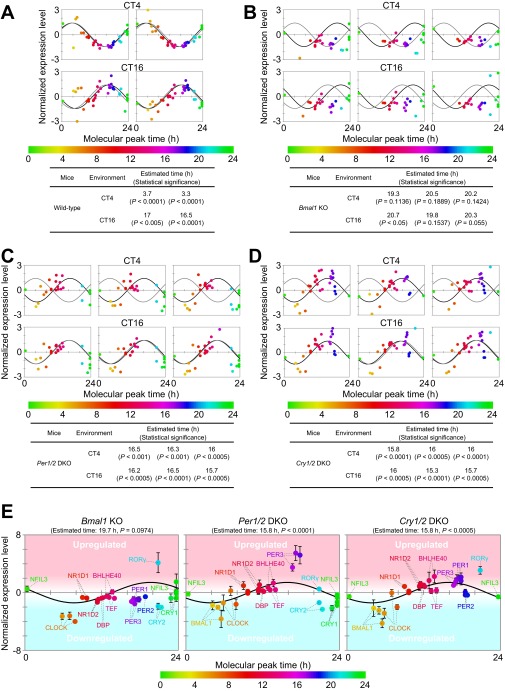
To validate the molecular timetable based on the protein-level expression profiles, mice livers were further collected at CT4 and CT16 with two biological replicates. The quantified values of 36 peptides from livers were applied to BT estimation using the molecular timetable method (Fig. S8A). The livers at CT4 were estimated to be 3.7 and 3.3 h and those at CT16 to be 17 and 16.5 h, respectively, which were close to the actual circadian phase.
Fig. S8.
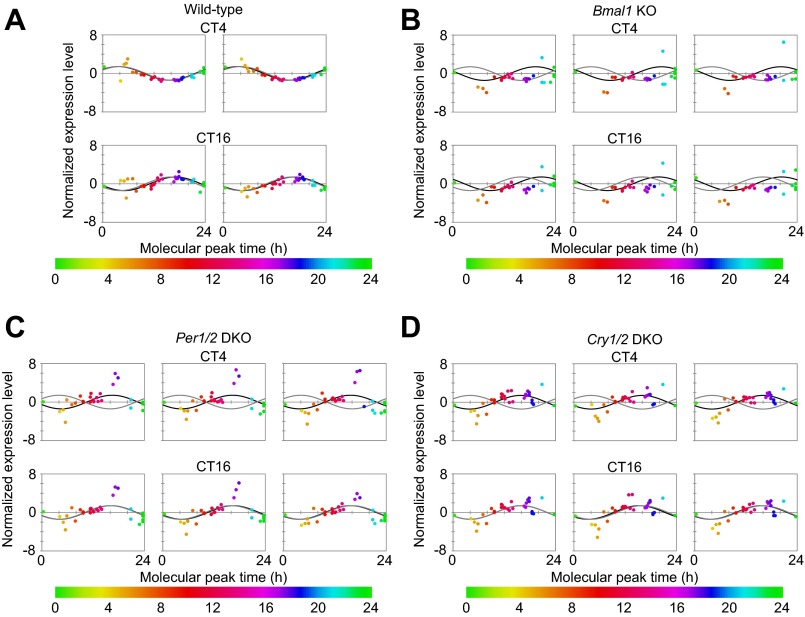
BT detection of wild-type and clock mutant mice by molecular timetable methods using a single-time-point data set. BT of (A) wild-type, (B) Bmal1 KO, (C) Per1/2 DKO, and (D) Cry1/2 DKO mice at CT4 and CT16 was estimated using datasets of expression profiles of peptides. Data sets were obtained with two (wild-type) and three (mutant) biological replicates. Best-fit cosine curves (black) and those based on the actual circadian time point (gray) are shown. The peak time of the best-fit curves indicates the estimated BT, which is also shown with its statistical significance. Statistical significance was obtained by estimating the goodness of the Pearson correlation in the cosine curve fitting of the experimental profile by comparing with those of 10,000 random profiles (details are described in SI Materials and Methods). The colors, in ascending order from green to red to blue, represent the molecular peak time, which corresponds to the molecular timetable of each peptide. The color code is represented below the diagrams. CT was defined as “extrapolated entrained time of mice in a LD cycle before sampling.” (E) Averaged expression profiles of peptides in Bmal1 KO, Per1/2 DKO, and Cry1/2 DKO mice at both CT4 and CT16 [normalized expression levels at CT4 (n = 3) and CT16 (n = 3) are averaged]. Error bars indicate SDs. Parental proteins of each peptide are designated.
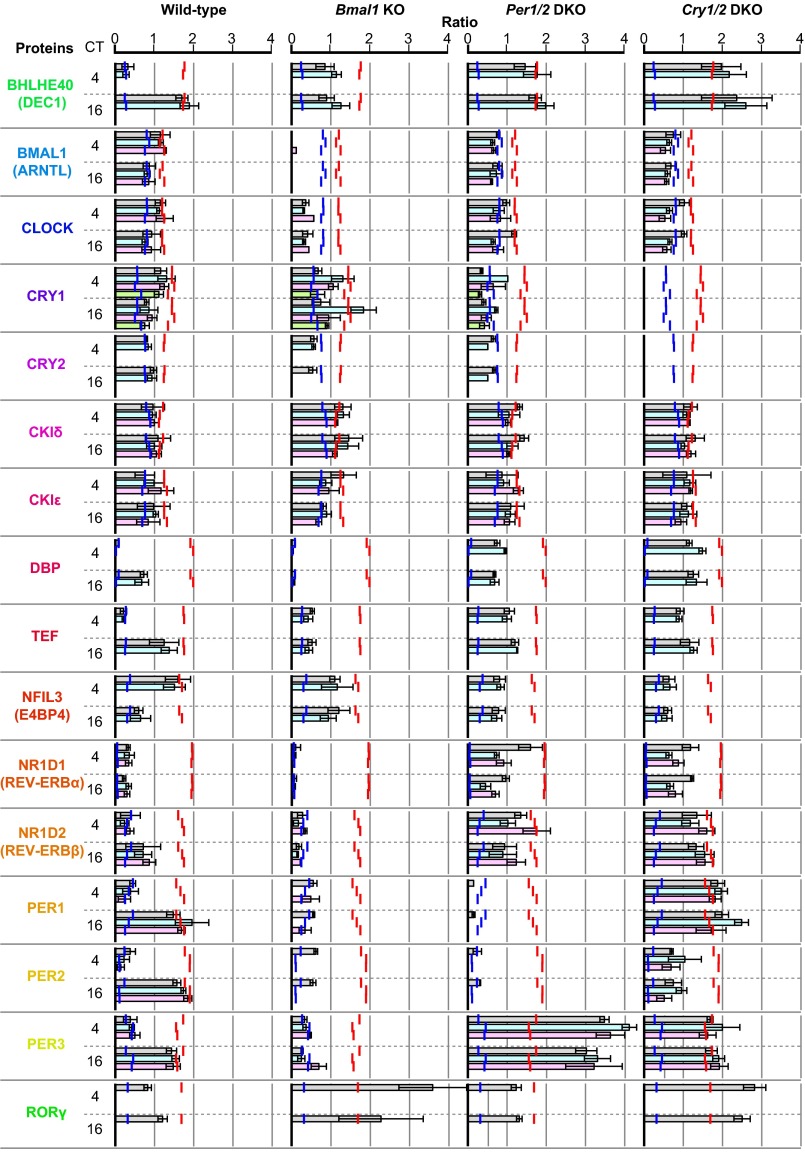
The circadian clock proteins in clock mutant mice were additionally quantified using the MS-QBiC method. Livers from three knockout (KO) or double knockout (DKO) mice (Bmal1 KO, Per1/2 DKO, and Cry1/2 DKO), which were previously shown to have deficiency in the circadian rhythmicity (34–36), were collected at CT4 and CT16, respectively, with three biological replicates. Quantified values of 16 proteins based on the quantification of 47 peptides showed a markedly different behavior compared with those of the wild-type mice (Fig. S9 and SI Results). The large differences of the expression level of DEC1 (BHLHE40), DBP, TEF, E4BP4 (NFIL3), PER1, PER2, and PER3 between CT4 and CT16 in wild-type mice were diminished in the mutant mice, consistent with the deficiency in circadian rhythmicity.
Fig. S9.
Expression levels of circadian clock proteins in clock mutant mice. Livers from three knockout mice (Bmal1 KO, Per1/2 DKO, and Cry1/2 DKO) were collected at CT4 and CT16 with three biological replicates. Relative concentrations of each peptide, in which the concentration was divided by the median value of that across the circadian day in the wild type, are summarized according to parental proteins. Red and blue lines indicate the maximum and minimum concentration of the peptides across the circadian day in wild type, respectively. CT was defined as “extrapolated entrained time of mice in a LD cycle before sampling.”
The quantified values of 36 peptides for 14 circadian clock proteins were further applied to BT estimation of clock mutant mice using the molecular timetable of the wild-type mice as a reference. The plots of the normalized quantity of each peptide against the molecular timetable were similar between CT4 and CT16 in each sample and indicated the same estimated time, which reflects a deficiency in circadian rhythmicity (Figs. S8 B–D and S10). Considering that the variation of the expression of circadian clock proteins was diminished in the mutant mice (Fig. S9), similar profiles between CT4 and CT16 may suggest that the expression level of these proteins is constant across the circadian day (Fig. S8E).
Fig. S10.
Expression profiles of peptides used for the BT detection of wild-type and mutant mice. Profiles of (A) wild-type, (B) Bmal1 KO, (C) Per1/2 DKO, and (D) Cry1/2 DKO mice in Fig. S8 are shown with a wider y-axis range. Best-fit cosine curves (black) and those based on the actual circadian time point (gray) are shown. The colors, in ascending order from green to red to blue, represent the molecular peak time, which corresponds to the molecular timetable of each peptide. CT was defined as “extrapolated entrained time of mice in a LD cycle before sampling.”
SI Results
Examination and Validation of the MS-QBiC Workflow.
The MS-QBiC workflow was examined by synthesizing several test peptides using the PURE system, a reconstituted cell-free protein synthesis system (11). The first trial was to synthesize a peptide (cell-free product-1) (Fig. S1A) including a purification tag and a target peptide for purification and detection by LC-MS. A FLAG tag was used for purification, and a peptide from the circadian protein CLOCK with a sequence of DQFNVLIK was selected as the target peptide. LC-MS analysis of the purified products showed that all of the products contained an intact purification tag and the target peptide (Fig. S1B). Peptides lacking methionine and containing oxidized methionine were also observed, which does not prevent the construction of the MS-QBiC workflow.
However, the tryptic digestion efficiency of cell-free product-1 was extremely low presumably because of multiple aspartic acid residues in the FLAG-tag (Fig. S1C). Therefore, a spacer peptide sequence was introduced downstream of the FLAG tag in cell-free product-2 (Fig. S1A). Measurement of digestion efficiency using LC-MS showed that the introduction of a spacer containing more than four leucines with a lysine residue was sufficient for complete digestion (Fig. S1C). From there on, we used a spacer with the sequence LLLLK.
We then introduced a quantification-tag sequence between the spacer and the target peptide. A peptide with a sequence of LVTDLYK was selected as the quantification tag from tryptic digests of BSA. This peptide was selected because the signal intensity was relatively high and undigested fragments were not identified in LC-MS analysis. In addition, the peptide did not contain Gln at its N terminus nor Met or Cys in the sequence, which can be nonenzymatically converted to pyroglutamic acid, and oxidized Met and Cys, respectively.
The resultant peptide (cell-free product-3) (Fig. S1A) was synthesized in the PURE system containing stable isotope-labeled lysine, and then the products were subjected to tryptic digestion. The quantification of the quantification tag was performed by using both the chemically synthesized LVTDLYK peptide and tryptic digests of commercially available BSA. The measured values were almost identical between experiments, indicating that both materials can be used for quantification of cell-free products (Fig. S1D). Afterward, both the chemically synthesized LVTDLYK peptide and the target peptide (DQFNVLIK) were mixed with the digested cell-free product-3, and resultant mixtures were subjected to the LC-MS analysis. Quantification of both quantification tag and target peptide by using chemically synthesized peptides as references showed that the amounts of these peptides were stoichiometrically equivalent, indicating that the quantified value of the quantification tag can be applied to the quantification of the target protein by using the target peptide as an internal standard (Fig. S1E). Other target peptides were also examined to demonstrate versatility in the developed workflow. The sequences of the target peptides were ILYISNQVASIFHCK (cell-free product-4) (Fig. S1A), containing cysteine that requires the reduction and alkylation for the MS analysis, and EAGVEVVTENSHTLYDLDR (cell-free product-5) (Fig. S1A), a relatively long peptide. These peptides are from the circadian clock proteins PER2 and CRY1, respectively. The results of LC-MS analyses demonstrated that the molar ratios between the quantification tag and the target peptide were nearly 1:1, demonstrating versatility in the developed workflow (Fig. S1E).
Selection of the Target Peptides Used for the MS-QBiC Workflow.
Target peptides were selected from the tryptic digests of cellular protein extracts or nuclear protein extracts from HEK293T cells overexpressing each protein and detected by LC-MS/MS analyses (Dataset S1). When not enough peptides were identified by these analyses, peptides suitable for the use in the MS-QBiC workflow were selected from the sequence information of the original proteins (Dataset S2). The selection was according to the following rules. The length of the target peptides was selected to not exceed 17 residues to prepare the DNA template by PCR within two steps. Each peptide contained only a lysine or arginine residue at its C terminus. Peptides containing methionine in the sequence or those containing glutamine at their N terminus were avoided because they produce unexpected products containing oxidized methionine or pyroglutamic acid. Peptides containing cysteine were permitted because we developed a protocol to convert the cysteine to its alkylated form almost completely by reduction and alkylation (SI Materials and Methods).
Quantification of Peptides for Common Region of Two Proteins and Peptides That Were Not Clearly Detected.
Peptides for the common region of DEC1 (BHLHE40) and DEC2 (BHLHE41), CKIδ and CKIε, and DBP and TEF were successfully quantified (Fig. S5D). The time course of the peptides shared by DEC1 (BHLHE40) and DEC2 (BHLHE41) resembled closely that of DEC1 (BHLHE40). Quantification of DEC2 (BHLHE41) with peptides unique to DEC2 was unsuccessful. These observations suggest that the expression level of DEC2 (BHLHE41) was much lower compared with DEC1 (BHLHE40). The amounts of peptides common for CKIδ and CKIε were closer to CKIδ, consistent with the expression level of CKIδ that was 20-fold higher than that of CKIε. The time course for the peptide common to DBP and TEF was a sum of protein quantities for DBP and TEF, which is reasonable given that we detected unique peptides from both DBP and TEF.
HLF, RORα, and RORβ could not be quantified similarly to DEC2 (BHLHE41), suggesting a low expression level. However, signals that seemed to originate from HLF and RORα were observed, although signal/noise ratios were too close for quantification. Given this noisy signal, we estimated the copy numbers for HLF and RORα as 3,400 and 1,280 copies/cell, respectively, without circadian variation (Fig. S5E). In contrast, we could not detect any peak corresponding to RORβ, suggesting a low expression level.
Protein Expression Phenotype in Clock Mutant Mice.
The expressions of CLOCK, DBP, TEF, REV-ERBα (NR1D1), REV-ERBβ (NR1D2), PER1, PER2, and PER3 were suppressed in Bmal1 KO mice (Fig. S9). CLOCK may have been destabilized by the absence of BMAL1, both of which form a heterodimer to play a role in activation of E/E′-Box promoters (Fig. 2A). Suppressed expression of DBP and TEF (16), the transcription of which is regulated by the E/E′-box, may have been caused by the absence of the CLOCK/BMAL1 heterodimer. Suppressed expression of REV-ERBα (NR1D1), REV-ERBβ (NR1D2), PER1, PER2, and PER3, the transcription of which is regulated by either the E/E′-box or D-box (16), may have been caused by the absence of the CLOCK/BMAL1 or decreased expression of DBP/TEF/HLF. Suppression of the E/E′-Box promoters in BMAL1 KO mice may have also resulted in the continuous activation of the RRE promoters by the suppression of their repressors, REV-ERBα (NR1D1) and REV-ERBβ (NR1D2). By this activation, the expression of E4BP4 (NFIL3), CRY1, DEC1 (BHLHE40), and RORγ, which are regulated by the RRE promoters (16, 46), may have been activated compared with the wild-type mice, which may have resulted in the disappearance of the circadian rhythmicity.
The expression levels of each protein resembled each other in Per1/2 KO and Cry1/2 KO mice, although there were subtle differences between strains (Fig. S9). The expression of DEC1 (BHLHE40), DBP, TEF, REV-ERBα (NR1D1), REV-ERBβ (NR1D2), and RORγ was elevated in both KO mice, suggesting that the E/E′-Box promoters were activated by the absence of their repressors, PER1 and PER2 or CRY1 and CRY2. The increased level of DBP and TEF may have activated in turn the D-Box promoters, which may have resulted in the increased expression level of PER3. In contrast, the effect on the RRE promoters was complicated because levels of both repressors, REV-ERBα (NR1D1) and REV-ERBβ (NR1D2), and an activator, RORγ, were increased. Considering that mild repression of BMAL1, CLOCK, and E4BP4 (NFIL3) was observed, the RRE promoters may have been repressed to some extent.
Thus, the quantified values of these proteins in diverse individuals can be beneficial for further study of those networks by systems biological approaches using modeling and simulation. We note that some peptides corresponding to PER1 and PER2 were quantified to some extent even in Per1/2 KO mice. They may have resulted from the method of gene deletion, in which a large part of the promoter and exon regions still remain in this strain (35, 47).
Discussion
As the technologies for MS-based proteomics advance, quantification of entire cellular protein networks has become feasible (37–39). However, it is still a difficult task to quantitatively investigate dynamics of the networks using global proteomics approaches by comparatively analyzing multiple cellular extracts under a variety of environments or perturbations. The quantification becomes far more difficult for low abundant proteins, such as transcription factors and kinases. Two recent global proteomics studies have revealed various proteins with circadian rhythmicity by analyzing time-series samples from large numbers of mice livers (40, 41). However, core circadian clock proteins, which consist mainly of transcription factors and kinases, were not detected.
Targeted proteomics has grown in recent years as a strategy to compensate for the weaknesses of global proteomics approaches. It monitors only signal intensities with good signal/noise ratios derived from target peptides under optimal conditions. It can analyze low-abundance proteins more effectively, but the number of proteins that can be analyzed is reduced compared with the global proteomics approaches. Therefore, targeted proteomics approaches are suitable for analyzing the dynamics of specified biological systems comprising low-abundance proteins.
In this study, we performed systems-level analysis of dynamics of core circadian clock proteins by using SRM-based targeted proteomics. Sixteen proteins from 20 circadian clock proteins were successfully quantified using time-series samples from mice liver, and 14 proteins had circadian variation (Fig. 3 and Dataset S3). The developed method can be applied to other organs or tissues such as the brain that function as a central circadian clock. It will be interesting to quantify the core circadian clock proteins in the brain to compare the abundance between the central and peripheral organs using the developed method for future studies.
Four proteins [DEC2 (BHLHE41), HLF, RORα, and RORβ] were not clearly quantified, although estimation of two proteins (HLF and RORα) was examined from peak intensities with low signal/noise ratios (Fig. S5E). The quantification result from the common region of DEC1 (BHLHE40) and DEC2 (BHLHE41) suggests that the expression level of DEC2 is extremely low (Fig. S5D), and this may have resulted in unsuccessful detection of the signal peaks for DEC2. The detection limit of DEC2 (BHLHE41) and RORβ, estimated as threefold of the SD of noise peaks, is about 1,000 and 100 copies per cell, respectively, when the most sensitive standard peptides are used (Dataset S3). Thus, further development of the SRM-based detection as well as the sensitivity of MS itself is necessary for the detection of proteins with extremely low expression levels (<1,000 copies per cell).
The MS-QBiC workflow allows for multiplexed preparation of isotopically labeled peptides for use as internal standards. Multiple peptides can be prepared in parallel without any cDNA cloning or gene synthesis step by using the MS-QBiC workflow. The use of the reconstituted cell-free protein synthesis system avoids isotope scrambling and dilution. Moreover, multiplexed peptide preparation can increase the sensitivity of SRM analysis by developing an optimal method that depends on the physical properties of individual peptides. Although the yield of synthesized peptides differs from one peptide to another, sufficient amounts of the peptide were successfully prepared regardless of their sequences, suggesting versatility in the developed workflow. This versatility also suggests that the developed method does not rely on the characteristics of proteins and can be applied to proteins that are difficult to prepare recombinantly, such as membrane-bound proteins and other DNA-binding proteins. Currently, SRM analyses highly depends on the performance of the MS, and thus detection of several hundreds of proteins is estimated to be the upper limit according to previous reports (39, 42). However, this limit can be increased by improvement of MS performance. Therefore, high-throughput synthesis of internal peptides using the PURE system can be adapted to such improvements in the future. Presently, the developed method is not able to be applied to the preparation of modified peptides that mimic posttranslational modification. However, integration of the developed method with technologies based on genetic code engineering (43), including site-specific incorporation of phosphoserine residues into the proteins or peptides (44), has the potential to overcome this difficulty, and we are now exploring this possibility.
The core circadian clock proteins consist mainly of transcription factors, which bind to DNA and function as activators or repressors for transcription. Interactions between DNA and BMAL1, CLOCK, CRY1, CRY2, PER1, and PER2, which play crucial roles in the formation of circadian rhythmicity, have been comprehensively analyzed using ChIP-seq analyses (45) demonstrating that binding of these proteins to their binding sites shows circadian rhythmicity. The peak time of binding matches well with that of the protein concentrations quantified in this study, except for CRY2, suggesting that the binding is principally regulated by the expression levels of each protein. However, the binding may be regulated not only by the quantity of protein, but also by other qualities (e.g., posttranslational modification status): The amplitude of BMAL1, CLOCK, CRY1, and CRY2 is quite low, and a considerable amount of the proteins may remain in cells at a circadian phase when their binding to DNA is low and the peak time of CRY2 concentration is different from that of its DNA binding. These observations suggest that qualitative changes of these proteins are also important for the DNA-binding activities. Calculating from our results and the ChIP-seq data, the numbers of proteins at each binding site are 5.6 BMAL1, 14.6 CLOCK, 7.2 PER1, 3.2 PER2, 3.4 CRY1, and 4.8 CRY2 at a single binding site, respectively. The values suggest that 3–15 proteins are necessary at a binding site to regulate gene expression for the formation of the circadian clock.
The application of the molecular timetable methods to the quantified peptides from 14 circadian clock proteins demonstrates that single-time-point data can predict body time, indicating that expression levels of each circadian protein are promising markers for future application of body time detection in human samples. The accuracy of detection is comparable to the mRNA-level expression-based timetable method rather than the metabolite-based method, which requires two-time-point data for detection (31–33). Furthermore, the constructed timetable, which is based on the absolute quantification of cellular proteins, can be universal compared with the previous two methods based on the relative quantification, which may enable the single-time-point assay in different places. Resemblance of peptide expression profiles between CT4 and CT16 in three mutant mice suggests that the expression level of the proteins is fixed at the level of the designated time point. In Bmal1 KO mice, the absence of CLOCK/BMAL1 heterodimer represses the E/E′-Box promoters and then activates the RRE promoters. In Per1/2 DKO and Cry1/2 DKO mice, the absence of PER1 and PER2 or CRY1 and CRY2 activates the E/E′-Box promoters and in turn activates the D-Box promoters whereas the RRE promoters are suppressed to some extent (Figs. S8E and S9). Such fixation of the activities of each promoter may result in the stalled circadian gene-expression dynamics at the specific circadian phase.
Materials and Methods
Animals.
All mice were carefully kept and handled according to the RIKEN Regulations for Animal Experiments. See SI Materials and Methods for details.
Sample Preparation.
Chemically synthesized peptides, MS-QBiC peptides, cell/nuclear lysates from HEK293T cells, and mouse liver samples were prepared for this study. They were subjected to enzymatic digestion and prefractionation before MS analyses. See SI Materials and Methods for details.
MS Analyses.
Two types of mass spectrometers—an Orbitrap mass spectrometer and a triple quadruple mass spectrometer—were used in this study. See SI Materials and Methods for details.
RNA Expression Analysis of Circadian Clock Genes by qPCR.
The mRNA-level expression profiles of circadian clock genes were measured by qPCR. See SI Materials and Methods for details.
BT Detection by Molecular Timetable Methods.
Estimation of body time by using expression profiles of circadian clock proteins was performed according to the molecular timetable methods as reported previously (31). See SI Materials and Methods for details.
SI Materials and Methods
Animals.
All mice were carefully kept and handled according to the RIKEN Regulations for Animal Experiments. Eight- to 10-wk-old male mice of wild-type (C57BL/6N, Japan SLC) and mutant were entrained under a 12 h–12 h light–dark condition (400 lx) for 2 wk. After transferring to constant darkness, wild-type mice were killed every 4 h over 1 d (i.e., CT0, -4, -8, -12, -16, and -20) for proteomic analyses or every 4 h over 2 d (i.e., CT0, -4, -8, -12, -16, -20, -24, -28, -32, -36, -40, and -44) for qPCR analyses. All mutant mice were killed in 4 and 16 h (i.e., CT4 and -16). Livers were excised and then quickly frozen in liquid nitrogen followed by storage at −80 °C. The mutant mice, all of which displayed a circadian arrhythmic behavior in constant darkness, were Bmal1 knockout mice (Bmal1 KO), Per1/Per2 double knockout mice (Per1/2 DKO), and Cry1/Cry2 double knockout mice (Cry1/2 DKO), which were originally generated by Shimba et al. (34), Bae et al. (35), and van der Horst et al. (36), respectively.
Preparation of Chemically Synthesized Peptides.
Four peptides (DQFNVLIK, LVTDLYK, ILYISNQVASIFHCK, and EAGVEVVTENSHTLYDLDR) and 10 phosphopeptides shown in Fig. S5C were synthesized with a peptide synthesizer Syro Wave (Biotage) using Fmoc solid-phase chemistry. Concentrations of the synthesized peptide were measured by an amino group determination method (48).
Preparation of MS-QBiC Peptides.
A DNA sequence (5′-ATGGACTACAAGGACGACGACGACAAGCTGCTGCTGCTGAAGCTGGTTACTGACCTGACTAAG-3′) that encodes a FLAG tag, spacer peptide, and a quantification tag (MDYKDDDDKLLLLKLVTDLTK) was cloned into a pURE1 vector (BioComber) containing a T7 promoter sequence and the ribosome-binding site (Shine-Dalgarno sequence). Using the resultant plasmid as a template, templates for MS-QBiC peptide synthesis were amplified by PCR with a T7 promoter primer (5′-GGGCCTAATACGACTCACTATAG-3′) as a forward primer and appropriate reverse primers listed in Dataset S2. PCR mixtures (2.5 μL) were directly added to yield 25 μL PURE system reaction mixtures (49) containing 13C6 15N4 l-Arginine and 13C6 l-Lysine (Thermo Scientific) as a substitute for nonlabeled l-Arginine and l-Lysine, respectively. The mixtures were incubated at 37 °C for 30 min, and then synthesized peptides were purified using anti-FLAG M2 Magnetic Beads (Sigma Aldrich) according to the manufacturer’s instruction. The peptides were eluted with 20 μL 0.2% trifluoroacetic acid (TFA) solution, and then they were diluted six times with phase-transfer surfactant (PTS) buffer (12 mM sodium deoxycholate, 12 mM sodium N-lauroylsarcosinate, and 50 mM NH4HCO3) and stored at −80 °C until used. Peptides that were not subjected to enzymatic digestion were diluted twice with water and stored. For quantification of the peptide using the quantification tag, 5 μL of the diluted solution was mixed with 1 pmol of LVTDLYK peptide with three technical replicates.
Preparation of Cell/Nuclear Lysates from HEK293T Cells.
All of the circadian clock genes used in this study [Dec1 (Bhlhe40), Dec2 (Bhlhe41), Bmal1 (Arntl), Clock, Cry1, Cry2, CKIδ, CKIε, Dbp, Tef, Hlf, E4bp4 (Nfil3), Rev-Erbα (Nr1d1), Rev-Erbβ (Nr1d2), Per1, Per2, Per3, Rorα, and Rorγ] except for Rorβ (isoform 1) were subcloned into the pMU2 vector (50) and expressed under the CMV promoter as a FLAG-tag fusion form in their N terminus. Rorβ was subcloned into the pCMVTnT vector (Promega) and expressed under the CMV promoter. The genes were derived from a mammalian gene collection library [Dec1 (Bhlhe40), CKIδ, and Rorα] and an NIH 3T3 cDNA library [CKIε, Dbp, Tef, Hlf, E4bp4 (Nfil3), Rev-Erbα (Nr1d1), Rev-Erbβ (Nr1d2), Rorγ, and Rorβ]. A cDNA collection for Bmal1 (Arntl), Clock, Cry1, Cry2, Per1, Per2, and Per3 is a kind gift from Hajime Tei (Kanazawa University, Kanazawa, Japan) and cDNA of Dec2 (Bhlhe41) is a kind gift from Ken-ichi Honma and Sato Honma (Hokkaido University, Sapporo, Japan). For the expression of the genes, HEK293T cells were grown in DMEM (Invitrogen) supplemented with 10% (vol/vol) FBS (JRH Biosciences) and antibiotics (25 U/mL penicillin and 25 mg/mL streptomycin) (Invitrogen). At 24 h before transfection, cells were plated at 106 cells per well in 10-cm dishes. Transfection was performed with FuGene6 (Promega) according to the manufacturer’s instruction. A total of 2 μg of each expression vector or a mixture of 1 μg BMAL1 vector and 1 μg CLOCK vector was transfected to the HEK293T cells on 10-cm dishes. After 48 h, cells were collected by 0.25% trypsin–EDTA (Life Technologies) treatment. The cell pellets were lysed in 1 mL PTS buffer followed by extensive sonication. The cell lysates were then flash-frozen in liquid nitrogen and stored at −80 °C. For the detection of TEF, BMAL1, CLOCK, REV-ERBα (NR1D1), REV-ERBβ (NR1D2), and RORγ, we also performed nuclear isolation from the cell pellet. The cell pellet was suspended with 1 mL of the following five buffers (and at each time collected by centrifugation at 1,500 × g for 5 min): Buffer #1—DPBS (Life Technologies); #2 and #3—NB (10 mM Tris⋅HCl, pH 7.0, 10 mM NaCl, 3 mM MgCl2, and 30 mM sucrose) supplemented with 0.5% (vol/vol) Nonidet P-40; #4 and #5—NB + 10 mM CaCl2. The resultant pellet, mainly consisting of nuclei, was lysed in 1 mL PTS buffer followed by extensive sonication. The cell lysates were then flash-frozen in liquid nitrogen and stored at −80 °C.
Enzymatic Digestion.
Enzymatic digestion of MS-QBiC peptides, mouse liver samples, and cell/nuclear lysates from HEK293T cells was performed basically according to a PTS protocol as reported earlier (51). Before the digestion, blocking treatment of test tubes was performed for MS-QBiC peptides, in comparatively lower peptide concentration, by reducing nonspecific adsorption of peptides. Enolase from Baker’s yeast (Sigma Aldrich) was subjected to the enzymatic digestion using Lysyl Endopeptidase (LysC, Wako Pure Chemical Industries) as described below. Digests (0.2 μg/μL) in a PTS buffer were added to new tubes and were incubated at 4 °C overnight, followed by discarding of the contents. A sample in a PTS buffer was reduced with 10 mM TCEP at 37 °C for 1 h and then alkylated with 15 mM iodoacetamide at 37 °C for 30 min in case it contained cysteine residues. The resultant sample was diluted five times with 50 mM NH4HCO3 solution. Predigestion was performed by the addition of LysC at 2 ng/μL (MS-QBiC peptides), 1:50 (wt/wt) (mouse liver samples), or 1:100 (wt/wt) (cell/nuclear lysates from HEK293T), which were incubated at 37 °C for 8 h. Subsequently, digestion was performed by the addition of same amounts of trypsin (Roche) as of LysC, which were incubated at 37 °C for 16 h. After the digestion, an equal volume of ethyl acetate was added to the sample, which was acidified with 0.5% TFA to transfer the detergents into an organic phase. After the sample was centrifuged at 10,000 × g for 10 min at room temperature, an aqueous phase containing peptides was collected and dried with SpeedVac (Thermo Scientific). The sample was dissolved in a solution containing 2% acetonitrile and 0.1% TFA, and then it was desalted by using self-prepared stage tips (52) (MS-QBiC peptides and cell/nuclear lysates from HEK293T cells) or 1 cc Oasis HLB cartridge (10 mg sorbent; Waters) (mouse liver samples), which was dried again with SpeedVac and stored at −80 °C until use.
Prefractionation of Mouse Liver Samples with SCX Chromatography.
Digested mouse liver samples were prefractionated into 18 fractions by SCX chromatography as follows: The dried peptide mixtures were dissolved in 500 μL of a SCX-A (25% acetonitrile and 10 mM H3PO4, pH 2.7). A total of 200 μL of the solution was applied to a PolySULFOETHYL A column (100 × 2.1 mm, 5-μm particles with a 300-Å pore diameter; PolyLC) using the Elite LaChrom HPLC system (Hitachi). Using two mobile phases, SCX-A and SCX-B (1 M KCl, 25% acetonitrile, and 10 mM H3PO4, pH 2.7), peptides were eluted with a gradient (0% B for 3 min, 0–7% B in 25 min, 7–22% B in 12 min, 22–65% B in 7 min, 40–100% B in 4 min, and 100% B for 5 min, 200 μL/min). The elution was collected every 1 min up to 60 min, and the resulting 60 fractions were dried with SpeedVac. Then they were dissolved in a solution containing 2% acetonitrile and 0.1% TFA and combined into 18 fractions as shown in Fig. S4A. Resultant fractions were desalted by using self-prepared stage tips (52), dried again with SpeedVac, and stored at −80 °C until use.
Mass Spectrometers.
Two types of mass spectrometers were used in this study. One was an Orbitrap mass spectrometer (positive mode, scan range of 350–1,500 m/z, 30,000 FWHM resolution at 400 m/z, LTQ Orbitrap Velos Pro mass spectrometer, Thermo Scientific), which was used for a high-resolution full-scan analysis. The other was a triple quadruple mass spectrometer (positive mode, scan width of 0.002 m/z, Q1 and Q3 resolutions of 0.7 FWHM, a cycle time of 1 s, a gas pressure of 1.8 mTorr, TSQ Vantage EMR mass spectrometer, Thermo Scientific), which was used for SRM analyses. Both of them were equipped with a nanoLC interface (AMR), a nano-Advance UHPLC system (Bruker Daltonics), and an HTC-PAL autosampler (CTC Analytics) with a trap column (0.3 × 5 mm, L-column, C18; Chemicals Evaluation and Research Institute). Analytical samples were separated by reversed-phase chromatography in which we used a home-made capillary column (length of 200 mm and inner diameter of 100 μm) packed with 2 μm C18 resin (L-column 2, Chemicals Evaluation and Research Institute) using two mobile phases of RP-A (0.5% acetic acid) and RP-B (0.5% acetic acid and 80% acetonitrile). Elution was directly electrosprayed (2.4 kV) into the MS.
Mass Spectrometric Analyses of MS-QBiC Peptides and Cell/Nuclear Lysates from HEK293T Cells.
To develop and examine the MS-QBiC workflow, in vitro-synthesized MS-QBiC peptides or their tryptic digests were analyzed with both the Orbitrap mass spectrometer and the triple quadrupole mass spectrometer. Analytical samples were separated with a linear gradient from 15 to 40 min at a flow rate of 300 nL/min using RP-A and RP-B. Tryptic digests of cell/nuclear lysates from HEK293T cells were analyzed with the Orbitrap mass spectrometer to identify expressed circadian clock proteins. Analytical samples were separated with a linear gradient for 210 min at a flow rate of 300 nL/min using RP-A and RP-B. The MS scans to analyze precursor ions were performed in the Orbitrap mass analyzer, and then the MS/MS scans to analyze fragment ions were performed in the LTQ mass analyzer where each of the most intense precursor ions (up to top 10) was isolated and fragmented by collision-induced dissociation (CID) with the normalized collision energy (35%). The CID raw spectra were extracted using Proteome Discoverer 1.3 (Thermo Scientific) and searched against the mouse International Protein Index (IPI) database (version 3.87) using Mascot (v2.3, Matrix Science) with following settings: The parameter of the cleavage was set to trypsin and the missed cleavage was allowed up to 1. The mass tolerances were set to 5 ppm for precursor ion and 0.6 Da for fragment ion, respectively. On the conditions of the modification, we set carbamidomethylation at cysteine as fixed modification and oxidation at methionine as variable (nonfixed) modification. The significance threshold of P < 0.05 was set. The list of the identified peptides in circadian clock proteins is indicated in Dataset S1.
Development of SRM Methods.
Optimal SRM methods containing SRM transitions (from three to five per peptide), which were represented as specific pairs of m/z values associated with precursor and fragment ions, and collision energies (CE) associated with each SRM transition were developed by LC-SRM/MS analyses of tryptic digests containing MS-QBiC peptides and 1 pmol of LVTDLYK using primary SRM transitions developed as follows: For m/z values of precursor ions, those of both the doubly and triply charged ones were used. For m/z values of fragment ions, those of singly charged y3 to yn−1 were used if the precursor ion was doubly charged (n represents the number of residues of the precursor ion). If the precursor ion was triply charged, values of both singly and doubly charged y3 to yn−1 were used. In the case in which the precursor ion was short enough (n ≤ 10), b ions were also used according to the same rule as y ions. Primary CE for each SRM transition was determined according to the following formulas, as previously reported (17): CE = 0.034 × m/zprecursor − 0.848 for doubly charged precursor ions and CE = 0.022 × m/zprecursor + 5.953 for triply charged precursor ions. Up to 10 candidate transitions with strong intensities were selected from SRM chromatograms obtained by primary SRM transitions using Pinpoint software (version 2.3.0; Thermo Scientific). Optimization of CE was further performed for each candidate transition by the LC-SRM/MS analyses accompanied with seven CE values (primary CE, primary CE ± 2 eV, primary CE ± 4 eV, and primary CE ± 6 eV). Obtained chromatograms were analyzed and the best CE for each transition was determined. Finally, up to five transitions per peptide were developed as optimal SRM methods. A total of 574 SRM transitions (1,149 transitions for light and heavy peptides) was obtained for 120 target peptides.
Quantification of Circadian Clock Proteins with SRM.
Prefractionated mouse liver samples by the SCX chromatography were analyzed for quantification of circadian clock proteins. If no target peptide was detected in the first 3 fractions from 18 fractions, the remaining 15 fractions were analyzed. The dried peptide mixtures were dissolved in 10 μL of a solution containing 2% acetonitrile and 0.1% TFA. A total of 2 μL of each sample was applied to the triple quadruple mass spectrometer and analyzed with using developed SRM methods. Samples were separated with a gradient using RP-A and RP-B (5–45% B in 50 min, 45–95% B in 1 min, 95% for 2 min, 95–5% B in 1 min, and 5% B for 6 min) at a flow rate of 300 nL/min. After each run, 30 min washing of the LC line and equilibration of the analytical column for the next run were performed. SRM chromatograms for each SRM transition were extracted using Qual Browser of Xcaliber 2.2 (Thermo Scientific). Quantification of the target peptides was performed by using the peak with the highest ratio of signal to noise in the peaks, which was associated with one target peptide and not overlapped by noise peaks.
Analysis of Digestion Efficiency and Specificity of Several Proteases.
Enzymatic digestion of BSA was performed according to a PTS protocol as reported earlier (51). BSA (20 µg) in a PTS buffer was reduced with 10 mM TCEP at 37 °C for 1 h and then alkylated with 15 mM iodoacetamide at 37 °C for 30 min in the dark. The resultant sample was diluted five times with a 50-mM NH4HCO3 solution. Enzymatic digestion was performed using several conditions in addition to the same condition with liver proteins to compare several proteases where 1:50 (wt/wt) of Trypsin, 1:50 (wt/wt) of LysC, 1:50 (wt/wt) of chymotrypsin (Princeton Separations), or 1:20 (wt/wt) endopeptidase Glu-C (New England BioLabs) with 0.5 mM Glu-Glu, respectively, was added and followed by a 24-h incubation at 37 °C. After the digestion, peptide mixtures were extracted using ethyl acetate and TFA as described above and desalted by using self-prepared stage tips (52). BSA digests (100 fmol) were subjected to LC-MS/MS analysis. The data were analyzed by Proteome Discoverer 1.4 (Thermo Scientific) and Mascot (v2.3, Matrix Science) using the bovine IPI database (v3.73): The parameter of the cleavage was set to each protease or none, which means searching for nonspecific cleavage, and missed cleavages were allowed up to 7. The mass tolerances were set to 5 ppm for precursor ion and 0.6 Da for fragment ion, respectively. On the conditions of the modification, we set carbamidomethylation at cysteine as a fixed modification and oxidation at methionine modification and pyroglutamylation at N-terminal glutamine as variable (nonfixed). The hit with an ion score >20 was adopted by a peptide spectrum match (PSM).
Detection of Phosphorylated Peptides.
Analyses of phosphorylation of peptide-1 and peptide-3 from CKIδ and peptide-1 from CKIε (Fig. S5A) were performed by a targeted proteomics approach using isotope labeling with chemical dimethylation according to the previous report (53). Chemically synthesized 10 phosphopeptides (Fig. S5C) were dimethyl-labeled with isotope-labeled formaldehyde (13CD2O, ISOTEC) to introduce heavy isotopes. They were dissolved in 2% acetonitrile and 0.1% TFA and stored at −80 °C until use. Enzymatically digested mouse liver samples including 2 mg of proteins were dimethyl-labeled with formaldehyde (Sigma-Aldrich) on solid-phase extraction cartridges [solid phase extraction (SPE) cartridges, Oasis HLB 30 mg, Waters]. The samples eluted from the SPE cartridges were combined with 10 isotope-labeled phosphopeptides that were diluted with the solution containing 50 ng/μL Enolase digest, 2% acetonitrile, and 0.1% TFA. The resultant mixtures were applied to Fe-IMAC (Immobilized Metal Ion Affinity Chromatography) according to a previous report (54) to enrich the phophopeptides and then subjected to the SRM analysis. The developed SRM methods for those phosphopeptides are shown in Dataset S2.
RNA Expression Analysis of Circadian Clock Genes by qPCR.
The mRNA-level expression profiles of circadian clock genes were measured by qPCR. Mouse livers were sampled every 4 h over 2 d (n = 2). Total RNA was prepared from the livers at each time point using TRIzol reagents (Life Technologies) according to the manufacturer’s instructions. The cDNA was synthesized from 0.25 μg of total RNA with random hexamer (Promega) and SuperScript II Reverse Transcriptase (Life Technologies) according to the manufacturer’s instructions. The qPCR was performed using QuantStudio7 Real-Time PCR System (Life Technologies) and SYBR Premix Ex Taq GC (TaKaRa). Samples contained 1 × SYBR Premix Ex Taq, 0.8 μM primers, and 1/20 synthesized cDNA in a 10-μL volume. PCR conditions were as follows: 1 min at 95 °C, then 45 cycles of 15 s at 95 °C, and 1 min at 59 °C. Absolute cDNA abundance was calculated using the standard curve obtained from mouse genomic DNAs. Tbp expression levels were quantified and used as the internal control (55). Oligonucleotide sequences of qPCR primers for the circadian clock genes are described in Dataset S2.
Phase Determination of Peptide and mRNA Levels by Cosine Curve Fitting.
To assess the circadian rhythmicity and determine the phases for peptides and mRNA, 24-h cosine curve fitting to the time-course data of each peptide and mRNA was performed. Pearson’s correlations between the time-series data of each peptide and 24-h period cosines with different peak times at 10-min intervals were calculated, and then the best-fit cosine curve that gave a maximum Pearson’s correlation was selected. Circadian rhythmicity of each peptide and mRNA was evaluated by a permutation test.
BT Detection by Molecular Timetable Methods.
Estimation of body time by using expression profiles of circadian clock proteins was performed according to the molecular timetable methods as reported previously (31). The timetable was created by using the calculated phases ti (i = 1 . . . 36) for 36 peptides from 14 circadian clock proteins, which showed circadian rhythmicity by 24-h cosine curve fitting. Using the timetable, we estimated the body time as follows: We normalized an absolute amount Xi (i = 1 . . . 36) of the peptide i (i = 1 . . . 36) by using its average μi and SD σi. The normalized expression level Yi is described as follows: Yi = (Xi − μi)/σi. We created an expression profile {ti, Yi} (i = 1 . . . 36) composed of the peak time ti of peptide i and its normalized expression level Yi. To estimate the BT of an expression profile, we calculated the Pearson’s correlation over the peptides (i = 1 . . . 36) between an expression profile {ti, Yi} and a 24-h cosine curve {ti, √2 Cos(2π(ti − b)/24)} with a peak time b (0 ≤ b < 24). We prepared 24-h cosine curves with a peak time b from 0 to 24 h in increments of 10 min. We then selected the best-fit cosine curve that gave a maximum Pearson’s correlation (c) and body time (bc). Then we evaluated the statistical significance of the maximum Pearson’s correlation as follows: We first generated random expression data by obtaining the sum of a 24-h period cosine at random time [√2 Cos(2π(tr − bi)/24)] and a measurement noise (Ni), where tr represents random time (0 ≤ tr < 24). Ni was a randomly selected value in the noise data set of the each peptide, which were obtained by subtracting the calculated values [√2 Cos(2π(ti − bc)/24)] from the experimental values (Yi) over the indicated time points. For the random expression data, we evaluated a maximum Pearson’s correlation. We repeated this procedure 10,000 times to create the distribution of maximum Pearson’s correlations. The statistical significance (P value) was determined by dividing the number of greater correlations obtained from random expression data than the correlation obtained from the experimental expression data by 10,000.
Supplementary Material
Acknowledgments
We thank the laboratory members at RIKEN QBiC, in particular, J. Hara and G. A. Sunagawa for their kind help in preparing knockout mice; A. Millius for his critical reading and editing of the manuscript; E. A. Susaki for his kind support in setting up the MS room; and T. Kawashima for his early efforts on the molecular timetable. This work was supported by the Program for Innovative Cell Biology by Innovative Technology and the Brain Mapping by Integrated Neurotechnologies for Disease Studies from the Ministry of Education, Culture, Sports, Science and Technology (MEXT) of Japan (H.R.U.); Grant-in-Aid for Scientific Research (S) 25221004 (to H.R.U.); Grant-in-Aid for Scientific Research on Innovative Areas 23115006 (to H.R.U.); Grant-in-Aid for Young Scientists (A) 26710014 (to Y. Shimizu); Grant-in-Aid for Young Scientists (B) 25830146 (to K.L.O.); Grant-in-Aid for Challenging Exploratory Research 26640134 (to Y. Shimizu); Grant-in-Aid for Exploratory Research 15K13750 (to K.M.); Grants-in-Aid for Japan Society for the Promotion of Science (JSPS) Fellows 25-1565 (to G.N.K.) and 25-5989 (to Y. Shinohara) from MEXT/JSPS; the strategic programs for R&D (President’s Discretionary Fund) of RIKEN (H.R.U. and Y. Shimizu); an intramural Grant-in-Aid from the RIKEN Quantitative Biology Center (to H.R.U. and Y. Shimizu); the RIKEN Special Postdoctoral Research Program (G.N.K.); and a grant from Core Research for Evolutional Science and Technology of Japan Science and Technology Agency (to H.R.U.).
Footnotes
The authors declare no conflict of interest.
This article is a PNAS Direct Submission.
This article contains supporting information online at www.pnas.org/lookup/suppl/doi:10.1073/pnas.1603799113/-/DCSupplemental.
References
- 1.Brun V, Masselon C, Garin J, Dupuis A. Isotope dilution strategies for absolute quantitative proteomics. J Proteomics. 2009;72(5):740–749. doi: 10.1016/j.jprot.2009.03.007. [DOI] [PubMed] [Google Scholar]
- 2.Gerber SA, Rush J, Stemman O, Kirschner MW, Gygi SP. Absolute quantification of proteins and phosphoproteins from cell lysates by tandem MS. Proc Natl Acad Sci USA. 2003;100(12):6940–6945. doi: 10.1073/pnas.0832254100. [DOI] [PMC free article] [PubMed] [Google Scholar]
- 3.Stergachis AB, MacLean B, Lee K, Stamatoyannopoulos JA, MacCoss MJ. Rapid empirical discovery of optimal peptides for targeted proteomics. Nat Methods. 2011;8(12):1041–1043. doi: 10.1038/nmeth.1770. [DOI] [PMC free article] [PubMed] [Google Scholar]
- 4.Hanke S, Besir H, Oesterhelt D, Mann M. Absolute SILAC for accurate quantitation of proteins in complex mixtures down to the attomole level. J Proteome Res. 2008;7(3):1118–1130. doi: 10.1021/pr7007175. [DOI] [PubMed] [Google Scholar]
- 5.Simicevic J, et al. Absolute quantification of transcription factors during cellular differentiation using multiplexed targeted proteomics. Nat Methods. 2013;10(6):570–576. doi: 10.1038/nmeth.2441. [DOI] [PubMed] [Google Scholar]
- 6.Beynon RJ, Doherty MK, Pratt JM, Gaskell SJ. Multiplexed absolute quantification in proteomics using artificial QCAT proteins of concatenated signature peptides. Nat Methods. 2005;2(8):587–589. doi: 10.1038/nmeth774. [DOI] [PubMed] [Google Scholar]
- 7.Brownridge PJ, Harman VM, Simpson DM, Beynon RJ. Absolute multiplexed protein quantification using QconCAT technology. Methods Mol Biol. 2012;893:267–293. doi: 10.1007/978-1-61779-885-6_18. [DOI] [PubMed] [Google Scholar]
- 8.Mirzaei H, McBee JK, Watts J, Aebersold R. Comparative evaluation of current peptide production platforms used in absolute quantification in proteomics. Mol Cell Proteomics. 2008;7(4):813–823. doi: 10.1074/mcp.M700495-MCP200. [DOI] [PMC free article] [PubMed] [Google Scholar]
- 9.Muchmore DC, McIntosh LP, Russell CB, Anderson DE, Dahlquist FW. Expression and nitrogen-15 labeling of proteins for proton and nitrogen-15 nuclear magnetic resonance. Methods Enzymol. 1989;177:44–73. doi: 10.1016/0076-6879(89)77005-1. [DOI] [PubMed] [Google Scholar]
- 10.Yokoyama J, Matsuda T, Koshiba S, Tochio N, Kigawa T. A practical method for cell-free protein synthesis to avoid stable isotope scrambling and dilution. Anal Biochem. 2011;411(2):223–229. doi: 10.1016/j.ab.2011.01.017. [DOI] [PubMed] [Google Scholar]
- 11.Shimizu Y, et al. Cell-free translation reconstituted with purified components. Nat Biotechnol. 2001;19(8):751–755. doi: 10.1038/90802. [DOI] [PubMed] [Google Scholar]
- 12.Lowrey PL, et al. Positional syntenic cloning and functional characterization of the mammalian circadian mutation tau. Science. 2000;288(5465):483–492. doi: 10.1126/science.288.5465.483. [DOI] [PMC free article] [PubMed] [Google Scholar]
- 13.Ueda HR, et al. A transcription factor response element for gene expression during circadian night. Nature. 2002;418(6897):534–539. doi: 10.1038/nature00906. [DOI] [PubMed] [Google Scholar]
- 14.Xu Y, et al. Functional consequences of a CKIdelta mutation causing familial advanced sleep phase syndrome. Nature. 2005;434(7033):640–644. doi: 10.1038/nature03453. [DOI] [PubMed] [Google Scholar]
- 15.Ukai-Tadenuma M, et al. Delay in feedback repression by cryptochrome 1 is required for circadian clock function. Cell. 2011;144(2):268–281. doi: 10.1016/j.cell.2010.12.019. [DOI] [PubMed] [Google Scholar]
- 16.Ueda HR, et al. System-level identification of transcriptional circuits underlying mammalian circadian clocks. Nat Genet. 2005;37(2):187–192. doi: 10.1038/ng1504. [DOI] [PubMed] [Google Scholar]
- 17.Ebhardt HA, Sabidó E, Hüttenhain R, Collins B, Aebersold R. Range of protein detection by selected/multiple reaction monitoring mass spectrometry in an unfractionated human cell culture lysate. Proteomics. 2012;12(8):1185–1193. doi: 10.1002/pmic.201100543. [DOI] [PubMed] [Google Scholar]
- 18.Burgess MW, Keshishian H, Mani DR, Gillette MA, Carr SA. Simplified and efficient quantification of low-abundance proteins at very high multiplex via targeted mass spectrometry. Mol Cell Proteomics. 2014;13(4):1137–1149. doi: 10.1074/mcp.M113.034660. [DOI] [PMC free article] [PubMed] [Google Scholar]
- 19.Brown TA, editor. Genomes. 2nd Ed. John Wiley & Sons; New York: 2002. Transcriptomes and proteomes; pp. 70–91. [Google Scholar]
- 20.Lawless C, et al. Direct and absolute quantification of over 1800 yeast proteins via selected reaction monitoring. Mol Cell Proteomics. 2016;15(4):1309–1322. doi: 10.1074/mcp.M115.054288. [DOI] [PMC free article] [PubMed] [Google Scholar]
- 21.Glatter T, et al. Large-scale quantitative assessment of different in-solution protein digestion protocols reveals superior cleavage efficiency of tandem Lys-C/trypsin proteolysis over trypsin digestion. J Proteome Res. 2012;11(11):5145–5156. doi: 10.1021/pr300273g. [DOI] [PubMed] [Google Scholar]
- 22.Pan C, Gnad F, Olsen JV, Mann M. Quantitative phosphoproteome analysis of a mouse liver cell line reveals specificity of phosphatase inhibitors. Proteomics. 2008;8(21):4534–4546. doi: 10.1002/pmic.200800105. [DOI] [PubMed] [Google Scholar]
- 23.Monetti M, Nagaraj N, Sharma K, Mann M. Large-scale phosphosite quantification in tissues by a spike-in SILAC method. Nat Methods. 2011;8(8):655–658. doi: 10.1038/nmeth.1647. [DOI] [PubMed] [Google Scholar]
- 24.Lee C, Etchegaray JP, Cagampang FR, Loudon AS, Reppert SM. Posttranslational mechanisms regulate the mammalian circadian clock. Cell. 2001;107(7):855–867. doi: 10.1016/s0092-8674(01)00610-9. [DOI] [PubMed] [Google Scholar]
- 25.Hirayama J, et al. CLOCK-mediated acetylation of BMAL1 controls circadian function. Nature. 2007;450(7172):1086–1090. doi: 10.1038/nature06394. [DOI] [PubMed] [Google Scholar]
- 26.Isojima Y, et al. CKIepsilon/δ-dependent phosphorylation is a temperature-insensitive, period-determining process in the mammalian circadian clock. Proc Natl Acad Sci USA. 2009;106(37):15744–15749. doi: 10.1073/pnas.0908733106. [DOI] [PMC free article] [PubMed] [Google Scholar]
- 27.Hirano A, et al. FBXL21 regulates oscillation of the circadian clock through ubiquitination and stabilization of cryptochromes. Cell. 2013;152(5):1106–1118. doi: 10.1016/j.cell.2013.01.054. [DOI] [PubMed] [Google Scholar]
- 28.Gao P, et al. Phosphorylation of the cryptochrome 1 C-terminal tail regulates circadian period length. J Biol Chem. 2013;288(49):35277–35286. doi: 10.1074/jbc.M113.509604. [DOI] [PMC free article] [PubMed] [Google Scholar]
- 29.Gekakis N, et al. Role of the CLOCK protein in the mammalian circadian mechanism. Science. 1998;280(5369):1564–1569. doi: 10.1126/science.280.5369.1564. [DOI] [PubMed] [Google Scholar]
- 30.Ye R, et al. Dual modes of CLOCK:BMAL1 inhibition mediated by Cryptochrome and Period proteins in the mammalian circadian clock. Genes Dev. 2014;28(18):1989–1998. doi: 10.1101/gad.249417.114. [DOI] [PMC free article] [PubMed] [Google Scholar]
- 31.Ueda HR, et al. Molecular-timetable methods for detection of body time and rhythm disorders from single-time-point genome-wide expression profiles. Proc Natl Acad Sci USA. 2004;101(31):11227–11232. doi: 10.1073/pnas.0401882101. [DOI] [PMC free article] [PubMed] [Google Scholar]
- 32.Minami Y, et al. Measurement of internal body time by blood metabolomics. Proc Natl Acad Sci USA. 2009;106(24):9890–9895. doi: 10.1073/pnas.0900617106. [DOI] [PMC free article] [PubMed] [Google Scholar]
- 33.Kasukawa T, et al. Human blood metabolite timetable indicates internal body time. Proc Natl Acad Sci USA. 2012;109(37):15036–15041. doi: 10.1073/pnas.1207768109. [DOI] [PMC free article] [PubMed] [Google Scholar]
- 34.Shimba S, et al. Deficient of a clock gene, brain and muscle Arnt-like protein-1 (BMAL1), induces dyslipidemia and ectopic fat formation. PLoS One. 2011;6(9):e25231. doi: 10.1371/journal.pone.0025231. [DOI] [PMC free article] [PubMed] [Google Scholar]
- 35.Bae K, et al. Differential functions of mPer1, mPer2, and mPer3 in the SCN circadian clock. Neuron. 2001;30(2):525–536. doi: 10.1016/s0896-6273(01)00302-6. [DOI] [PubMed] [Google Scholar]
- 36.van der Horst GT, et al. Mammalian Cry1 and Cry2 are essential for maintenance of circadian rhythms. Nature. 1999;398(6728):627–630. doi: 10.1038/19323. [DOI] [PubMed] [Google Scholar]
- 37.Wilhelm M, et al. Mass-spectrometry-based draft of the human proteome. Nature. 2014;509(7502):582–587. doi: 10.1038/nature13319. [DOI] [PubMed] [Google Scholar]
- 38.Kim MS, et al. A draft map of the human proteome. Nature. 2014;509(7502):575–581. doi: 10.1038/nature13302. [DOI] [PMC free article] [PubMed] [Google Scholar]
- 39.Kennedy JJ, et al. Demonstrating the feasibility of large-scale development of standardized assays to quantify human proteins. Nat Methods. 2014;11(2):149–155. doi: 10.1038/nmeth.2763. [DOI] [PMC free article] [PubMed] [Google Scholar]
- 40.Mauvoisin D, et al. Circadian clock-dependent and -independent rhythmic proteomes implement distinct diurnal functions in mouse liver. Proc Natl Acad Sci USA. 2014;111(1):167–172. doi: 10.1073/pnas.1314066111. [DOI] [PMC free article] [PubMed] [Google Scholar]
- 41.Robles MS, Cox J, Mann M. In-vivo quantitative proteomics reveals a key contribution of post-transcriptional mechanisms to the circadian regulation of liver metabolism. PLoS Genet. 2014;10(1):e1004047. doi: 10.1371/journal.pgen.1004047. [DOI] [PMC free article] [PubMed] [Google Scholar]
- 42.Sabidó E, et al. Targeted proteomics reveals strain-specific changes in the mouse insulin and central metabolic pathways after a sustained high-fat diet. Mol Syst Biol. 2013;9(1):681. doi: 10.1038/msb.2013.36. [DOI] [PMC free article] [PubMed] [Google Scholar]
- 43.Chin JW. Expanding and reprogramming the genetic code of cells and animals. Annu Rev Biochem. 2014;83:379–408. doi: 10.1146/annurev-biochem-060713-035737. [DOI] [PubMed] [Google Scholar]
- 44.Park HS, et al. Expanding the genetic code of Escherichia coli with phosphoserine. Science. 2011;333(6046):1151–1154. doi: 10.1126/science.1207203. [DOI] [PMC free article] [PubMed] [Google Scholar]
- 45.Koike N, et al. Transcriptional architecture and chromatin landscape of the core circadian clock in mammals. Science. 2012;338(6105):349–354. doi: 10.1126/science.1226339. [DOI] [PMC free article] [PubMed] [Google Scholar]
- 46.Ozaki N, et al. Regulation of basic helix-loop-helix transcription factors Dec1 and Dec2 by RORα and their roles in adipogenesis. Genes Cells. 2012;17(2):109–121. doi: 10.1111/j.1365-2443.2011.01574.x. [DOI] [PubMed] [Google Scholar]
- 47.Hida A, et al. The human and mouse Period1 genes: Five well-conserved E-boxes additively contribute to the enhancement of mPer1 transcription. Genomics. 2000;65(3):224–233. doi: 10.1006/geno.2000.6166. [DOI] [PubMed] [Google Scholar]
- 48.Fields R. The rapid determination of amino groups with TNBS. Methods Enzymol. 1972;25:464–468. doi: 10.1016/S0076-6879(72)25042-X. [DOI] [PubMed] [Google Scholar]
- 49.Shimizu Y, Ueda T. PURE technology. Methods Mol Biol. 2010;607:11–21. doi: 10.1007/978-1-60327-331-2_2. [DOI] [PubMed] [Google Scholar]
- 50.Ukai H, et al. Melanopsin-dependent photo-perturbation reveals desynchronization underlying the singularity of mammalian circadian clocks. Nat Cell Biol. 2007;9(11):1327–1334. doi: 10.1038/ncb1653. [DOI] [PubMed] [Google Scholar]
- 51.Masuda T, Tomita M, Ishihama Y. Phase transfer surfactant-aided trypsin digestion for membrane proteome analysis. J Proteome Res. 2008;7(2):731–740. doi: 10.1021/pr700658q. [DOI] [PubMed] [Google Scholar]
- 52.Rappsilber J, Mann M, Ishihama Y. Protocol for micro-purification, enrichment, pre-fractionation and storage of peptides for proteomics using StageTips. Nat Protoc. 2007;2(8):1896–1906. doi: 10.1038/nprot.2007.261. [DOI] [PubMed] [Google Scholar]
- 53.Boersema PJ, Raijmakers R, Lemeer S, Mohammed S, Heck AJ. Multiplex peptide stable isotope dimethyl labeling for quantitative proteomics. Nat Protoc. 2009;4(4):484–494. doi: 10.1038/nprot.2009.21. [DOI] [PubMed] [Google Scholar]
- 54.Narumi R, Tomonaga T. Quantitative analysis of tissue samples by combining iTRAQ isobaric labeling with selected/multiple reaction monitoring (SRM/MRM) Methods Mol Biol. 2016;1355:85–101. doi: 10.1007/978-1-4939-3049-4_6. [DOI] [PubMed] [Google Scholar]
- 55.Tsujino K, et al. Establishment of TSH β real-time monitoring system in mammalian photoperiodism. Genes Cells. 2013;18(7):575–588. doi: 10.1111/gtc.12063. [DOI] [PMC free article] [PubMed] [Google Scholar]
Associated Data
This section collects any data citations, data availability statements, or supplementary materials included in this article.


