Significance
The biochemical reactions that drive cellular life are housed in distinct membrane enclosed compartments known as organelles. Whereas proteins targeting to different organelles are well developed, little is known regarding how lipids are sorted to different organelles. We engineered a protein from a marine organism into a fluorescent “biosensor” of sphingomyelin (SM), a sphingolipid that is produced in the Golgi apparatus but is a major component of the plasma membrane. By monitoring SM dynamics in live cells, we discovered that SM is transported from its site of synthesis in the Golgi to the plasma membrane in a distinct type of secretory transport carrier. Our findings show that vesicle-based trafficking pathways are specialized to transport distinct types of lipids, in addition to proteins.
Keywords: sphingomyelin, Golgi apparatus, secretion, equinatoxin
Abstract
One of the principal functions of the trans Golgi network (TGN) is the sorting of proteins into distinct vesicular transport carriers that mediate secretion and interorganelle trafficking. Are lipids also sorted into distinct TGN-derived carriers? The Golgi is the principal site of the synthesis of sphingomyelin (SM), an abundant sphingolipid that is transported. To address the specificity of SM transport to the plasma membrane, we engineered a natural SM-binding pore-forming toxin, equinatoxin II (Eqt), into a nontoxic reporter termed Eqt-SM and used it to monitor intracellular trafficking of SM. Using quantitative live cell imaging, we found that Eqt-SM is enriched in a subset of TGN-derived secretory vesicles that are also enriched in a glycophosphatidylinositol-anchored protein. In contrast, an integral membrane secretory protein (CD8α) is not enriched in these carriers. Our results demonstrate the sorting of native SM at the TGN and its transport to the plasma membrane by specific carriers.
Ample evidence indicates that proteins are sorted in the the trans Golgi network (TGN) into distinct types of Golgi-derived transport carriers (1), but little is known regarding the lipid content of different carriers. The most abundant sphingolipid, sphingomyelin (SM), is a principal component of the plasma membrane that is synthesized on the luminal membrane leaflets of TGN membranes and transported to the plasma membrane via an uncharacterized pathway. Inhibition of SM synthesis has been reported to slow Golgi-to-plasma membrane trafficking of vesicular stomatitis virus G protein, influenza hemagglutinin, and pancreatic adenocarcinoma up-regulated factor (2–6), suggesting that the SM biosynthetic pathway is broadly required for secretory competence, but the underlying mechanisms are unknown. Furthermore, it remains unclear whether SM trafficking per se, or the activities of SM metabolites such as ceramide and diacylglycerol (DAG), are harnessed for the production of secretory vesicles.
Many investigations of intracellular sphingolipid sorting use synthetic short-chain ceramides that are labeled with a fluorescent moiety that can be metabolized, albeit at slow, nonphysiological rates, to short-chain fluorescent SM and glucosylceramide (7–9). In one of the first studies of SM sorting in a polarized epithelial cell line incubated with fluorescent short-chain ceramide, fluorescently labeled lipids accumulated to a higher level in the apical membrane domain compared with the basolateral domain, suggesting that the fluorescently labeled sphingolipids are enriched in apically targeted secretory vesicles (9). A study of secretory vesicle lipid content of yeast (Saccharomyces cerevisiae) cells, which produce mannosylated sphingolipids (but not SM) and ergosterol (but not cholesterol), found that two types of immunopurified secretory vesicles do not differ in terms of abundances of different lipid species (10, 11). Thus, the extent to which lipid sorting occurs in the TGN remains poorly resolved, partly because of the experimental challenges of monitoring the lipid content of individual secretory vesicles. In the present study, we established an experimental approach for visualizing SM in live cells using an engineered protein that binds native SM, and implemented it to address the question of whether SM is uniformly distributed among different types of secretory vesicles.
Results and Discussion
A Genetically Encoded Probe for Sphingomyelin.
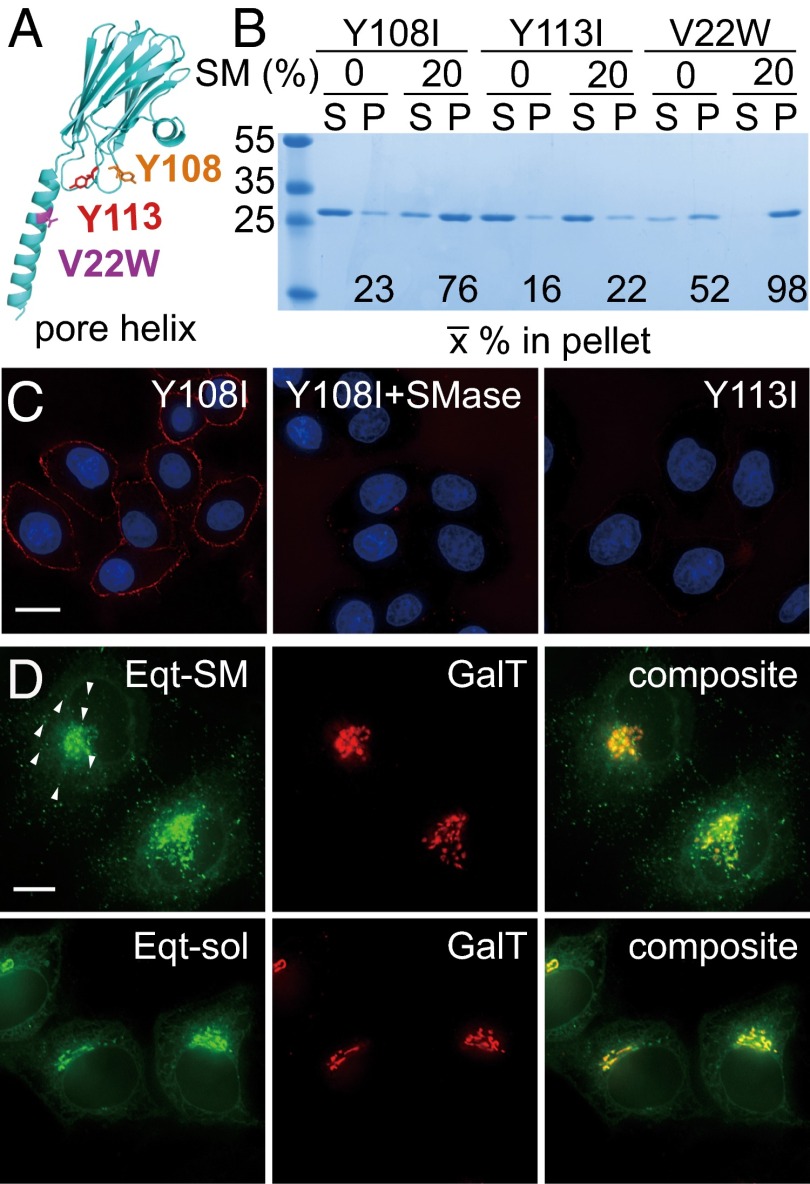
The distribution of SM on the plasma membrane has been investigated with a variety of fluorescently labeled pore-forming toxins derived from marine organisms that bind directly to SM (12, 13), and we sought to construct a SM biosensor using one of these, equinatoxin II (Eqt), as a scaffold. Eqt is a member of the actinoporin family, a group of small (∼20 kDa), exceptionally stable proteins that are secreted as inactive monomers and undergo conformational changes to oligomerize into a cytotoxic pore in membranes containing SM (14–20) (Fig. 1A). A structure of the pore formed by the homologous actinoporin fragaceatoxin C (FraC), bound to lipids (16), suggests that the pore has two SM-binding sites per protomer. Given the surface area of the pore, this stoichiometry indicates that actinoporins cannot concentrate SM above the physiological concentration of SM in Golgi membranes (21, 22). Nonetheless, two properties of native Eqt compromise its use as a SM biosensor in living cells: Eqt is cytotoxic, and although it binds specifically and with high affinity to SM, it also binds avidly to membranes that do not contain SM (23) (Fig. 1B).
Fig. 1.
Membrane-binding properties and localization of Eqt derivatives. (A) Location of mutations introduced into Eqt. The structure of an actinoporin (FraC) protomer in its oligomeric pore-forming conformation (28) is rendered, with mutations that we introduced indicated. A residue on the N-terminal helix, V22, which was changed to tryptophan to ablate pore formation, is shown in purple. Y108, which was changed to isoleucine in Eqt-SM, is in orange, and Y113, which was changed to isoleucine in Eqt-sol, is in red. (B) Vesicle-binding assays. The indicated Eqt proteins were incubated with vesicles containing 20% SM or phosphatidylcholine (and 20% cholesterol), and the vesicles were collected by centrifugation. Bound pellet (P) and unbound supernatant (S) fractions were visualized by Coomassie blue staining and quantified. The mean values of three independent experiments are shown. Molecular mass standards (kDa) are indicated on the left. The Y108 and Y113 mutants also include the V22W mutation. (C) Eqt-V22W,Y108I recognizes SM in the plasma membrane of intact cells. Recombinant FLAG epitope-tagged Eqt-Y108I or Eqt-Y113I was incubated with HeLa cells that had been incubated with SMase or mock-treated. Cells were then washed, fixed, and incubated with anti-FLAG and labeled secondary antibodies. (D) Localization of Eqt-SM and Eqt-sol in HeLa cells. Plasmids encoding the indicated proteins were transfected into HeLa cells and visualized by deconvolution florescence microscopy at 16 h after transfection. The arrows point to examples of cytoplasmic puncta that contain Eqt-SM. Maximum projections of z series are shown. (Scale bar: 10 μm.)
We sought to introduce mutations into the native, mature sequence of Eqt (codons 199–735) that reduce its pore-forming activity, and thus toxicity, as well as its SM-independent membrane-binding activity. A mutation, V22W, has been shown to stabilize Eqt in a membrane-bound state before pore formation, nearly eliminating its cytolytic activity (15). In the crystal structure of the FraC pore (16), the Val22 side chain protrudes into the hydrophobic region of the membrane bilayer, consistent with the proposal that this mutation inhibits transbilayer insertion of the pore-forming helix (15). Using a liposome cosedimentation assay, we found that recombinant Eqt(V22W) retains SM recognition, and so we retained this mutation in all subsequent modifications.
A hydrophobic surface that is rich in aromatic residues is proposed to mediate initial membrane binding independent of SM recognition (17–20, 23, 24). Accordingly, we targeted hydrophobic residues in this region for conservative side chain substitutions and assayed the lipid-binding specificities of recombinant mutant forms of Eqt by liposome sedimentation (Fig. 1A). This strategy ultimately led us to identify a conservative mutation, Y108I (Eqt-V22W,Y108I), which results in a protein that binds avidly to vesicles containing 20 mole percent SM (and 60 mole percent phosphatidylcholine and 20 mole percent cholesterol), but does not bind avidly to vesicles in which phosphatidylcholine is substituted for SM (Fig. 1B). In contrast, a Y113I mutation (Eqt-V22W,Y113I) ablates all membrane-binding activity (Fig. 1B) (23). This mutant protein can serve as a control for membrane binding in future experiments. We note that the expression, solubility, and purification behavior of each mutant protein were indistinguishable from those of wild type Eqt, suggesting that these mutations do not perturb the structural integrity of the proteins.
We further examined the membrane-binding properties of purified, FLAG epitope-tagged Eqt(V22W,Y108I) and Eqt(V22W,Y113I) in a more physiological context by examining their binding to the plasma membranes of live cultured cells that had been treated with sphingomyelinase (SMase) (Fig. 1C). The results show that Eqt(V22W,Y108I) binds to the plasma membranes of control cells, but not to those of SMase-treated cells, and that Eqt(V22W,Y113I) does not bind to the plasma membranes of untreated or treated cells.
The effects of the Y108I and Y113I mutations can now be rationalized from crystal structures of FraC (16), along with a molecular simulation of Eqt bound to SM and phosphatidylcholine micelles (25) published after our engineering efforts were completed. SM is likely distinguished from phosphatidylcholine at two binding sites. One of these sites lies at the interface between each of the eight FraC protomers, where the bound SM molecules form part of the pore (16). The second site (termed “L2” in ref. 16) lies in the hydrophobic patch that we mutagenized. The Y113I mutation likely ablates SM recognition at this site, and also impinges on an adjacent “unspecific” (i.e., a site that does not distinguish SM) lipid-binding site (termed “L3” in ref. 16). The Y108I mutation should impinge indirectly on the unspecific L3-binding site, but not affect SM recognition at the L2 site (16, 23, 25).
Eqt-SM Is Exported from the Golgi.
SM is restricted to the exofacial leaflets of cellular membranes. Thus, to visualize Eqt proteins in the secretory pathway, we replaced its native signal and pro sequences with the signal sequence of human growth hormone and fused to its C terminus the gene encoding oxGFP (26). Hereinafter, the tagged form of signal sequence-Eqt(V22W,Y108I) is referred to as “Eqt-SM,” to indicate its specificity for SM, and signal sequence-Eqt(V22W,Y113I) is referred to as “Eqt-sol” to indicate that it is a soluble version of Eqt.
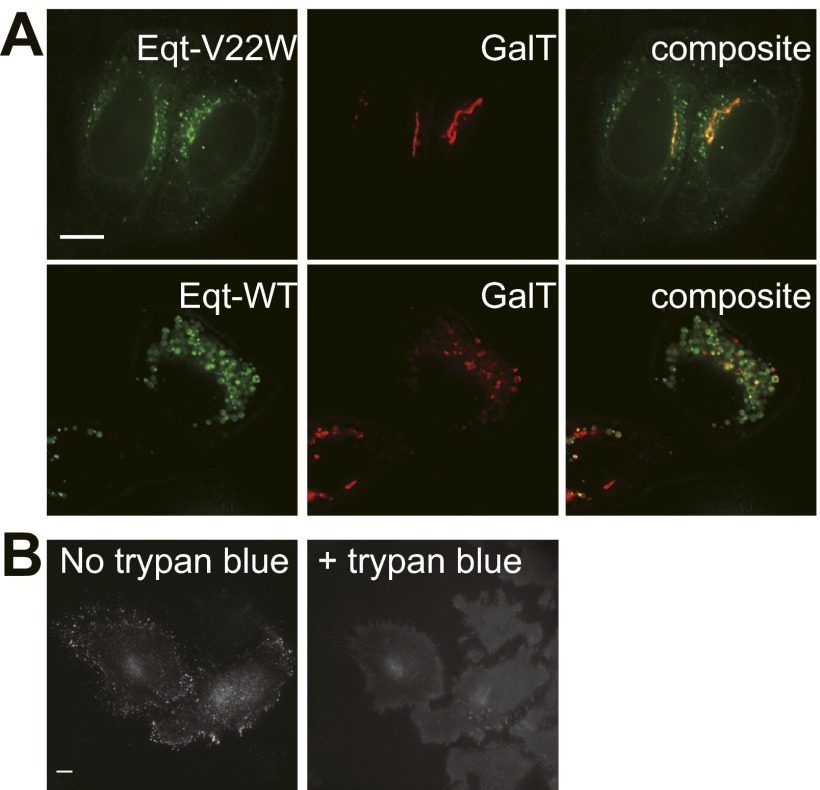
Plasmids containing fusion genes were cotransfected into HeLa cells with a plasmid that directs the expression of a fluorescently tagged form of β1, 4-galactosyltransferase (GalT-mKate2), a resident of the TGN (Fig. 1D). Anti-GFP immunoblotting showed equivalent levels of Eqt-SM and Eqt-sol when expressed in this manner. In vital dye (trypan blue) staining of transfected cultures, 16% of Eqt-V22W cells, 7% of Eqt-SM cells, 3% of Eqt-sol cells, and 2% of mock-transfected cells stained with the dye. In contrast, transfection of cells with a vector to express native Eqt (as a gene fusion similar to Eqt-SM) caused such extensive cell death that vital dye staining could not be accurately determined; the few cells that survived transfection contained numerous large vacuoles, and the GalT compartment was severely fragmented (Fig. S1A). These results confirm that the combination of V22 and Y108 mutations largely ablates the toxicity of Eqt-SM, and that its expression does not cause any gross alteration to Golgi morphology.
Fig. S1.
Localization of Eqt WT and V22W and trypan blue quenches fluorescence of Eqt-SM-pHlourin. (A) Localization of Eqt-V22W and native Eqt in HeLa cells. Plasmids encoding the indicated proteins were transfected into HeLa cells and visualized by deconvolution florescence microscopy at 16 h after transfection. Maximum projections of a z series are shown. (Scale bar: 10 μm.) (B, Left) Cells expressing Eqt-SM-pHlourin before the addition of trypan blue to the culture medium. (B, Right) The same cells photographed ∼30 s after addition of trypan blue (concentration) to the culture medium. Maximum projections of a z series are shown. (Scale bar: 10 μm.)
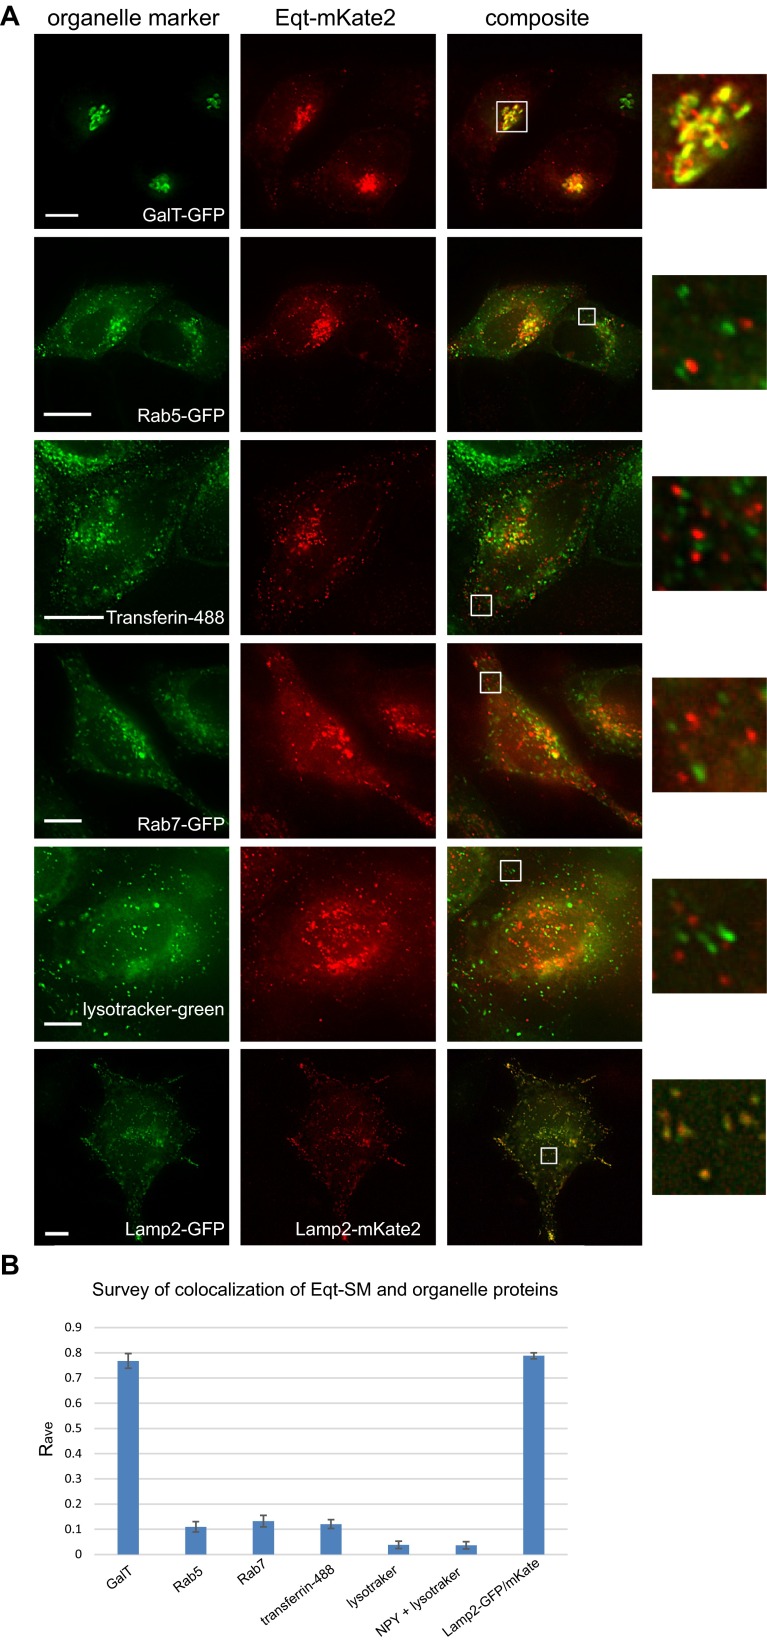
We next sought to determine whether Eqt-SM reports SM dynamics in the secretory pathway by comparing the distribution and secretion of Eqt-SM and Eqt-sol. Within the cell, Eqt-SM localized prominently to compartments decorated by GalT-mKate2 (Pearson’s correlation, Rave = 0.77) and to puncta (138 ± 47 puncta/cell) that do not contain GalT-mKate2 and are distributed throughout the cytoplasm (Fig. 1D, arrows). Although both Eqt-SM and Eqt-sol localized prominently to the Golgi apparatus, there were fewer cytoplasmic puncta containing Eqt-sol (18 ± 10 puncta/cell) compared with Eqt-SM (Fig. 1D and Table S1). Fluorescence-based colocalization studies (Fig. S2) indicated that most Eqt-SM puncta are not organelles of the endolysosomal system.
Table S1.
Quantitation of intracellular vesicles containing Eqt-SM
| Condition | Vesicles/cell |
| Eqt-SM | 138 ± 47 |
| Eqt-sol* | 18 ± 10 |
| 20 °C, 1 h | 12 ± 7 |
| 20 °C, 1 h -> 37 °C, 30 min | 42 ± 22 |
| siRNA – control | 80 ± 22 |
| siRNA – SMS1+SMS2 | 22 ± 11 |
| Vehicle control | 65 ± 14 |
| D609 (200 μM, 3 h) | 14 ± 8 |
Eqt-sol containing vesicles were quantified.
The mean number of vesicles outside the Golgi region of each cell cytoplasm (n >20 cells for each condition) was quantified using the ImageJ Analyze Particles plug-in.
Fig. S2.
Eqt-SM does not localize to organelles of the endolysosomal system. (A) Plasmids encoding the indicated proteins were transfected into HeLa cells and visualized by deconvolution florescence microscopy at 16 h after transfection. Maximum projections of a z series are shown. (Scale bar: 10 μm.) (B) Average Pearson correlation coefficients (Rave) for Eqt-SM and various endolysosomal markers were calculated for a minimum of 30 cells in three experiments. To provide benchmarks for interpreting these values, we included a positive control for colocalization, Lamp2-GFP and Lamp2-mKate2, and a negative control for colocalization (NPY-GFP, a soluble, secreted protein) and LysoTracker (Thermo Fisher Scientific).
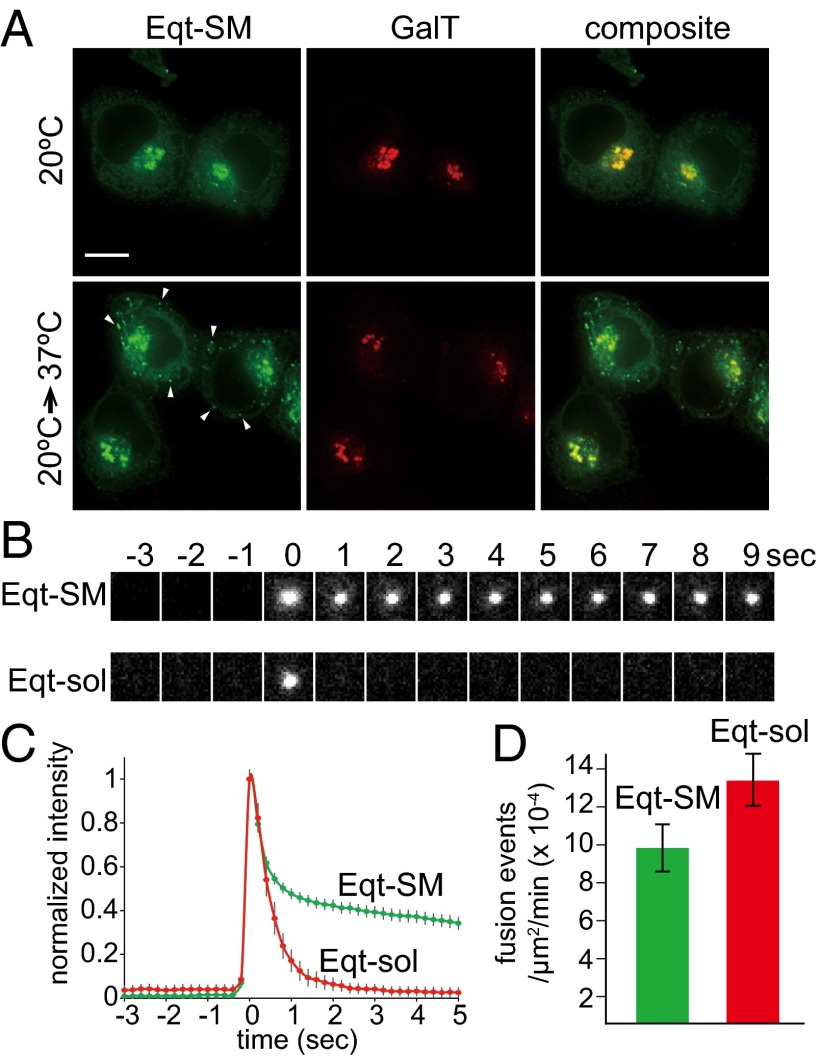
To test whether the Eqt-SM puncta are derived from the Golgi apparatus, cells were incubated at 20 °C for 3 h to block export from the TGN (27), and the appearance of Eqt-SM was determined. This incubation resulted in >10-fold depletion of Eqt-SM–containing cytoplasmic puncta (12 ± 7 puncta/cell) and accumulation of Eqt-SM in the Golgi (Fig. 2A and Table S1). Importantly, release of the 20 °C block by incubating the cells at 37 °C for just 30 min resulted in the reappearance of Eqt-SM in cytoplasmic puncta (42 ± 22 puncta/cell), demonstrating that the Eqt-SM puncta are associated with active Golgi export (Fig. 2A). These results indicate that Eqt-SM is packaged into TGN-derived vesicles.
Fig. 2.
Vesicles containing engineered Eqt fuse with the plasma membrane. (A) Blockage of export from the Golgi results in retention of Eqt-SM. HeLa cells expressing Eqt-SM (tagged with oxGFP) were incubated at 20 °C for 2 h (top row) to arrest export from the TGN and then transferred to 37 °C for 30 min. The arrows point to cytoplasmic puncta containing Eqt-SM that appeared after release of the 20 °C Golgi export block. Maximum projections of a z series are shown. (Scale bar: 10 μm.) (B) Representative TIRFM frames for Eqt-SM and Eqt-sol. (C) TIRFM showing vesicles containing Eqt-SM and Eqt-sol fused with the plasma membrane. The green and red traces indicate the average normalized fluorescence intensities for Eqt-SM (n = 413) and Eqt-sol (n = 268) vesicle fusion events, respectively (prefusion intensity defined as 0; postfusion intensity defined as 1). SDs for each point are shown. (D) Rates of Eqt-SM and Eqt-sol exocytic events as determined by TIRFM imaging and expressed as the number of fusion events per area (μm2) per time (min). SEMs are indicated. The rates are not statistically different (P ≤ 0.06).
Time-lapse imaging of Eqt-SM vesicles (Movie S1) shows that they are trafficked away from the Golgi apparatus toward the cell surface. We postulated that the cytoplasmic Eqt-SM puncta are secretory vesicles, and obtained supporting evidence for this from total internal reflection fluorescence microscopy (TIRFM) imaging of Eqt-SM (Fig. 2B and Movie S2). For these experiments, oxGFP was replaced by the pH-sensitive fluorescent protein pHlourin (28), which allows for definitive detection of exocytic events by the flash of fluorescence occurring on exposure of pHlourin to the higher pH of the culture medium. Observation of 413 exocytic events confirmed that Eqt-SM and Eqt-sol are secreted from the cell (Fig. 2 B and C). We further confirmed that Eqt-SM-pHlourin is associated with the cell surface by demonstrating that the fluorescence signal can be quenched by the addition of trypan blue (29) to the culture medium (Fig. S1B). Quantitation of the average rates of exocytosis of Eqt-SM– and Eqt-sol–containing vesicles showed that Eqt-sol vesicles fuse at a faster rate than Eqt-SM vesicles (1.3 × 10⁻³ vs. 9.1 × 10⁻⁴ events/min, respectively; P ≤ 0.06). Although this difference is of only modest statistical significance, it explains, at least in part, why at steady state fewer cytoplasmic Eqt-sol vesicles than Eqt-SM vesicles were observed (Fig. 1). The postfusion fluorescence decay profiles for Eqt-SM and Eqt-sol overlap for an initial phase (∼0.5 second) but then diverge; the signal from Eqt-sol falls to baseline within 2 s owing to its diffusion away from the membrane, whereas the Eqt-SM signal persists owing to its association with the membrane. Curiously, after exocytosis, the Eqt-SM signal typically remains near the site of exocytosis (Movie S2). This may suggest that the sites of delivery and diffusion of Eqt-SM are restrained at/within the plasma membrane; however, in this study, we focused further analyses on events before fusion.
SM Synthesis Promotes Export of Eqt-SM from the Golgi.
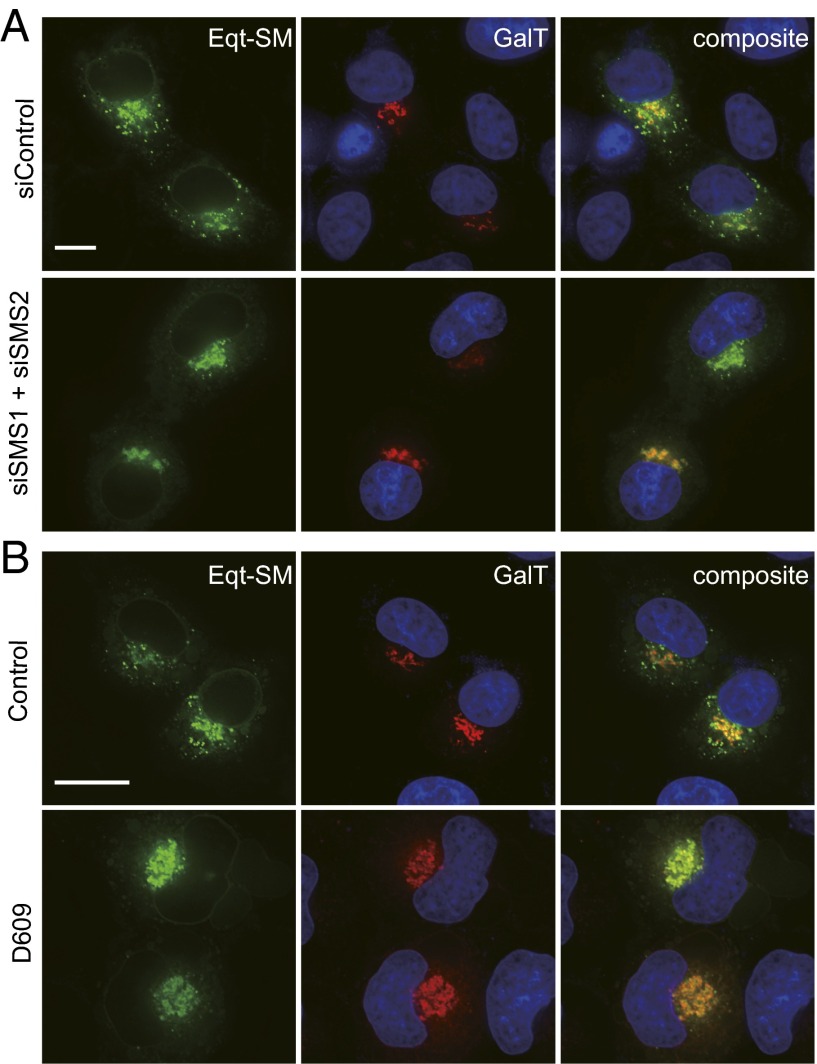
The principal site of SM synthesis is the Golgi apparatus (30–32), and inhibition of SM synthesis has been found to reduce the rate of secretion of several proteins (2–6). To examine the effect of perturbations to SM synthesis on the trafficking of Eqt-SM, we used two different methods to inhibit SM synthesis and then determined the consequences on Eqt-SM localization and secretion. First, RNA interference was used to deplete cells of the major SM synthases (SMSs), SMS1 and SMS2. The amounts of SMS1 and SMS2 mRNAs in our cultures at 2 d posttransfection were reduced by ∼70%. Our results showed a striking accumulation of Eqt-SM in the TGN and a concomitant depletion of cytoplasmic vesicles in SMS1 and SMS2 knockdown cells compared with control siRNA cells (Fig. 3A and Table S1).
Fig. 3.
Export of Eqt-SM from the Golgi is promoted by SM synthesis. (A) Eqt-SM accumulates in the Golgi of SMS1 and SMS2 RNAi cells. HeLa cells were transfected with siRNAs for 2 d, followed by transfected plasmids that direct expression of Eqt-SM and GalT-mKate2, and visualized by deconvolution florescence microscopy at 16 h after the second transfection. Nuclear DNA was stained with Hoechst 33342. Maximum projections of a z series are shown. (Scale bar: 10 μm.) (B) Eqt-SM accumulates in the Golgi of cells treated with D609, a small-molecule inhibitor of SM synthesis. HeLa cells transfected with plasmids that direct expression of Eqt-SM and GalT-mKate2 were incubated with D609 (200 μM) for 4 h. Maximum projections of a z series are shown. (Scale bar: 10 μm.)
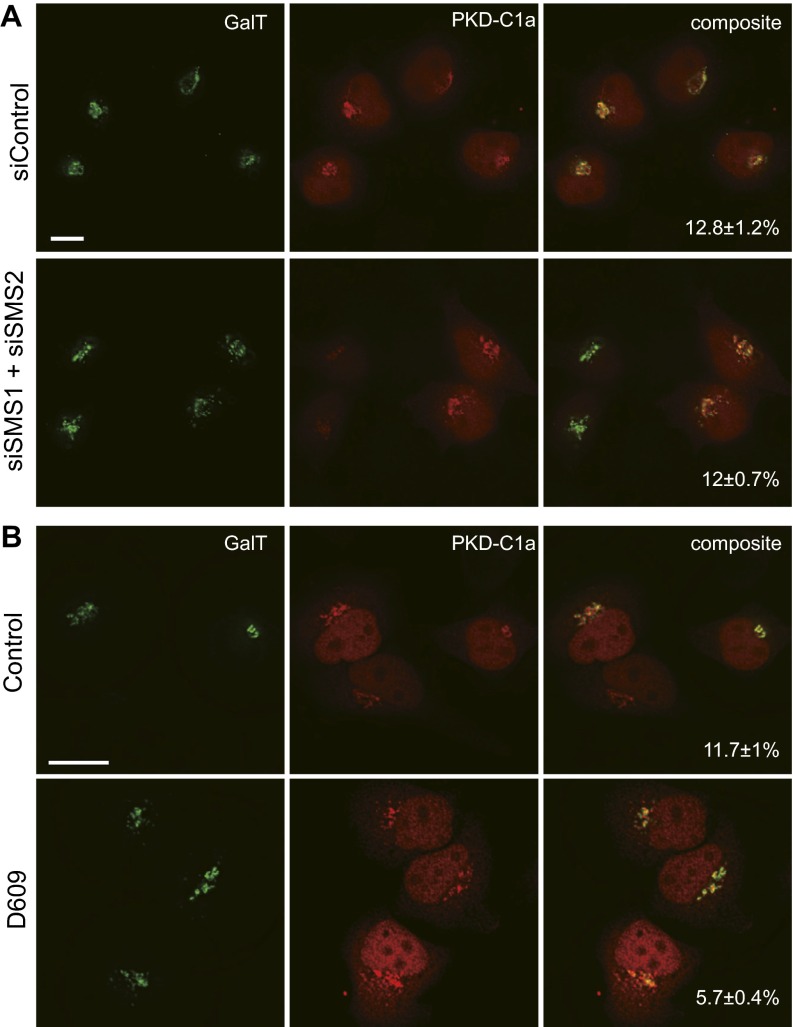
Owing to the time required for RNAi to exert this effect, and the incomplete ablation of SMS1 and SMS2 mRNAs, we complemented this experiment with a second experiment in which SM synthesis was acutely inhibited with D609, a small-molecule inhibitor of SM synthesis (33) and other metabolic activities (34, 35), for 4 h before imaging (Fig. 3B). Just as with SMS1 and SMS2 RNAi cells, we observed depletion of Eqt-SM cytoplasmic vesicles (14 ± 8 puncta/cell vs. 65 ± 14 puncta/cell in controls). DAG produced by the SM pathway is implicated in the fission of at least one class of Golgi-derived secretory vesicles from the TGN (36–38), but, importantly, quantitation of the proportion of a DAG sensor (PKD-C2) that localizes to the Golgi in SMS1 and SMS2 RNAi- and D609-treated cells (Fig. S3) showed no difference in SMS1 and SMS2 RNAi cells (∼13% in control and RNAi cells) and just a ∼50% reduction in D609-treated cells (to ∼6%). These results indicate that under our experimental conditions, neither method completely eliminates the Golgi pool of DAG.
Fig. S3.
Inhibition of SM synthesis does not ablate the Golgi pool of DAG. DAG was detected in the Golgi of SMS1 and SMS2 RNAi cells (A) and in the Golgi of cells treated with D609 (B). Cells were transfected with a plasmid that directs the expression of a GST-tagged C2 domain of protein kinase D, a DAG biosensor (37), which was detected by anti-GST immunofluorescence. The proportions of PKD_C2 fluorescence that localize to the Golgi are indicated in each micrograph (mean ± SD; n > 20). (Scale bars: 10 μm.)
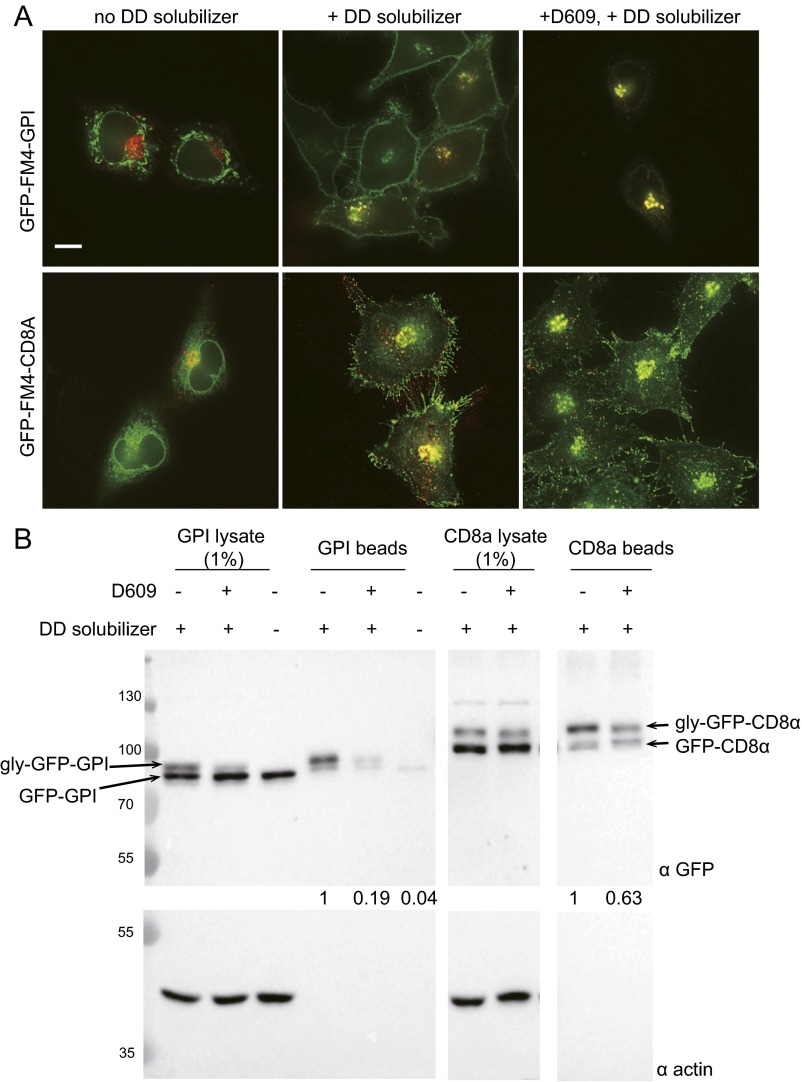
We further examined the secretory competence of D609-treated cells by monitoring the delivery of CD8α, a single-pass integral membrane protein, to the plasma membrane by fluorescence microscopy and cell surface biotinylation (Fig. S4). Our results indicate that efficient export of Eqt-SM from the Golgi requires ongoing SM synthesis, and collectively, they validate Eqt-SM as an intracellular reporter of SM trafficking. Importantly, Eqt-SM can be used to examine SM dynamics in the absence of the genetic, pharmacologic, or temperature-induced (27) perturbations commonly used in studies of post-Golgi trafficking. We took advantage of this to investigate Golgi-to-plasma membrane trafficking of native SM.
Fig. S4.
Inhibition of SM synthesis results in accumulation of GPI in the Golgi. (A) HeLa cells expressing GFP-FM4-GPI or GFP-FM4-CD8α (and Eqt-SM-mKate2) were incubated with D609 for 3 h before addition of the solubilizer molecule to release GPI and CD8α into the secretory pathway. In the absence of the disaggregating molecule (Left, “no solubilizer”), GPI or CD8α is retained in the ER. In the absence of D609, at 45 min after addition of disaggregating molecule (Center, “+ solubilizer”), both GPI and CD8 localize prominently to the plasma membrane. In cells incubated with D609 for 3 h before addition of disaggregating molecule (Right, “+ D609 + solubilizer”), GPI accumulates in the Golgi, whereas CD8α continues to be delivered to the plasma membrane. (Scale bar: 10 μm.) (B) Surface biotinylation of cells prepared as described in A. After incubation of cells with a membrane-impermeable biotinylation reagent, lysates were generated (1% shown), and biointylated proteins were captured on NeutrAvidin beads. Captured proteins were resolved and observed by SDS/PAGE and anti-GFP immunoblotting. Arrows indicate the positions of the unmodified and secreted, glycosylated (gly) forms of the proteins. Anti-actin blots report cell integrity. Molecular mass standards (kDa) are indicated.
Eqt-SM Is Sorted into a Subset of Golgi-Derived Secretory Vesicles.
We performed a TIRFM-based assay of secretory vesicle content to determine whether packaging of Eqt-SM, and thus SM, is biased toward a particular class of vesicle. To ensure that the analyses were restricted to exocytic events of the biosynthetic pathway (vs., e.g., carriers derived from the endosomal pathway), fluorescent reporter proteins were retained in the endoplasmic reticulum (ER) and then released using an inducible protein aggregation system (39), which allowed us to score a biosynthetic cohort of cargo as it traversed the secretory pathway. Two different secreted cargos, a glycophosphatidylinositol (GPI) anchored protein and CD8α, were used for this. GPI was chosen because once it is delivered to the Golgi, it associates with detergent-insoluble membranes, such as those enriched in sphingolipids and cholesterol (40). The cell surface glycoprotein CD8α was chosen because, in contrast to GPI, it is excluded from detergent-insoluble membranes in T cells, where it is natively expressed (41, 42).
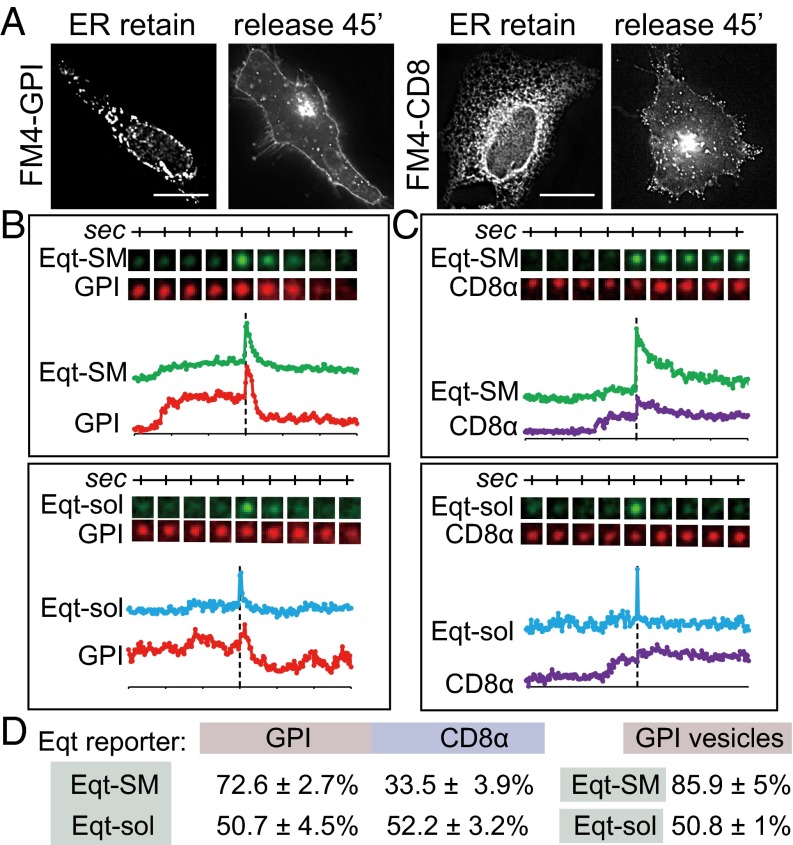
We constructed a GPI-anchored fusion protein containing a signal sequence, a red fluorescent protein (mKate2), and four FM conditional aggregation domains, followed by a GPI acceptor site (ss-mKate2-FM4-GPI). This construct also contains a consensus N-glycosylation site to allow the scoring of trafficking through the Golgi using a biochemical assay (43). A structurally analogous CD8α reporter protein (ss-mKate2-FM4-CD8α) was compared with GPI (44). These constructs were introduced into HeLa cells expressing either Eqt-SM-pHlourin or Eqt-sol-pHlourin, and the cells were maintained in the absence of the disaggregation reagent (“ER retain”) to restrict the residence of GPI and CD8 to the ER. On the addition of D/D solubilizer (Clontech), both reporters were released from the ER, trafficked to the Golgi apparatus, and then delivered to the plasma membrane (Fig. 4A). Exocytic events were recorded by two-color time-lapse TIRFM within 30–60 min after addition of the disaggregation reagent.
Fig. 4.
Eqt-SM and GPI are cosorted into secretory vesicles. (A) Trafficking of GPI and CD8α reporter proteins. HeLa cells were transfected with plasmids that direct expression of mKate2-FM4-GPI or mKate2-FM4-CD8α. In the absence of the disaggregating molecule (“ER retain”) mKate2-FM4-GPI and mKate2-FM4-CD8α are retained in the ER. Incubation of cells with the disaggregating molecule (“release 45’”) releases GPI and CD8α from the ER, and they are subsequently trafficked to the cell surface. The micrographs show cells incubated with solubilizer for 45 min. (B and C) Example TIRFM time-lapse gallery of Eqt-SM, Eqt-sol, and GPI (B) and mKate2-FM4-CD8α (C) exocytic events. GPI and CD8α reporters were coexpressed in cells with Eqt-SM-pHlourin or Eqt-sol-pHlourin and released from the ER of cells by the addition of solubilizer drug. Exocytic events were recorded by TIRFM beginning 30 min after ER release. The graphs show fluorescence intensity in each channel over time. (D) Summary of Eqt vesicle cargo content and GPI-containing vesicle content. The proportions of exocytic vesicles containing the indicated cargos (mean ± SD) are listed. The number of fusion events scored for each condition are as follows: Eqt-SM+CD8, n = 146; Eqt-SM+GPI, n = 157; Eqt-sol+CD8, n = 153; Eqt-sol+GPI, n = 136; GPI+Eqt-SM, n = 85; GPI+Eqt-sol, n = 65.
To analyze reporter protein content in each vesicle, we quantified exocytic events using two criteria. We first determined the proportions of Eqt-SM and Eqt-sol vesicles containing GPI or CD8α (Fig. 4 B and C). The results show that 72 ± 3% of Eqt-SM–containing vesicles contained GPI, whereas only 34 ± 4% of the vesicles contained Eqt-SM and CD8α (Fig. 4D). In contrast, approximately equal proportions of Eqt-sol vesicles contained GPI or CD8α (51 ± 5% and 52 ± 3%, respectively). Conversely, we calculated the proportion of GPI-containing vesicles that contain Eqt-SM or Eqt-sol (Fig. 4D). These results show that 86 ± 5% of GPI-containing vesicles contain Eqt-SM, whereas only 51 ± 1% of these vesicles contain Eqt-sol (Fig. 4D).
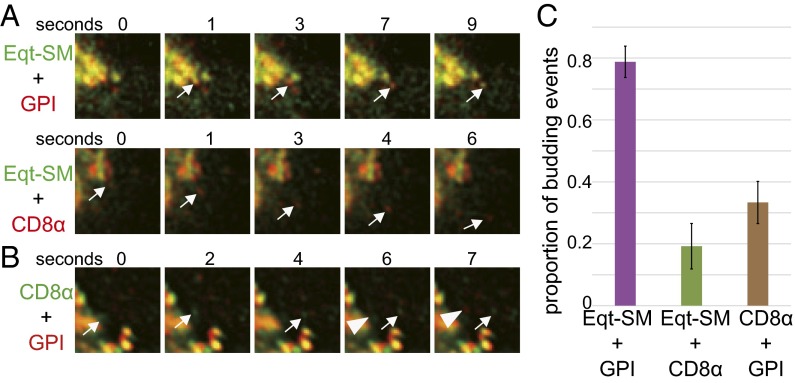
The foregoing results clearly indicate a bias in the content of Eqt-SM–, and thus SM-, containing vesicles to also contain the GPI reporter, and to be de-enriched in CD8α reporter. To determine whether sorting in the Golgi apparatus underlies these biases, we released the GPI and CD8α reporters from the ER of cells expressing Eqt-SM, and then determined the proportion of GPI- or CD8α-containing vesicles that budded from the Golgi containing Eqt-SM (Fig. 5). These analyses showed that 79 ± 0.1% (n = 33) of GPI-containing carriers contained Eqt-SM, compared with only 19 ± 0.1% (n = 26) of CD8α-containing carriers. The close correspondence of these values with those of the plasma membrane fusion assays indicates that sorting of Eqt-SM, and thus of SM, and the reporter proteins occurs before exit from the Golgi apparatus. In further support of this conclusion, GPI, but not CD8α, accumulated in the Golgi of D609-treated cells after release from the ER (Fig. S4).
Fig. 5.
Eqt-SM and GPI are cosorted into vesicles that bud from the Golgi. (A) Time-lapse galleries showing example Golgi budding events. The fluorescent proteins (mKate2-FM4-GPI or mKate2-FM4-CD8α) were released from the ER of HeLa cells stably expressing Eqt-SM-oxGFP, and image acquisition of the Golgi region was initiated 30 min later. An example of a vesicle containing both Eqt-SM and GPI is shown at top, and an example of vesicle that contains CD8α, but not Eqt-SM, is shown below. (B) Time-lapse gallery of the Golgi region of a HeLa cell expressing SBP-mKate2-GPI and eGFP-FM4-CD8α, showing examples of each reporter protein being exported from the Golgi in distinct carriers. (C) Summary of cargo loads of vesicles that bud from the Golgi. The means ± SDs of Eqt-SM-oxGFP budding events in cells expressing mKate2-FM4-GPI (n = 33), mKate2-FM4-CD8α (n = 26), and SBP-mKate2-GPI and eGFP-FM4-CD8α (n = 69) are shown.
These results led to the prediction that GPI and CD8α are exported from the Golgi via distinct carriers. To test this, we engineered cells to retain mKate2-GPI in the ER using the retention using selective hooks (RUSH) system (45) and GFP-CD8α using the aggregation-based method. Both reporters were released from the ER and arrived at the Golgi, after which the proportion of carriers that budded from the Golgi containing both proteins was determined. In close agreement with the earlier results, this analysis showed that of 69 budded carriers observed, only 33.3 ± 0.1% contained both GPI and CD8α reporters (Fig. 5).
By scoring the cargo loads of individual secretory vesicles containing an SM biosensor, Eqt-SM, as they budded from the TGN, and correlating this with the protein cargo loads of individual vesicles as they fused with the plasma membrane, we provide evidence that SM is enriched in a distinct class of secretory vesicles. The presence of Eqt-SM is strongly correlated with the presence of a secreted GPI reporter protein in the same vesicle, and anticorrelated with the presence of CD8α. Previous studies of GPI sorting and secretion in a polarized epithelial cell line were controversial (46, 47), and the results presented here firmly support the view that GPI is sorted into a distinct class of secretory vesicles that bud from the TGN (48, 49). Satisfyingly, they also support conclusions regarding the sorting of fluorescent ceramide in polarized epithelial cells (9). Nonetheless, the mechanism by which SM is selectively packaged at the TGN remains unknown. In simple membrane systems (e.g., three lipid components) at physiological temperature, SM and cholesterol coalesce into a “raft-like” liquid ordered phase (50), and lateral segregation of sphingolipid and cholesterol has been proposed to contribute to the segregation of proteins that have an intrinsic affinity for this lipid environment (51, 52). SM/cholesterol domains of sufficient size to account for secretory vesicle sorting have not been observed in the Golgi or plasma membranes, however. An alternative possibility is that spatial and temporal coupling of SM synthesis into a “biosynthetic domain” confers a kinetic advantage for enrichment of newly synthesized SM into a distinct type of transport carrier at the TGN. The availability of Eqt-SM as a reagent to track SM in cells should provide new avenues for investigating the metabolism and trafficking of this important and abundant lipid within the cell.
Materials and Methods
DNA Manipulations.
The sources of and procedures used to obtain and modify DNAs are provided in SI Materials and Methods (44, 45).
Cell Culture.
The procedures followed to culture HeLa cells are provided in SI Materials and Methods.
Recombinant Protein Expression and Liposome-Binding Experiments.
The purification, processing procedures, and conditions used for recombinant protein expression and liposome-binding assays are provided in SI Materials and Methods.
Fluorescence Microscopy.
The methods and equipment used for fluorescence microscopy and image analyses are described in SI Materials and Methods (53, 54).
Statistical Analyses.
Student’s unpaired t test was used for statistical analyses. P < 0.05 was considered to indicate statistical significance.
SI Materials and Methods
DNA Manipulations.
A codon-optimized synthetic gene encoding the Eqt (codons 199–735) sequence was synthesized by Integrated DNA Technologies. Oligonucleotides used for DNA sequencing and mutagenesis were synthesized by the Keck Biotechnology Resource Laboratory of Yale University. To generate Eqt-SM and Eqt-sol, the signal sequence from human growth hormone (amino acids 1–26) was placed upstream of the Eqt ORF (codons 199–735), followed by an unstructured linker (sequence: GSAGSAAGSGEFQSTVPRARDP) and an oxGFP, mKate2, pHluorin, or 3X FLAG epitope tag. The sequences of all new constructs were confirmed by DNA sequencing. Plasmids encoding ss-GFP-FM4-CD8α and ss-DsRed-FM4-CD8α were provided by Gregory Lavieu, Yale University, New Haven, CT (44). These plasmids were modified to replace the CD8α sequence with that of GPI. A plasmid that directs expression of SBP-eGFP-GPI (45) was modified to replace eGFP with mKate2.
Cell Culture.
HeLa cells were maintained in 5% CO2 at 37 °C in DMEM supplemented with 10% (vol/vol) FBS (Gibco). Cells were transfected with Fugene HD using 0.4 μg of plasmid DNA mixed with 1.5 μL of Fugene HD (Promega). All analyses of transfected cells were initiated at 16–20 h after transfection.
For trypan blue staining, a solution containing trypan blue (0.04%) in PBS was added to cells, and phase-contrast images were acquired. At least 1,000 cells were counted from randomly acquired fields for each condition. For the cell surface quenching experiment, trypan blue (0.11%) was added to the imaging medium, and fluorescence images were acquired immediately.
For siRNA experiments, HeLa cells were reverse-transfected with 20 nM nontargeting control DNA or 10 nM each siRNA (combined) directed against SMS1 and SMS2 using lipofectamine RNAiMax. Two days later, cells were transfected again with expression plamids using Fugene HD and then analyzed 16–20 h later. The siRNA sequences are as follows: SMS1, CTAACACTTACCTACTTATTTATCA; SMS2, CACTATCGATGTGATCATTGCTTAT. The effectiveness of siRNAs was determined by quantitative RT-PCR of total RNA purified by Qiagen RNAeasy reagents. RT-PCR was performed with iTaq Universal SYBR Green Supermix (Bio-Rad) and the CFX96 Touch Real-Time PCR Detection System (Bio-Rad).
For inhibition of SM synthesis by D609 (Santa Cruz Biotechnology), HeLa cells were washed twice with DMEM and then incubated in DMEM containing 200 μM D609 for 4 h. For the experiments shown in Fig. S4 that used controlled release of GFP-FM4-CD8α and mKate2-FM4-CD8α from the ER, cells were incubated with D609 for 180 min (37 °C), after which D/D solubilizer (Clontech) was added (1 μM) to the medium, and the cells were incubated for another 40 min before fixation.
Cell surface protein biotinylation assays were done using HeLa cells incubated in medium containing 200 µM D609 for 3 h at 37 °C, after which D/D solubilizer (1 μM) was added for 60 min. Cells were washed three times with ice-cold PBS (Gibco) and then incubated with EZ-Link Sulfo-NHS-LC-Biotin (1 mg/mL; Thermo Fisher Scientific) in PBS also containing 0.1 mM CaCl2 and 0.1 mM MgCl2 for 40 min at 4 °C. Reactions were stopped by washing cells once with PBS and then adding 100 mM glycine in PBS (with 0.1 mM CaCl2 and 0.1 mM MgCl2) for 20 min at 4 °C to quench unreacted Sulfo-NHS-LC-Biotin. After washing with PBS, the cells were collected and lysed with PBS containing 2% Nonidet P-40, 0.2% SDS, and protease inhibitors (Roche, with EDTA) for 30 min with sonication (10 W, 15 1-s pulses). The lysates were centrifuged for 20 min at 16,000 × g, and the resulting supernatants were incubated with equilibrated NeutrAvidin Agarose resin (Thermo Fisher Scientific) overnight at 4 °C while rotating. The resin was washed four times with PBS containing 2% Nonidet P-40 and 0.2% SDS, boiled in SDS loading buffer for 10 min before electrophoresis.
To label HeLa cells with recombinant Eqt, cells were treated with or without 0.5 U/mL SMase (Bacillus cereus; Sigma-Aldrich) in DMEM for 30 min at 37 °C, and then incubated with 1 µM recombinant Eqt-SM-FLAG or Eqt-sol-FLAG at room temperature for 2 min and fixed with 2% (vol/vol) PFA. Cells were then incubated with anti-FLAG (1/500; Sigma-Aldrich) for 2 h and Texas red anti-mouse (1/1,000) (Life Technologies). Cellular DNA was stained with Hoechst 33342 (Cell Signaling).
Recombinant Protein Expression and Liposome-Binding Experiments.
Eqt proteins were expressed in Escherichia coli BL21 (DE3) cells with an N-terminal His tag from pET28a-derived vectors. The cells were grown at 37 °C to an OD600 of ∼0.6–0.8, after which protein expression was induced with 0.4 mM isopropyl β-D-1-thiogalactopyranoside. Cells were harvested at 4 h after induction, then mechanically lysed in buffer consisting of 20 mM Na2HPO4/NaH2PO4, pH 7.4, 500 mM NaCl, and 25 mM imidazole supplemented with cOomplete Mini EDTA-free protease inhibitor (Roche), using a cell disruptor (Avenstin). Cleared cell extracts were applied to a HisTrap column using an AKTA Prime liquid chromatography system (GE Healthcare), and bound Eqt2 and mutants were eluted with an imidazole gradient.
Liposomes used for vesicle sedimentation assays were produced from pure synthetic lipids (Avanti Polar Lipids or Echelon Biosciences) by mixing 60 mole percent (80% for liposomes not containing SM) dioleoyl-phosphatidylcholine, 20 mole percent SM (porcine brain), and 20 mole percent cholesterol in buffer (10 mM Hepes and 100 mM NaCl, pH 6.5) by extrusion through 1-µm-pore filters using a mini-extruder (Avanti Polar Lipids). For binding assays, liposomes (2 mM lipid) were incubated with purified proteins (10 µM) for 5 min at 37 °C, after which liposomes were collected by centrifugation at 100,000 × g for 10 min at 37 °C. Supernatants were collected, and pellets were suspended in an equal volume of sample buffer. The protein band densities were determined using Image Lab software (Bio-Rad).
Fluorescence Microscopy.
For deconvoution fluorescence microscopy, cells were washed twice with PBS, and the medium was replaced with Live Cell Imaging Solution (Molecular Probes). The 3D image stacks were collected at 0.3-µm z increments on a DeltaVision Elite workstation (Applied Precision) based on an inverted microscope (IX-70; Olympus) using a 60×, 1.4 NA oil immersion lens. Images were captured with an sCMOS camera (CoolSnap HQ; Photometrics) and deconvolved with softWoRx version 6.0 using the iterative-constrained algorithm and the measured point spread function. All image analysis and preparation was done using ImageJ version 1.48. Calculations of Pearson correlation coefficients (Fig. S2) were performed using softWoRx version 6.0 with 5% background subtraction. When determining correlations with non-Golgi resident proteins, the perinuclear region of each cell containing the Golgi apparatus was masked to exclude it from the analysis.
Eqt-SM vesicle budding events at the Golgi were monitored using a HeLa cell line with an integrated, tetracycline-inducible Eqt-SM gene. Cells were transfected with plasmids expressing mKate2-FM4-GPI or mKate2-FM4-CD8α, after which tetracycline (1 μg/mL) was added immediately. At 16 h after transfection, D/D solubilizer was added, and image capture (1 Hz) was initiated after 30 min using the DeltaVision workstation.
To compare eGFP-FM4-CD8α and SBP- mKate2-GPI budding events, plasmids that direct the expression of each fluorescent protein were transfected into HeLa cells expressing the Ii-streptavidin ER hook (45). At 16 h after transfection, eGFP-FM4-CD8α was released from the ER by the addition of D/D solubilizer, and 10 min later, SBP-mKate2-GPI was released from the ER by the addition of biotin. Image capture of cells expressing both GPI and CD8α was initiated after another 15-min incubation.
TIRFM was done following a published protocol (53) using a microscope (IX-70; Olympus) equipped with argon (488 nm) and argon/krypton (568 nm) laser lines, a TIRFM condenser (Olympus or custom condenser), a 60×, 1.45 NA oil immersion objective lens (Olympus), and an EMCCD camera (iXon887; 0.18 µm per pixel, 16 bits; Andor Technology). The TIRFM system was controlled by iQ software (Andor Technology). HeLa cells were grown in MatTek dishes and imaged at 16–20 h after transfection. All experiments were done at 37 °C in Live Cell Imaging Solution (Molecular Probes) containing 10 mM glucose, pH 7.4. For two-color TIRFM experiments, the pHlourin channel was photobleached before acquisition to eliminate Eqt-SM surface fluorescence. Cells were imaged in one channel at 5 Hz or in two channels by sequential excitation at 2 Hz.
Analysis of pHluorin-tagged vesicle fusion was done following a published protocol (54). In brief, time-lapse image stacks were processed and analyzed with ImageJ. Each acquired image stack was manually reviewed to identify putative pHluorin-tagged vesicle fusion events. The coordinates of the fusion events were labeled, and a small region of interest around each fusion was used for further analysis. Circular regions with a diameter of 4 pixels were used to calculate the intensity of single vesicles. For two-color TIRFM images, the pHluorin channel was used to define the fusion events, and the intensity in the same region of the red channel was calculated. Colocalization of proteins in the same vesicle was determined based on the intensity fusion profile together with the image stacks. Videos were compressed 20-fold with ImageJ to an AVI format using a JPEG algorithm. No nonlinear adjustments were made to alter fluorescent signals.
Supplementary Material
Acknowledgments
We thank James Rothman for suggesting the use of SM-binding toxins to visualize SM in vivo, Greg Lavieu and Hong Zheng for providing reagents and advice regarding experiments, and Franck Perez for providing RUSH system reagents. We also thank Vivek Malhotra, Suzanne Pfeffer, and Félix Goñi for valuable discussions. The research reported in this paper was supported by the National Institute of General Medical Sciences, National Institutes of Health (Grants R01 GM095766 and R01 GM098498).
Footnotes
The authors declare no conflict of interest.
This article is a PNAS Direct Submission.
This article contains supporting information online at www.pnas.org/lookup/suppl/doi:10.1073/pnas.1602875113/-/DCSupplemental.
References
- 1.De Matteis MA, Luini A. Exiting the Golgi complex. Nat Rev Mol Cell Biol. 2008;9(4):273–284. doi: 10.1038/nrm2378. [DOI] [PubMed] [Google Scholar]
- 2.Litvak V, Dahan N, Ramachandran S, Sabanay H, Lev S. Maintenance of the diacylglycerol level in the Golgi apparatus by the Nir2 protein is critical for Golgi secretory function. Nat Cell Biol. 2005;7(3):225–234. doi: 10.1038/ncb1221. [DOI] [PubMed] [Google Scholar]
- 3.Villani M, et al. Sphingomyelin synthases regulate production of diacylglycerol at the Golgi. Biochem J. 2008;414(1):31–41. doi: 10.1042/BJ20071240. [DOI] [PMC free article] [PubMed] [Google Scholar]
- 4.Subathra M, Qureshi A, Luberto C. Sphingomyelin synthases regulate protein trafficking and secretion. PLoS One. 2011;6(9):e23644. doi: 10.1371/journal.pone.0023644. [DOI] [PMC free article] [PubMed] [Google Scholar]
- 5.Tafesse FG, et al. Intact sphingomyelin biosynthetic pathway is essential for intracellular transport of influenza virus glycoproteins. Proc Natl Acad Sci USA. 2013;110(16):6406–6411. doi: 10.1073/pnas.1219909110. [DOI] [PMC free article] [PubMed] [Google Scholar]
- 6.Wakana Y, et al. CARTS biogenesis requires VAP-lipid transfer protein complexes functioning at the endoplasmic reticulum-Golgi interface. Mol Biol Cell. 2015;26(25):4686–4699. doi: 10.1091/mbc.E15-08-0599. [DOI] [PMC free article] [PubMed] [Google Scholar]
- 7.Lipsky NG, Pagano RE. Sphingolipid metabolism in cultured fibroblasts: Microscopic and biochemical studies employing a fluorescent ceramide analogue. Proc Natl Acad Sci USA. 1983;80(9):2608–2612. doi: 10.1073/pnas.80.9.2608. [DOI] [PMC free article] [PubMed] [Google Scholar]
- 8.Cooper MS, Cornell-Bell AH, Chernjavsky A, Dani JW, Smith SJ. Tubulovesicular processes emerge from trans-Golgi cisternae, extend along microtubules, and interlink adjacent trans-Golgi elements into a reticulum. Cell. 1990;61(1):135–145. doi: 10.1016/0092-8674(90)90221-y. [DOI] [PubMed] [Google Scholar]
- 9.van Meer G, Stelzer EH, Wijnaendts-van-Resandt RW, Simons K. Sorting of sphingolipids in epithelial (Madin-Darby canine kidney) cells. J Cell Biol. 1987;105(4):1623–1635. doi: 10.1083/jcb.105.4.1623. [DOI] [PMC free article] [PubMed] [Google Scholar]
- 10.Klemm RW, et al. Segregation of sphingolipids and sterols during formation of secretory vesicles at the trans-Golgi network. J Cell Biol. 2009;185(4):601–612. doi: 10.1083/jcb.200901145. [DOI] [PMC free article] [PubMed] [Google Scholar]
- 11.Surma MA, Klose C, Klemm RW, Ejsing CS, Simons K. Generic sorting of raft lipids into secretory vesicles in yeast. Traffic. 2011;12(9):1139–1147. doi: 10.1111/j.1600-0854.2011.01221.x. [DOI] [PubMed] [Google Scholar]
- 12.Makino A, et al. Visualization of the heterogeneous membrane distribution of sphingomyelin associated with cytokinesis, cell polarity, and sphingolipidosis. FASEB J. 2015;29(2):477–493. doi: 10.1096/fj.13-247585. [DOI] [PubMed] [Google Scholar]
- 13.Abe M, Kobayashi T. Imaging local sphingomyelin-rich domains in the plasma membrane using specific probes and advanced microscopy. Biochim Biophys Acta. 2014;1841(5):720–726. doi: 10.1016/j.bbalip.2013.07.003. [DOI] [PubMed] [Google Scholar]
- 14.Kristan KC, Viero G, Dalla Serra M, Macek P, Anderluh G. Molecular mechanism of pore formation by actinoporins. Toxicon. 2009;54(8):1125–1134. doi: 10.1016/j.toxicon.2009.02.026. [DOI] [PubMed] [Google Scholar]
- 15.Gutiérrez-Aguirre I, et al. Membrane insertion of the N-terminal alpha-helix of equinatoxin II, a sea anemone cytolytic toxin. Biochem J. 2004;384(Pt 2):421–428. doi: 10.1042/BJ20040601. [DOI] [PMC free article] [PubMed] [Google Scholar]
- 16.Tanaka K, Caaveiro JM, Morante K, González-Mañas JM, Tsumoto K. Structural basis for self-assembly of a cytolytic pore lined by protein and lipid. Nat Commun. 2015;6:6337. doi: 10.1038/ncomms7337. [DOI] [PMC free article] [PubMed] [Google Scholar]
- 17.Rojko N, et al. Membrane damage by an α-helical pore-forming protein, Equinatoxin II, proceeds through a succession of ordered steps. J Biol Chem. 2013;288(33):23704–23715. doi: 10.1074/jbc.M113.481572. [DOI] [PMC free article] [PubMed] [Google Scholar]
- 18.Hong Q, et al. Two-step membrane binding by Equinatoxin II, a pore-forming toxin from the sea anemone, involves an exposed aromatic cluster and a flexible helix. J Biol Chem. 2002;277(44):41916–41924. doi: 10.1074/jbc.M204625200. [DOI] [PubMed] [Google Scholar]
- 19.Athanasiadis A, Anderluh G, Macek P, Turk D. Crystal structure of the soluble form of equinatoxin II, a pore-forming toxin from the sea anemone Actinia equina. Structure. 2001;9(4):341–346. doi: 10.1016/s0969-2126(01)00592-5. [DOI] [PubMed] [Google Scholar]
- 20.Anderluh G, et al. Interaction of the eukaryotic pore-forming cytolysin equinatoxin II with model membranes: 19F NMR studies. J Mol Biol. 2005;347(1):27–39. doi: 10.1016/j.jmb.2004.12.058. [DOI] [PubMed] [Google Scholar]
- 21.Keenan TW, Morré DJ. Phospholipid class and fatty acid composition of Golgi apparatus isolated from rat liver and comparison with other cell fractions. Biochemistry. 1970;9(1):19–25. doi: 10.1021/bi00803a003. [DOI] [PubMed] [Google Scholar]
- 22.van Meer G, Voelker DR, Feigenson GW. Membrane lipids: Where they are and how they behave. Nat Rev Mol Cell Biol. 2008;9(2):112–124. doi: 10.1038/nrm2330. [DOI] [PMC free article] [PubMed] [Google Scholar]
- 23.Bakrac B, et al. Molecular determinants of sphingomyelin specificity of a eukaryotic pore-forming toxin. J Biol Chem. 2008;283(27):18665–18677. doi: 10.1074/jbc.M708747200. [DOI] [PubMed] [Google Scholar]
- 24.Mancheño JM, Martín-Benito J, Martínez-Ripoll M, Gavilanes JG, Hermoso JA. Crystal and electron microscopy structures of sticholysin II actinoporin reveal insights into the mechanism of membrane pore formation. Structure. 2003;11(11):1319–1328. doi: 10.1016/j.str.2003.09.019. [DOI] [PubMed] [Google Scholar]
- 25.Weber DK, et al. Characterization of the lipid-binding site of Equinatoxin II by NMR and molecular dynamics simulation. Biophys J. 2015;108(8):1987–1996. doi: 10.1016/j.bpj.2015.03.024. [DOI] [PMC free article] [PubMed] [Google Scholar]
- 26.Costantini LM, et al. A palette of fluorescent proteins optimized for diverse cellular environments. Nat Commun. 2015;6:7670. doi: 10.1038/ncomms8670. [DOI] [PMC free article] [PubMed] [Google Scholar]
- 27.Matlin KS, Simons K. Reduced temperature prevents transfer of a membrane glycoprotein to the cell surface but does not prevent terminal glycosylation. Cell. 1983;34(1):233–243. doi: 10.1016/0092-8674(83)90154-x. [DOI] [PubMed] [Google Scholar]
- 28.Miesenböck G, De Angelis DA, Rothman JE. Visualizing secretion and synaptic transmission with pH-sensitive green fluorescent proteins. Nature. 1998;394(6689):192–195. doi: 10.1038/28190. [DOI] [PubMed] [Google Scholar]
- 29.Vranic S, et al. Deciphering the mechanisms of cellular uptake of engineered nanoparticles by accurate evaluation of internalization using imaging flow cytometry. Part Fibre Toxicol. 2013;10:2. doi: 10.1186/1743-8977-10-2. [DOI] [PMC free article] [PubMed] [Google Scholar]
- 30.Tafesse FG, et al. Both sphingomyelin synthases SMS1 and SMS2 are required for sphingomyelin homeostasis and growth in human HeLa cells. J Biol Chem. 2007;282(24):17537–17547. doi: 10.1074/jbc.M702423200. [DOI] [PubMed] [Google Scholar]
- 31.Lee NP, Mruk DD, Xia W, Cheng CY. Cellular localization of sphingomyelin synthase 2 in the seminiferous epithelium of adult rat testes. J Endocrinol. 2007;192(1):17–32. doi: 10.1677/JOE-06-0002. [DOI] [PubMed] [Google Scholar]
- 32.Ding T, et al. SMS overexpression and knockdown: Impact on cellular sphingomyelin and diacylglycerol metabolism, and cell apoptosis. J Lipid Res. 2008;49(2):376–385. doi: 10.1194/jlr.M700401-JLR200. [DOI] [PubMed] [Google Scholar]
- 33.Luberto C, Hannun YA. Sphingomyelin synthase, a potential regulator of intracellular levels of ceramide and diacylglycerol during SV40 transformation: Does sphingomyelin synthase account for the putative phosphatidylcholine-specific phospholipase C? J Biol Chem. 1998;273(23):14550–14559. doi: 10.1074/jbc.273.23.14550. [DOI] [PubMed] [Google Scholar]
- 34.Amtmann E. The antiviral, antitumoural xanthate D609 is a competitive inhibitor of phosphatidylcholine-specific phospholipase C. Drugs Exp Clin Res. 1996;22(6):287–294. [PubMed] [Google Scholar]
- 35.Adibhatla RM, Hatcher JF, Gusain A. Tricyclodecan-9-yl-xanthogenate (D609) mechanism of actions: A mini-review of literature. Neurochem Res. 2012;37(4):671–679. doi: 10.1007/s11064-011-0659-z. [DOI] [PMC free article] [PubMed] [Google Scholar]
- 36.Liljedahl M, et al. Protein kinase D regulates the fission of cell surface destined transport carriers from the trans-Golgi network. Cell. 2001;104(3):409–420. doi: 10.1016/s0092-8674(01)00228-8. [DOI] [PubMed] [Google Scholar]
- 37.Baron CL, Malhotra V. Role of diacylglycerol in PKD recruitment to the TGN and protein transport to the plasma membrane. Science. 2002;295(5553):325–328. doi: 10.1126/science.1066759. [DOI] [PubMed] [Google Scholar]
- 38.Campelo F, Malhotra V. Membrane fission: The biogenesis of transport carriers. Annu Rev Biochem. 2012;81:407–427. doi: 10.1146/annurev-biochem-051710-094912. [DOI] [PubMed] [Google Scholar]
- 39.Rivera VM, et al. Regulation of protein secretion through controlled aggregation in the endoplasmic reticulum. Science. 2000;287(5454):826–830. doi: 10.1126/science.287.5454.826. [DOI] [PubMed] [Google Scholar]
- 40.Brown DA, Rose JK. Sorting of GPI-anchored proteins to glycolipid-enriched membrane subdomains during transport to the apical cell surface. Cell. 1992;68(3):533–544. doi: 10.1016/0092-8674(92)90189-j. [DOI] [PubMed] [Google Scholar]
- 41.Arcaro A, et al. CD8beta endows CD8 with efficient coreceptor function by coupling T cell receptor/CD3 to raft-associated CD8/p56(lck) complexes. J Exp Med. 2001;194(10):1485–1495. doi: 10.1084/jem.194.10.1485. [DOI] [PMC free article] [PubMed] [Google Scholar]
- 42.Pang DJ, Hayday AC, Bijlmakers MJ. CD8 Raft localization is induced by its assembly into CD8alpha beta heterodimers, not CD8alpha alpha homodimers. J Biol Chem. 2007;282(18):13884–13894. doi: 10.1074/jbc.M701027200. [DOI] [PubMed] [Google Scholar]
- 43.Keller P, Toomre D, Díaz E, White J, Simons K. Multicolour imaging of post-Golgi sorting and trafficking in live cells. Nat Cell Biol. 2001;3(2):140–149. doi: 10.1038/35055042. [DOI] [PubMed] [Google Scholar]
- 44.Lavieu G, Zheng H, Rothman JE. Stapled Golgi cisternae remain in place as cargo passes through the stack. eLife. 2013;2:e00558. doi: 10.7554/eLife.00558. [DOI] [PMC free article] [PubMed] [Google Scholar]
- 45.Boncompain G, et al. Synchronization of secretory protein traffic in populations of cells. Nat Methods. 2012;9(5):493–498. doi: 10.1038/nmeth.1928. [DOI] [PubMed] [Google Scholar]
- 46.Polishchuk R, Di Pentima A, Lippincott-Schwartz J. Delivery of raft-associated, GPI-anchored proteins to the apical surface of polarized MDCK cells by a transcytotic pathway. Nat Cell Biol. 2004;6(4):297–307. doi: 10.1038/ncb1109. [DOI] [PubMed] [Google Scholar]
- 47.Schuck S, Simons K. Controversy fuels trafficking of GPI-anchored proteins. J Cell Biol. 2006;172(7):963–965. doi: 10.1083/jcb.200603015. [DOI] [PMC free article] [PubMed] [Google Scholar]
- 48.Paladino S, Pocard T, Catino MA, Zurzolo C. GPI-anchored proteins are directly targeted to the apical surface in fully polarized MDCK cells. J Cell Biol. 2006;172(7):1023–1034. doi: 10.1083/jcb.200507116. [DOI] [PMC free article] [PubMed] [Google Scholar]
- 49.Hua W, Sheff D, Toomre D, Mellman I. Vectorial insertion of apical and basolateral membrane proteins in polarized epithelial cells revealed by quantitative 3D live cell imaging. J Cell Biol. 2006;172(7):1035–1044. doi: 10.1083/jcb.200512012. [DOI] [PMC free article] [PubMed] [Google Scholar]
- 50.Sankaram MB, Thompson TE. Interaction of cholesterol with various glycerophospholipids and sphingomyelin. Biochemistry. 1990;29(47):10670–10675. doi: 10.1021/bi00499a014. [DOI] [PubMed] [Google Scholar]
- 51.Simons K, van Meer G. Lipid sorting in epithelial cells. Biochemistry. 1988;27(17):6197–6202. doi: 10.1021/bi00417a001. [DOI] [PubMed] [Google Scholar]
- 52.Simons K, Ikonen E. Functional rafts in cell membranes. Nature. 1997;387(6633):569–572. doi: 10.1038/42408. [DOI] [PubMed] [Google Scholar]
- 53.Rivera-Molina F, Toomre D. Live-cell imaging of exocyst links its spatiotemporal dynamics to various stages of vesicle fusion. J Cell Biol. 2013;201(5):673–680. doi: 10.1083/jcb.201212103. [DOI] [PMC free article] [PubMed] [Google Scholar]
- 54.Xu Y, et al. Dual-mode of insulin action controls GLUT4 vesicle exocytosis. J Cell Biol. 2011;193(4):643–653. doi: 10.1083/jcb.201008135. [DOI] [PMC free article] [PubMed] [Google Scholar]
Associated Data
This section collects any data citations, data availability statements, or supplementary materials included in this article.


