Significance
Metagenomics has become an accessible approach to study complex microbial communities thanks to the advent of high-throughput sequencing technologies. However, molecular ecology studies often face interpretation issues, notably due to the lack of reliable reference databases for assigning reads to the correct taxa and use of fixed cutoffs to delineate taxonomic groups. Here, we considerably refined the phylogeography of marine picocyanobacteria, responsible for about 25% of global marine productivity, by recruiting reads targeting a high-resolution marker from Tara Oceans metagenomes. By clustering lineages based on their distribution patterns, we showed that there is significant diversity at a finer resolution than the currently defined “ecotypes,” a diversity that is tightly controlled by environmental cues.
Keywords: molecular ecology, metagenomics, Tara Oceans, Synechococcus, Prochlorococcus
Abstract
Prochlorococcus and Synechococcus are the two most abundant and widespread phytoplankton in the global ocean. To better understand the factors controlling their biogeography, a reference database of the high-resolution taxonomic marker petB, encoding cytochrome b6, was used to recruit reads out of 109 metagenomes from the Tara Oceans expedition. An unsuspected novel genetic diversity was unveiled within both genera, even for the most abundant and well-characterized clades, and 136 divergent petB sequences were successfully assembled from metagenomic reads, significantly enriching the reference database. We then defined Ecologically Significant Taxonomic Units (ESTUs)—that is, organisms belonging to the same clade and occupying a common oceanic niche. Three major ESTU assemblages were identified along the cruise transect for Prochlorococcus and eight for Synechococcus. Although Prochlorococcus HLIIIA and HLIVA ESTUs codominated in iron-depleted areas of the Pacific Ocean, CRD1 and the yet-to-be cultured EnvB were the prevalent Synechococcus clades in this area, with three different CRD1 and EnvB ESTUs occupying distinct ecological niches with regard to iron availability and temperature. Sharp community shifts were also observed over short geographic distances—for example, around the Marquesas Islands or between southern Indian and Atlantic Oceans—pointing to a tight correlation between ESTU assemblages and specific physico-chemical parameters. Together, this study demonstrates that there is a previously overlooked, ecologically meaningful, fine-scale diversity within some currently defined picocyanobacterial ecotypes, bringing novel insights into the ecology, diversity, and biology of the two most abundant phototrophs on Earth.
The ubiquitous marine picocyanobacteria Prochlorococcus and Synechococcus are major contributors to global chlorophyll biomass, together accounting for a quarter of global carbon fixation in marine ecosystems, a contribution predicted to further increase in the context of global change (1–3). Thus, determining how environmental conditions control their global distribution patterns, particularly at a fine taxonomic resolution (i.e., sufficient to identify lineages with distinct traits), is critical for understanding how these organisms populate the oceans and in turn contribute to global carbon cycling. The availability of numerous strains in culture and sequenced genomes make picocyanobacteria particularly well suited for cross-scale studies from genes to the global ocean (4). Physiological studies of a range of Prochlorococcus strains isolated from various depths and geographical regions notably revealed the occurrence of genetically distinct populations exhibiting different light or temperature growth optima and tolerance ranges (5, 6). These observations are congruent, on the one hand, with the well-known depth partitioning of genetically distinct Prochlorococcus populations in the ocean, with high light-adapted (hereafter HL) populations in the upper lit layer and low light-adapted (hereafter LL) populations located further down the water column, and on the other hand, with the latitudinal partitioning between Prochlorococcus HLI and HLII clades that are adapted to temperate and tropical waters, respectively (5, 7, 8). For Synechococcus, although no clear depth partitioning (i.e., phototypes) has been observed so far, the occurrence of different “thermotypes” has been clearly demonstrated among strains isolated from different latitudes (9, 10). This latter finding agrees well with biogeographical patterns of the most abundant Synechococcus lineages, with members of clades I and IV restricted to cold and temperate waters, whereas clade II populations are mostly found in warm, (sub)tropical areas (11–13). Recently, several studies have shown that iron could also be an important parameter controlling the composition of picocyanobacterial community structure, as Prochlorococcus HLIII/IV ecotypes (14, 15) and Synechococcus clade CRD1 (16, 17) were shown to be dominant within high nutrient–low chlorophyll (HLNC) areas, where iron is limiting. Most of these studies considered members of the same clade—that is, Prochlorococcus clades HLI–VI and LLI–VI or Synechococcus clades I–IX, which are congruent between different genetic markers (13, 18–21)—as one ecotype—that is, a group of phylogenetically related organisms sharing the same ecological niche (4, 22). However, the use of a high taxonomic resolution marker, the core, single-copy petB gene encoding cytochrome b6, has revealed different spatially structured populations (subclades) within the major Synechococcus clades that were adapted to distinct niches (12), suggesting that the “clade” level might not be the most ecologically relevant taxonomic unit. Moreover, the systematic use of probes and/or PCR amplification might have led some to overlook some important genetic diversity, a drawback potentially resulting in a poor assessment of the relative proportion of cooccurring populations at any given station. In this context, the occurrence of a huge microdiversity within wild Prochlorococcus populations was recently demonstrated by estimating the genomic diversity within coexisting members of the HLII clade using a large-scale, single-cell genomics approach (23). Still, the congruency of phylogenies based on whole genome and internally transcribed spacer (ITS) suggests that ITS ribotype clusters coincide, in most cases, with distinct genomic backbones that would have diverged at least a few million years ago and the relative abundance of which varies through temporal and local adjustments (23). Thus, approaches using a single marker gene remain valid, but fine spatial, temporal, and taxonomic resolution is required to better understand how divergent picocyanobacterial lineages have adapted to different niches in the global ocean.
Here, we analyzed 109 metagenomic samples collected during the 2.5-y Tara Oceans circumnavigation (24, 25), a project surveying the diversity of marine plankton that produced nearly 11 times more nonredundant sequences than the previous Global Ocean Sampling (GOS) expedition (14). To retrieve taxonomically relevant information for picocyanobacteria and to avoid PCR-amplification biases, reads targeting the high-resolution petB gene (12) were recruited using a miTag approach (26). Even though this approach did not give us access to the rare biodiversity, these analyses unveiled a previously unsuspected genetic diversity within both Prochlorococcus and Synechococcus genera. Clustering based on the distribution patterns of picocyanobacterial communities allowed us to define Ecologically Significant Taxonomic Units (ESTUs)—that is, genetically related subgroups within clades that cooccur in the field. Analyses of the biogeography of ESTU assemblages showed that they were strongly correlated with specific environmental cues, allowing us to define distinct realized environmental niches for the major ESTUs.
Results
Revealing Novel Picocyanobacterial Diversity Using petB-miTags and Newly Assembled Sequences.
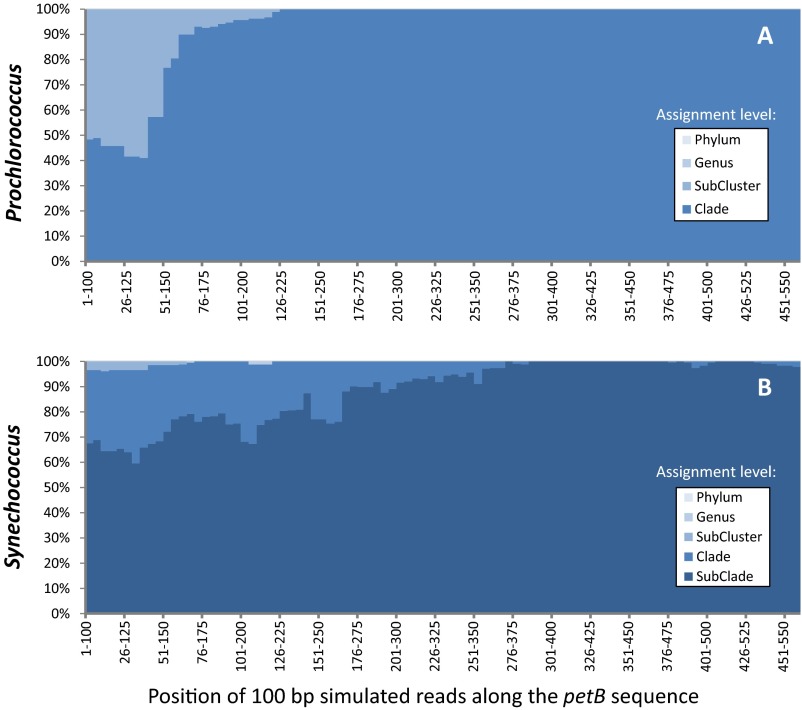
To evaluate the taxonomic resolution potential of petB miTags for assessing picocyanobacterial genetic diversity, simulated 100-bp reads (i.e., the minimum size of the Tara Oceans merged metagenomic reads) were generated by fragmenting sequences from our reference database (Datasets S1 and S2). This analysis showed that petB reads can be assigned reliably at the finest taxonomic level—that is, subclade (12)—over most of the gene length (Fig. S1). The petB-miTags approach was therefore applied to the whole Tara Oceans transect (66 stations, 109 metagenomes, 20.2 ± 9.9 Gb of metagenomic data per sample). With the exception of the Southern Ocean and its vicinity (TARA_082 to TARA_085), for which no petB reads were recruited, picocyanobacteria were present at all sampled Tara Oceans stations. From 119 to 14,139 picocyanobacterial petB reads (average: 3,309; median: 2,545) (Dataset S3) were recruited per sample using a nonredundant reference database of 585 high-quality petB sequences, representing most of the genetic diversity identified so far among Prochlorococcus and Synechococcus isolates and environmental clone libraries (Fig. 1). Interestingly, most petB sequences in our database recruited at least one read from the Tara Oceans metagenome as best hit, with the notable exception of some sequences of the cold water-adapted Synechococcus clade I, likely due to the limited sampling performed at high latitudes during the Tara Oceans expedition (27). This suggests that most genotypes known so far are sufficiently well represented in the marine environment to be detected by this approach. Still, we cannot exclude that this preliminary analysis provides a somewhat biased picture of the diversity toward the “already known,” as most current reference sequence databases are potentially skewed by culture isolation and/or amplification biases.
Fig. S1.
Variation of the assignment ability of each individual 100-bp gene fragment along the sequence of petB gene using reference databases for Prochlorococcus (A) or Synechococcus (B). Simulated reads were generated by 100-bp sliding windows along the marker sequences, and the lowest taxonomic level at which they could be assigned is shown by a different blue tone (as indicated in the Inset; for Prochlorococcus, the subcluster level actually corresponds to a LL or HL assignment, whereas the clade level corresponds to HLI–IV and LLI–IV, the lowest taxonomic level available for this genus).
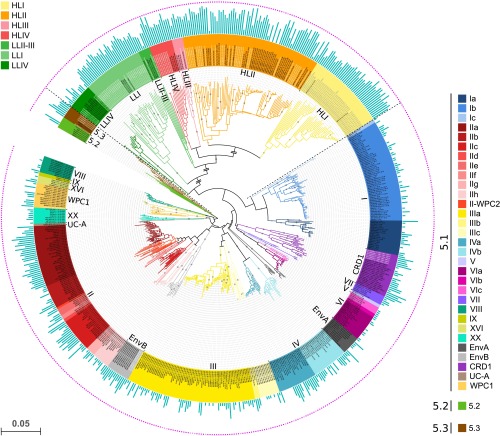
Fig. 1.
Neighbor joining tree of Synechococcus and Prochlorococcus lineages based on petB gene sequences from both isolates and environmental sequences. Diamonds at nodes indicate bootstrap support over 70%. Taxonomic assignments are given by the color codes at clade level for Prochlorococcus (top left corner) and clade (e.g., V, CRD1) or subclade (e.g., Ia-c) for Synechococcus (right side). Sequences were named after ID_subcluster_clade_subclade_ESTU for Synechococcus ID_LL or HL_clade_ESTU for Prochlorococcus. The outer pink ring indicates that the corresponding sequence in the tree was the best hit of at least one Tara Oceans picocyanobacterial read, and the inner blue bar plot shows the log2 of the number of metagenomic reads recruited for this sequence (range: 0–10.84). Sequences in black letters correspond to the initial reference database and those in white or light gray letters to newly assembled petB sequences from Tara Oceans metagenome reads. The scale bar represents the number of substitutions per nucleotide position. For improved readability, the length of three Prochlorococcus branches was reduced, as indicated by double slashes. Prochlorococcus clade assignment is as in ref. 66, whereas for Synechococcus subcluster 5.1, subclade assignments are as in ref. 67 for WPC1 and WPC2 and as in ref. 12 for all other clades.
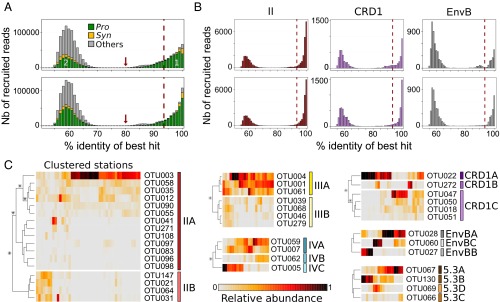
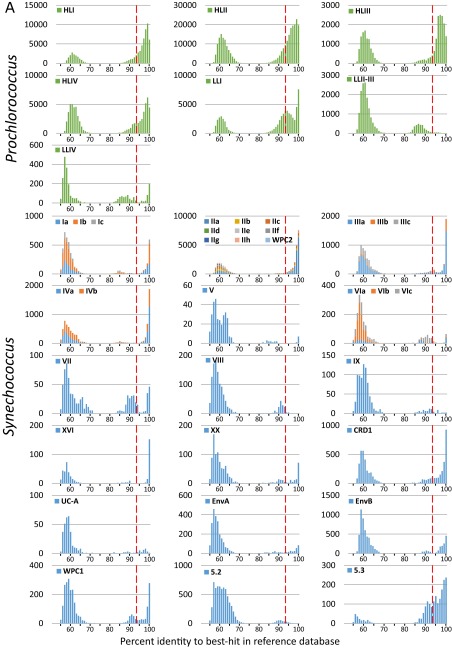
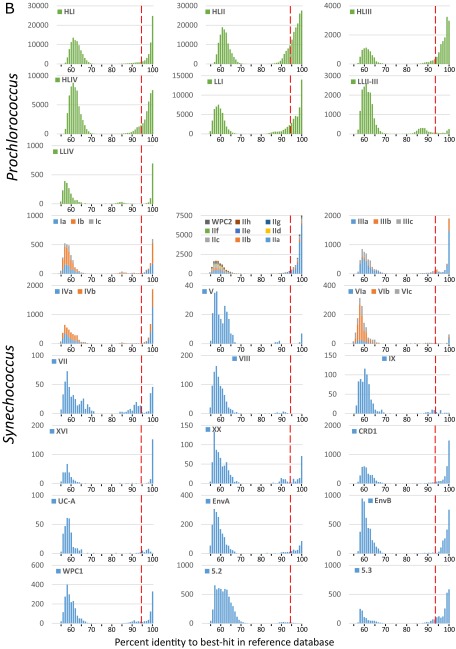
To search for potential hidden genetic diversity within the Tara Oceans picocyanobacterial communities, we then examined the percent identity of recruited reads with regard to their best hit in the petB database (Fig. 2 A and B and Fig. S2). Prochlorococcus and Synechococcus petB sequences can be easily differentiated from nonspecific signal by selecting reads above 80% identity to the closest reference petB sequence. The diversity within the most abundant Synechococcus clades (I–IV) was generally well covered by reference sequences, as most reads displayed >94% identity to their best hit in the database, a cutoff value previously shown to allow an optimal separation of Synechococcus lineages displaying distinct distribution patterns (12). In contrast, for other clades, some of the recruited reads were quite distantly related to reference sequences (i.e., between 80% and 94% identity), indicating that the in situ diversity of these clades was not fully covered by the reference database (Fig. 2B, Top panels).
Fig. 2.
Percent identity of Tara Oceans petB-mitags versus sequences of the reference database and abundance at different stations along the transect of OTUs clustered into ESTUs. (A) Distribution of the percent identity of best hits of all petB candidate reads recruited from the Tara Oceans bacterial-size fraction metagenomes against the petB reference database. Populations 1 and 2 correspond, respectively, to genuine petB reads and to nonspecific signal, due either to petB reads from organisms not included in the reference database or to petB-related genes. The gray part in population 1 corresponds to petB reads attributable to photosynthetic organisms of the reference database other than Prochlorococcus and Synechococcus. The red arrow shows the 80% cutoff used to separate the petB signal from noise. The Top and Bottom panels correspond to recruitments made before and after addition of the 136 newly assembled environmental petB sequences, respectively. (B) Same as A but for some selected Synechococcus taxa (see Fig. S2 for all other picocyanobacterial taxa). (C) Determination of ESTUs based on the distribution patterns of within-clade 94% OTUs. At each station, the number of reads assigned to a given OTU is normalized by the total number of reads assigned to the clade in this station. Stations and OTUs are filtered based on the number of reads recruited and hierarchically clustered (Bray–Curtis distance) according to distribution pattern. Only Synechococcus clades split into different ESTUs are shown (see Fig. S4 for Prochlorococcus). Stars indicate nodes supported by a P value < 0.05 as determined using similarity profile analysis (SIMPROF; test not applicable to pair comparisons).
Fig. S2.
(A) Distribution of the percent identity of petB-mitags recruited from the bacterial-size fraction of the Tara Oceans metagenomes with regard to their best hits in the reference database for each Prochlorococcus clade (top 7 graphs) and Synechococcus subclade (bottom 18 graphs) before addition of the 136 newly assembled environmental petB sequences. (B) Same as A but after addition of the 136 newly assembled environmental petB sequences. Note that clade XX was formerly called EnvC (12), but the name was changed here because there is at least one representative isolate (i.e., strain CC9616).
To have a more realistic and exhaustive view of this diversity, we assembled 136 distinct nearly complete petB sequences from environmental reads (121 Prochlorococcus and 15 Synechococcus), corresponding to the most divergent genotypes present in the whole Tara Oceans dataset. By adding these novel sequences to the reference database (see Dataset S1 and sequences in white or grey in Fig. 1), we significantly improved taxonomic assignments of petB-miTags, as 80.3% of the Prochlorococcus and 90.2% of the Synechococcus environmental petB reads were found to display >94% identity with their best hits in the enriched reference database, an increase of about 11% and 7% compared with our initial assessment, respectively (Fig. 2B and Fig. S2). Interestingly, quite a few highly divergent sequences from Prochlorococcus HLIII, HLIV, and LLI as well as Synechococcus CRD1 were assembled from TARA_052, located East of Madagascar, a station exhibiting a picocyanobacterial community atypical for this oceanic area. Although most of these additional sequences fell into known phylogenetic clades, they allowed us to better assess the extent of genetic diversity within both Prochlorococcus and Synechococcus (Fig. 1). Although only a few petB sequences, all coming from cultured strains, were available for the Prochlorococcus HLI and LLI clades before this study, we added 43 HLI sequences (within-clade nucleotide identity range: 87–99.6%), 29 LLI sequences (within-clade identity range: 85.5–99.6%), as well as 11 sequences of the uncultured HLIII and IV clades, some of which form distinct monophyletic branches comprised entirely of novel sequences (Fig. 1 and Dataset S1). Although many HLII sequences were recently obtained by high-throughput single-cell genomics focused on this clade (23), assembly of Tara Oceans reads allowed us to retrieve several divergent HLII sequences (within-clade identity range: 86.2–99.8%) including a previously unidentified well-supported group (corresponding to ESTU HLIIC), located at the base of the HLII radiation. Similarly for Synechococcus, newly assembled sequences allowed us to refine the taxonomy of several taxa, notably for CRD1 and EnvB clades as well as subcluster 5.3, three ecologically important but previously overlooked phylogenetic lineages.
Using Global Picocyanobacterial Distribution Patterns to Define ESTUs.
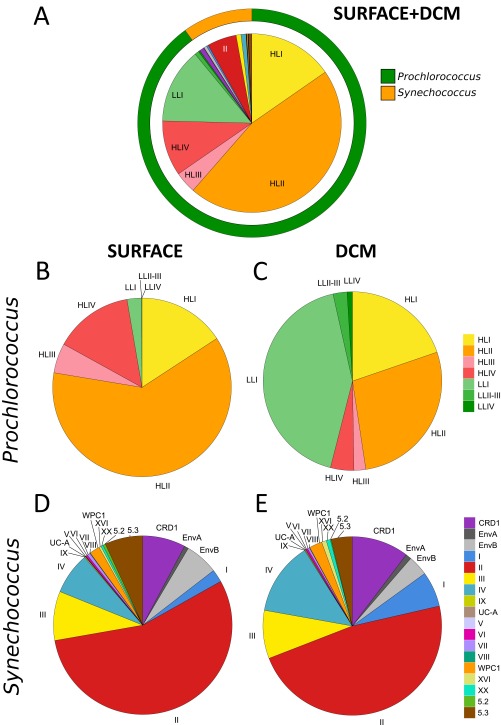
As expected from previous literature (1, 2, 5, 28), Prochlorococcus was the most abundant picocyanobacterium at the global scale, representing ∼91% of all petB reads from the bacterial size fraction, compared with 9% for Synechococcus (Fig. S3A). These percentages compare fairly well with the global contribution of Prochlorococcus and Synechococcus estimated from flow cytometry data as 80.6% (2.9 ± 0.1 × 1027 cells) and 19.4% (7.0 ± 0.3 × 1026 cells), respectively (1). The apparent lower contribution of Synechococcus in our dataset might be due to the fact that the Tara Oceans sampling was not made at random in the ocean, as most stations were located in the intertropical zone and/or selected for displaying specific traits of interest (e.g., upwelling, fronts, island proximity, etc.), whereas Flombaum et al.’s (1) dataset included many data from temperate stations, where Synechococcus is often abundant.
Fig. S3.
Global recruitments of marine picocyanobacteria petB-mitags in the bacterial size fraction of the Tara Oceans metagenomes. (A) All picocyanobacterial clades at both sampled depths. (B and C) Percentage of each Prochlorococcus clade in surface (B) and at the DCM (C). (D and E) Percentage of each Synechococcus clade in surface (D) and at the DCM (E). Note that clade XX was formerly called EnvC (12), but the name was changed here because there is now at least one representative isolate (i.e., strain CC9616).
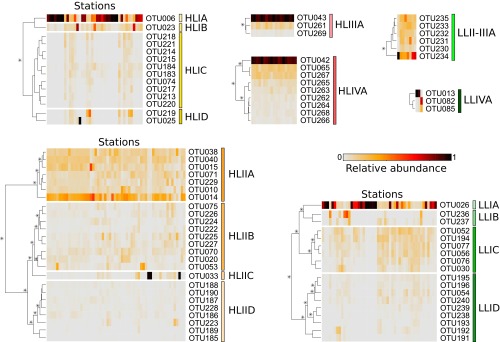
To study the global distribution of these organisms at a finer taxonomic resolution, we then examined whether Prochlorococcus and Synechococcus clades and/or subclades were ecologically meaningful. To do this, we analyzed the distribution patterns along the Tara Oceans transect of within-clade Operational Taxonomic Units (OTUs), as defined using a cutoff at 94% nucleotide identity (Fig. 2C, Fig. S4, and Dataset S4). Although for some clades OTUs displayed a homogeneous pattern over their geographical distribution area (e.g., Prochlorococcus HLIII and IV; Fig. S4) or were too scarce to reliably distinguish ESTUs (Synechococcus subcluster 5.2 and clades I, V–VIII, WPC1, EnvA, IX, XVI, XX, UC-A, and Prochlorococcus clades LLII–IV), most of the prevalent clades encompassed several coherent OTU clusters displaying distinct distribution patterns (and thus likely occupying different ecological niches) that were gathered into independent ESTUs (Fig. 2C and Fig. S4). For instance, OTUs within Synechococcus clade CRD1 could be split into three ESTUs (CRD1A–C) based on clustering of their abundance per station. Some of these ESTUs corresponded to previously described clades (e.g., Prochlorococcus HLIIIA and HLIVA) or subclades (e.g., Synechococcus IVC), whereas others gathered subclades having similar distribution patterns. For instance, Synechococcus ESTU IIA encompasses subclades IIa–d and IIf, and ESTU IIB gathers subclades IIe and IIh, as previously defined by Mazard et al. (12). Thus, although most previous field diversity studies on picocyanobacteria focused on clades (5, 13, 17, 20, 21), which were generally considered as distinct “ecotypes” (sensu, ref. 19), our data indicate that ESTUs provide a finer estimate of Prochlorococcus and Synechococcus ecotypes than do clades. These ESTUs were then used to study the biogeography of marine picocyanobacteria by clustering together stations exhibiting similar ESTU assemblages (Figs. 3A and 4A).
Fig. S4.
Prochlorococcus ESTUs based on the distribution patterns of within-clade 94% OTUs. At each station, the number of reads assigned to a given OTU is normalized by the total number of reads assigned to the clade in this station. Stations and OTUs are filtered based on the number of reads recruited. OTUs are hierarchically clustered (Bray–Curtis distance) according to their distribution pattern. Stars indicate nodes supported by a P value < 0.05 as determined using similarity profile analysis (SIMPROF; test not applicable to pair comparisons).
Fig. 3.
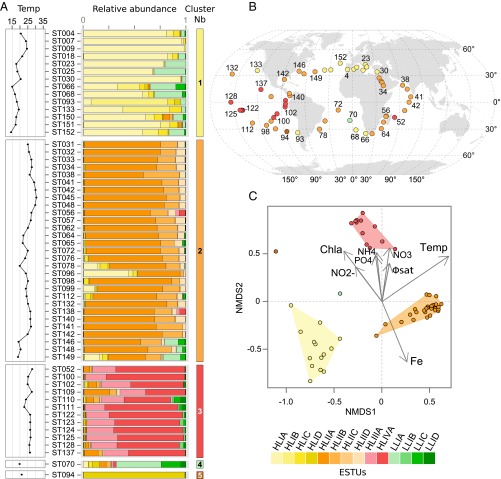
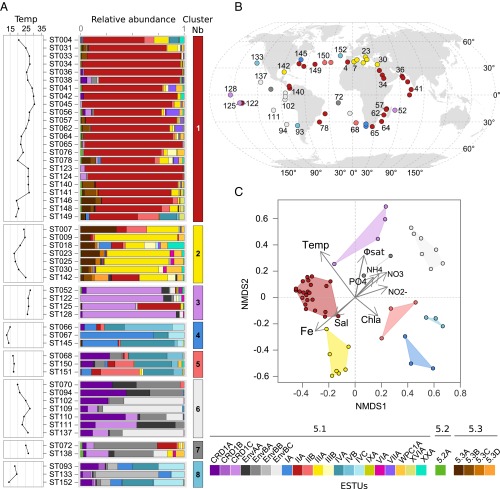
Biogeography of Prochlorococcus ESTUs in surface Tara Oceans metagenomes and relation to physico-chemical parameters. (A) Histograms of the relative abundance of Prochlorococcus ESTUs at each station sorted by similarity, as determined by hierarchical clustering (Bray–Curtis distance). Left panels indicate seawater temperature (°C) at each station. (B) Distribution of the ESTU assemblages, color-coded as in A, along the Tara Oceans transect. (C) NMDS analysis of stations according to Bray–Curtis distance between Prochlorococcus assemblages, with fitted statistically significant (adjusted P value < 0.05) physico-chemical parameters. Samples that belong to the same ESTU assemblage have been colored according to the color code defined in A, and contours of the same color gather all samples comprised within each cluster. NMDS stress value: 0.0985.
Fig. 4.
Same as Fig. 3 but for Synechococcus. NMDS stress value: 0.1369.
Biogeography of Prochlorococcus Reveals the Occurrence of Minor ESTUs with Unexpected Distribution Patterns.
Most major Prochlorococcus clades (HLI, HLII, and LLI) could be split into several ESTUs, although for the former two, one ESTU was clearly predominant (Fig. 3A and Figs. S5 and S6). Only three major ESTU assemblages were identified in surface samples: (i) dominance of HLIA ESTU in temperate waters (above 35°N and 32°S); (ii) dominance of HLIIA in warm and iron-replete waters between 30°S and 30°N, with mixed HLIA–HLIIA profiles at intermediate latitudes; and (iii) cooccurrence of HLIIIA and IVA at a ratio of ca. 1:2.6 (±0.7) in warm, HNLC areas. The low abundance of LLII–IV clades in the whole Tara Oceans dataset (Fig. S3 A–C) is likely due to the fact that they usually thrive below the deep chlorophyll maximum (DCM) (5, 29)—that is, at depths not sampled during the expedition. In contrast, most LLI ESTUs were very abundant in subsurface waters (Figs. S3 and S6) and sometimes even reached the surface (e.g., at TARA_066-070; Fig. 3A), as expected from the ability of members of the LLI clade to tolerate a strong mixing rate and short-term exposure to high light (5, 8, 29, 30).
Fig. S5.
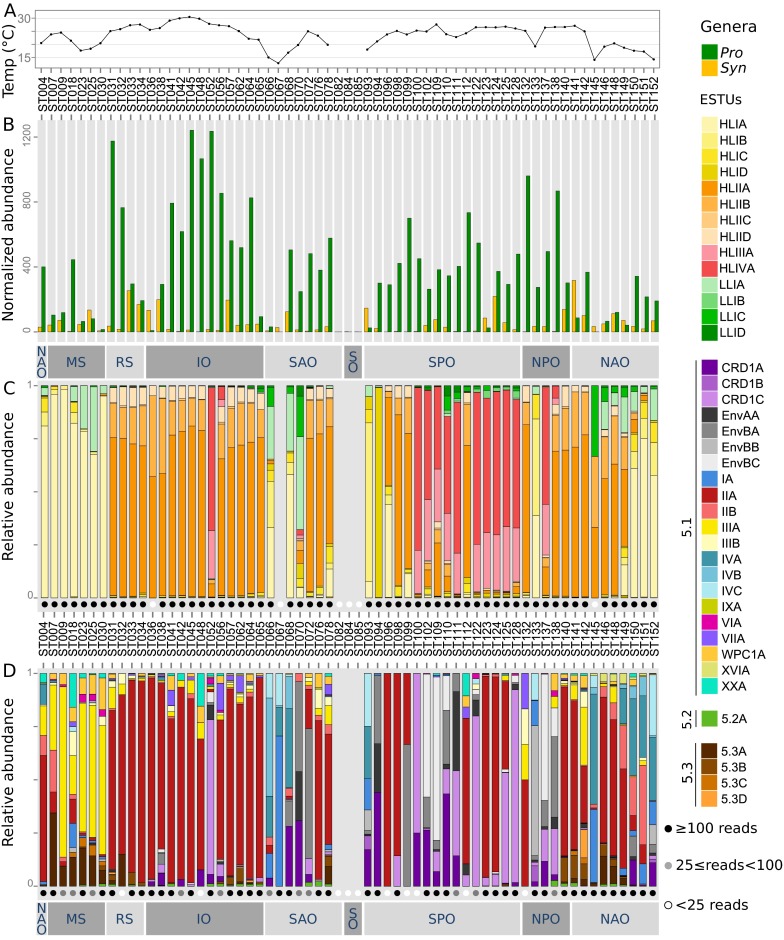
Marine picocyanobacteria community structure in Tara Oceans surface metagenomes based on petB-miTags recruitments. (A) Surface water temperature along the Tara Oceans transect. (B) Relative abundances of Prochlorococcus and Synechococcus normalized to the total number of reads at each station. (C and D) Relative abundances of Prochlorococcus and Synechococcus ESTUs, respectively. White, gray, and black dots indicate the number of reads used to build the profile, as detailed in the Inset. For readability, temperature for stations TARA_082 (7.3 °C), TARA_084 (1.8 °C), and TARA_085 (0.7 °C) are not shown on A. Abbreviations: IO, Indian Ocean; MS, Mediterranean Sea; NAO, North Atlantic Ocean; NPO, North Pacific Ocean; RS, Red Sea; SAO, South Atlantic Ocean; SO, Southern Ocean.
Fig. S6.
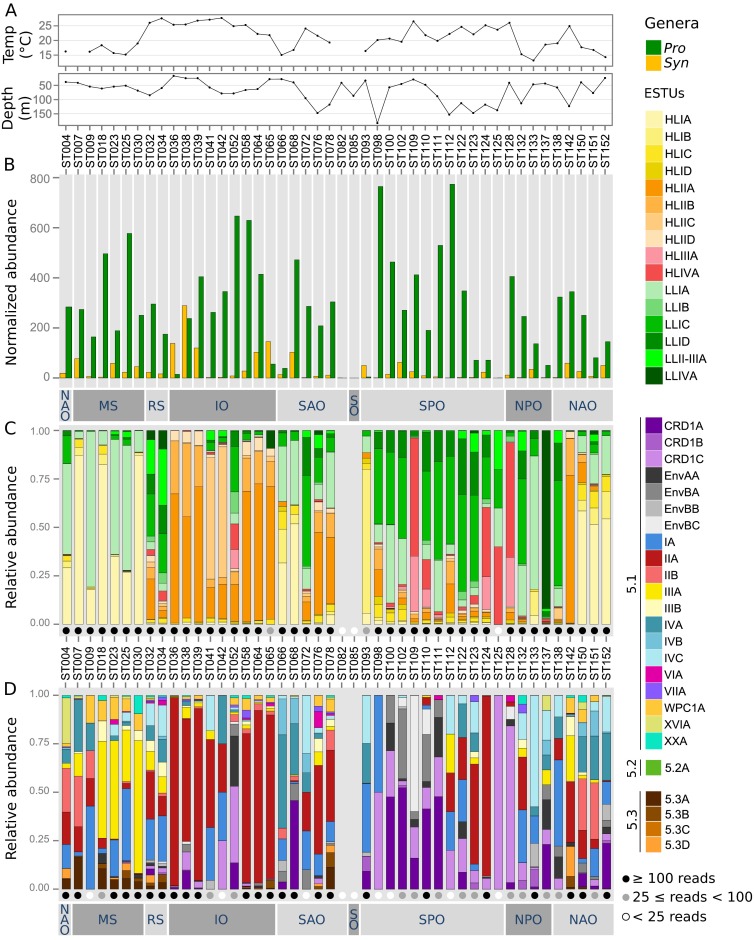
Same as Fig. S5 but at the DCM. A depth profile along the Tara Oceans transect was added. For readability, temperature for stations TARA_082 (7.0 °C) and TARA_085 (–0.8 °C) is not shown on A, and the temperature is missing for station TARA_007.
HLIIIA and HLIVA ESTUs altogether contributed to 15.5% of the Prochlorococcus community in Tara Oceans samples—that is, about as much as HLI (17%) or LLI (15.2%) (Fig. S3A). This value is slightly higher than the 9% previously estimated for HLIII–IV clades from the analysis of GOS samples (11). Consistent with previous studies (11, 15, 31, 32), we show here that their distribution covers most of the warm (>25 °C), low-Fe equatorial Pacific zone from 13°S (TARA_100) to 14°N (TARA_137), where they constitute the vast majority of the Prochlorococcus community in surface waters. In the Indian Ocean, we only observed them at two stations near the northern coast of Madagascar (TARA_052 and TARA_056), in agreement with a previous report that found them at two sites located further east (31), all these sites likely being influenced by the Indonesian throughflow originating from the tropical Pacific Ocean (33). Thus, HLIII/IV seemingly occurs over a much thinner latitudinal band (centered around 15°S) in the Indian compared with the Pacific Ocean, and they are apparently very scarce in the part of the Atlantic Ocean explored by the Tara schooner, even though the area around stations TARA_072 and TARA_070 is known to be iron-depleted (see figure S1 in ref. 17). Altogether, the distribution patterns of the dominant Prochlorococcus HL ESTUs seem to be mainly driven by temperature and iron availability, as confirmed by nonmetric multidimensional scaling (NMDS) analyses (Fig. 3C). These results are globally consistent with previous reports that analyzed Prochlorococcus clades (5, 8, 15, 29, 31), indicating that the latter studies actually targeted the dominant ESTUs.
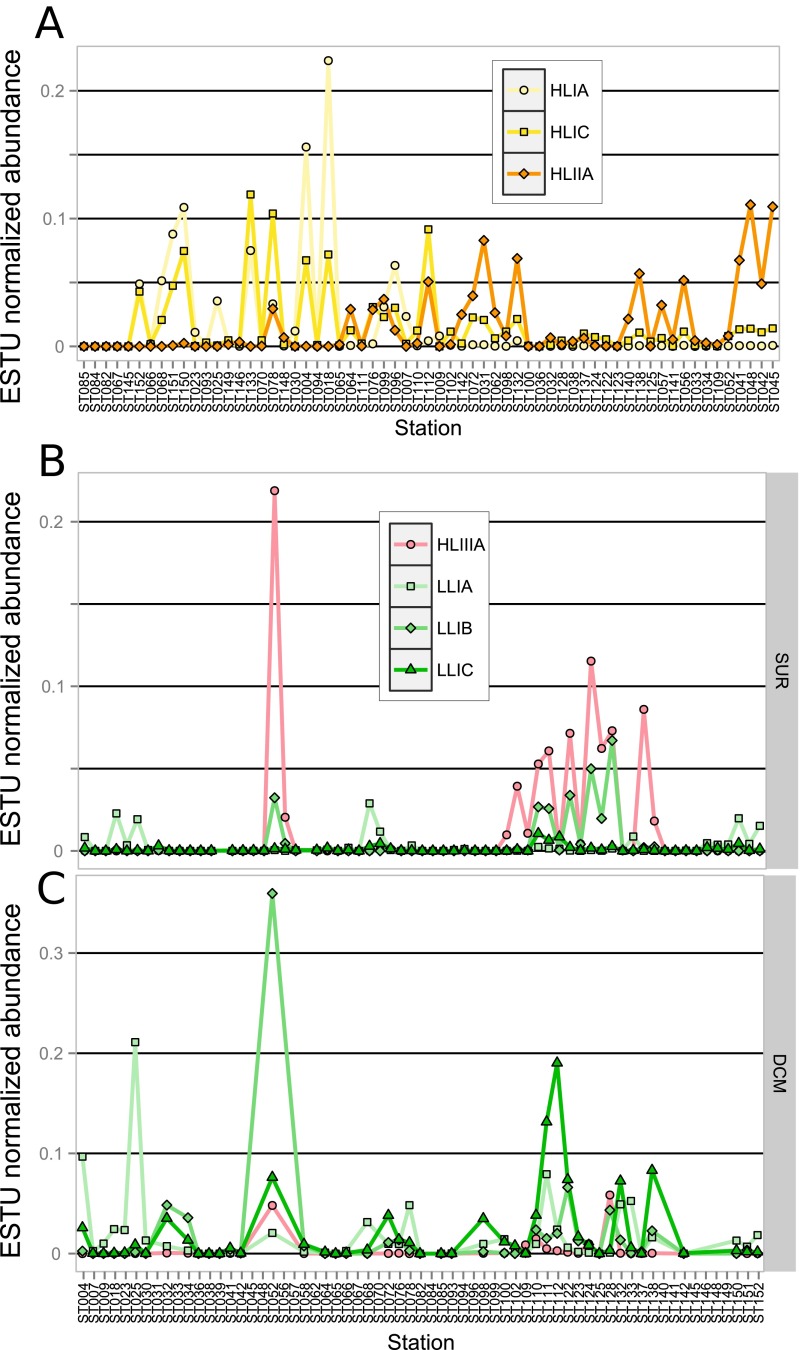
In contrast, a number of minor ESTUs were found to display distribution patterns very different from the major ESTUs of the same clade. For instance, the relative contribution of the previously mentioned novel HLIIC ESTU was highest at the DCM in the equatorial Indian Ocean (TARA_041-042; Fig. S6), suggesting that members of this ESTU are adapted to middepth waters, much like members of the LLI clade (5, 29). Similarly, ESTUs HLIB and -D can sometimes take over the prevalent HLIA populations and become abundant in surface waters at specific locations (e.g., at TARA_093 and TARA_094, respectively). In contrast, HLIC, which comprises a complex microdiversity (10 OTUs; Fig. S4), was found to exhibit a particularly large niche, cooccurring with HLIA at high latitude but also being present as the major HLI population in warm oligotrophic waters, where HLIIA dominated the Prochlorococcus community (e.g., in the Indian Ocean; Fig. S7A). This suggests that members of the HLIC ESTU might have a larger tolerance to temperature than the globally dominant HLIA. It is also worth noting that among the four ESTUs defined within the LLI clade, LLIB, which is entirely comprised of newly assembled petB sequences, dominates the LLI population in surface iron-limited HNLC areas in both the equatorial/tropical Pacific Ocean (TARA_110 to 128) and Indian Ocean (TARA_052) (Fig. S7B). Thus, adaptation to low iron conditions in Prochlorococcus might not be an exclusive trait of HLIIIA and HLIVA.
Fig. S7.
Distribution of minor Prochlorococcus ESTUs with regard to major ESTUs in the Tara Oceans metagenomes. Relative abundance normalized to the total number of reads per ESTU of (A) ESTUs HLIA and HLIC with regard to HLIIA in surface waters and (B and C) ESTUs LLIA–C with regard to HLIIIA in surface waters and the DCM, respectively. For A, stations were sorted from the lowest to highest temperatures and for B by sampling date.
CRD1 and EnvB ESTUs Are the Dominant Synechococcus Lineages in the Pacific Ocean.
Synechococcus assemblages were much more diverse than Prochlorococcus, with eight distinct ESTU clusters observed along the Tara Oceans transect (Fig. 4 A and B). None of these assemblages were specific to a given oceanic region, although cluster 2 was mainly found in the Mediterranean Sea. ESTUs IA and IVA, IVB, and/or IVC dominated at most stations within clusters 4, 5, and 8 that were typical of cold, coastal, or mixed open ocean waters at high latitude, in agreement with previous reports on the distribution of clades I and IV (11–13, 17). In contrast, ESTU IIA, dominated by a single OTU (OTU003; Fig. 2C), was by far the major component of cluster 1, an assemblage characteristic of most warm, mesotrophic, and oligotrophic iron-replete waters that encompass the vast majority of the Atlantic and Indian Oceans (Fig. 4B). Consistently, NMDS analysis showed that the occurrence of clusters 4, 5, and 8, on the one hand, and cluster 1, on the other hand, was associated with both temperature and Chl a, but in opposite ways (Fig. 4C and Fig. S8). Interestingly, although ESTU IIA was typical of warm waters, the minor ESTU IIB was found to be restricted to fairly cold (14.1–17.5 °C), mixed waters and to cooccur with IVA and -B (Fig. 4).
Fig. S8.
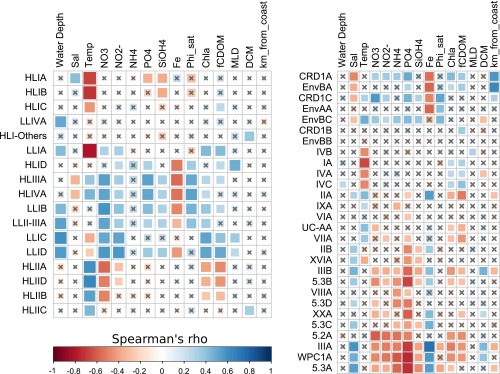
Correlation analysis between marine picocyanobacterial ESTUs and environmental parameters measured along the Tara Oceans transect for all sampled depths. (A) Prochlorococcus ESTUs. (B) Synechococcus ESTUs. The scale shows the degree of correlation (blue) or anticorrelation (red) between the two sets of data. Correlations with an adjusted P value > 0.05 are indicated by gray crosses. Abbreviations: DCM, deep chlorophyll maximum; fCDOM, fluorescence, colored dissolved organic matter; MLD, mixed layer depth; Sal, salinity; Temp, temperature; Φsat, satellite-based NPQ-corrected quantum yield of fluorescence.
Several other salient features arose from analyses of the Tara Oceans metagenomes. First, ESTU IIIA, the major contributor of cluster 2, was found only in the Mediterranean Sea (TARA_007 to 030) and the Gulf of Mexico (TARA_142) (Fig. 4 A and B). Both areas are known to be P-depleted (34, 35), suggesting that the dominance of this ESTU could be linked to a specific adaptation to P limitation, as confirmed by the inverse correlation of cluster 2 with P concentrations (Fig. 4C) and correlation analyses between IIIA and individual physico-chemical parameters (Fig. S8). The differential availability of this nutrient on both sides of the Suez Canal is therefore probably responsible for the strong community shift from a IIIA- to a IIA-dominated assemblage between the Mediterranean and Red Sea (Fig. S5), although one cannot exclude that other specific characteristics of the Mediterranean Sea, such as the presence in the eastern basin of copper, a trace metal toxic to a number of phytoplankton species (36), might also be involved. Although the dominance of clade III in the Mediterranean Sea is consistent with previous studies (13, 37), it was also reported in fair abundance along a N–S transect in the northern Atlantic Ocean in fall 2004 (AMT15) as well as in subtropical waters of the Pacific and Atlantic oceans (12, 13), whereas we found it only as a minor component of the Synechococcus community in these areas. It is possible that the relative contribution of clade III might have been overestimated using PCR-based or dot-blot hybridization approaches. A more likely explanation is that this clade is subject to seasonality, as suggested by a year-round survey in the Red Sea showing that clade III abundance peaks occur during summer and stratified conditions and remains at low concentrations over the rest of the year (19, 38). In this context, it is important to note that during Tara Oceans, the north and south Atlantic as well as the southern Indian Ocean were all sampled during winter or early spring, whereas the Mediterranean Sea was sampled in fall (Dataset S3). Hence, this warrants future global metagenomic studies at various seasons or studies at finer geographical scale looking at seasonal variations in community structure.
Also unexpected was the large global abundance (6% of total Synechococcus reads; Fig. S3) of subcluster 5.3 (formerly clade X) (39). Members of ESTU 5.3A (mostly cooccurring with ESTU IIIA) were found mostly along the transect from Panama to Bermuda (TARA_140-149), in the Mozambique Channel (TARA_057 and TARA_062), as well as at all stations of the Red Sea and Mediterranean Sea, where they contributed up to ca. 30% of the local Synechococcus community—for example, at the Gibraltar strait (TARA_007) (Fig. 4 A and B). In contrast, ESTU 5.3B (cooccurring with ESTU IIA) was always present in low relative abundance. Members of subcluster 5.3 have only been sporadically detected in previous studies mostly in open-ocean habitats in the northwestern Atlantic and Pacific Ocean and in the Mediterranean Sea (11–13, 16, 20, 37), reaching significant abundances only in transitional waters, such as the Amazon plume or the Benguela upwelling (17). These specific localizations might explain why only a few sequences of this subcluster were previously detected in the GOS database (11).
Another striking result of this study was the strong global contribution of the cooccurring clades CRD1 and EnvB (8.4% and 5.4% of total Synechococcus reads, respectively; Fig. S3 D and E). Recently, low-Fe regions of the western equatorial Pacific (5°S–10°N) and southeastern Atlantic Oceans (15–20°S) were shown to be dominated by CRD1 (16, 17), a clade that was previously thought to be specific to the Costa Rica dome, where Synechococcus cell densities are known to be the highest worldwide (40, 41). Here, we show that CRD1 and EnvB ESTUs actually codominate the Synechococcus community over most of the Pacific Ocean from 33°S to 35°N and can also be prevalent in both the South (TARA_068-072) and North Atlantic (TARA_150-152) as well as in the Indian Ocean (TARA_052) but are seemingly absent from the Mediterranean Sea (Fig. 4 A and B). So it seems that, in contrast to Prochlorococcus HLIII/IV, the distribution of CRD1 in the Pacific Ocean extends way beyond HNLC areas. Furthermore, we show here that both the CRD1 and EnvB clades actually encompassed three distinct ESTUs, displaying partially overlapping niches and falling into five clusters (3 and 5–8; Fig. 4A) that were also split far apart by NMDS analyses (Fig. 4C). CRD1B and EnvBB were restricted to high latitude, cold, mixed waters (cluster 8), where they systematically codominated with ESTU IA, IVA, and IVC. This includes TARA_093 located in the Chilean upwelling, TARA_152 in North Atlantic, as well as TARA_068 in South Atlantic corresponding to a young Agulhas ring (42). In contrast, CRD1C and EnvBC preferentially thrived in warm HNLC regions (cluster 3 and the warmest stations of cluster 6), with CRD1C largely dominating the Synechococcus population in the Pacific intertropical area as well as at the Indian Ocean station TARA_052. Comparatively, CRD1A and EnvBA, which were found in both kinds of environments, appear to be much more ubiquitous and to tolerate a much wider temperature range, not only than other CRD1 and EnvB ESTUs but also more generally than all other Synechococcus strains characterized so far in culture (9, 10). Several previous studies also reported the presence of CRD2, cooccurring with CRD1 mainly in the Costa Rica dome area and in equatorial waters and generally constituting around 10–15% of the total Synechococcus surface population (16, 17). It is tempting to speculate that the petB-defined EnvB clade, which had so far only been reported at one station in the middle of the North Atlantic basin (12), corresponds to the ITS-defined CRD2 clade. However, the different proportions of EnvB and CRD2 relative to CRD1 strongly suggests that the quantitative PCR primers used in these studies targeted only a fraction of the CRD2/EnvB population, possibly corresponding to EnvBC, which like CRD2, is positively correlated with temperature (17) (Fig. S8). Alternatively, seasonal variations might also explain the differences observed between these two datasets.
Discussion
The comprehensive nature of the Tara Oceans dataset, analyzed here at high taxonomic resolution, has markedly improved our current knowledge of the global phylogeography of marine picocyanobacteria and highlighted the key role of environmental parameters in shaping their distribution patterns. Indeed, by assigning petB-miTags recruited for each clade to narrow OTUs, then clustering those sharing a similar ecological distribution into the same ESTU, we showed that despite a wide genetic diversity, Prochlorococcus and Synechococcus communities can be split into a fairly limited number of characteristic ESTU assemblages, often dominated by one or two major ESTUs. This includes the codominating Prochlorococcus HLIIIA–HLIVA, which occurred at a fairly constant ratio (1:2.6) throughout low-Fe regions (Fig. 3A); Synechococcus IIIA, which was abundant all over the Mediterranean Sea; and CRD1 and EnvB ESTUs, codominating the Synechococcus community in vast expanses of the Pacific Ocean (Fig. 4A). Interestingly, we also showed that most picocyanobacterial clades encompass minor ESTUs that occupy niches distinct from dominant ones. This indicates that there is ecologically meaningful fine-scale diversity within currently defined Synechococcus or Prochlorococcus clades, even though the latter have often be referred to as ecotypes (5, 29). In this context, it is important to note that the Prochlorococcus genus is thought to have occurred concomitantly to the major diversification event that also led to the splitting of Synechococcus subcluster 5.1 into about 15 distinct clades (20, 43, 44), suggesting that, from a phylogenetic point of view, the whole Prochlorococcus genus is actually equivalent to a single Synechococcus clade, explaining why linking clades to a given ecological niche is trickier for the latter genus. In Prochlorococcus, several physico-chemical parameters have seemingly played a decisive role in the genetic diversification of this genus, at distinct periods of its evolutionary history, starting with light (split between LL and HL lineages), then iron availability (HLIII/IV vs. other HL), and temperature (HLI vs. HLII) (18, 21, 45). In contrast, nitrogen and phosphorus availability influenced genetic diversification only in the “leaves” of the Prochlorococcus radiation, through lateral transfers of gene cassettes conferring on populations the ability to adapt to local N- or P-depleted niches (46, 47). Despite this apparent solid relationship between Prochlorococcus phylogeny and community structure, a recent study looking at the genomic diversity of individual Prochlorococcus cells in a single water sample highlighted a huge microdiversity within the HLII clade (23). This microdiversity seemingly allows cells to adapt to slightly different selective pressures, such as biotic factors (phages, grazing, etc.). Here, we also observed large microdiversity within the HLII lineage, with 25 OTUs comprising four ESTUs, but in agreement with a recent study (48), there were only subtle differences between the distribution patterns of these intraclade groups (except for ESTU HLIIC, represented by a single OTU; Fig. S4), confirming that abiotic factors have only marginally affected the genetic diversification within this clade. In contrast, the microdiversity that we identified within HLI and LLI has seemingly allowed members of these clades to colonize ecological niches clearly different from that of the dominant ESTUs, extending the global niche occupied by these lineages. This includes LLIB, which seems to be adapted to Fe-limited surface waters, much like HLIIIA–IVA, as well as HLIC, which thrives not only in cold temperate waters, as do the more typical HLIA, but also in warm subtropical waters, where it cooccurs with the dominant HLIIA (Fig. S7A). This is consistent with the recent finding that HLI subclades are driven by distinct environmental traits (48) and that even in HLII-dominated waters, HLI is never competed to extinction (7).
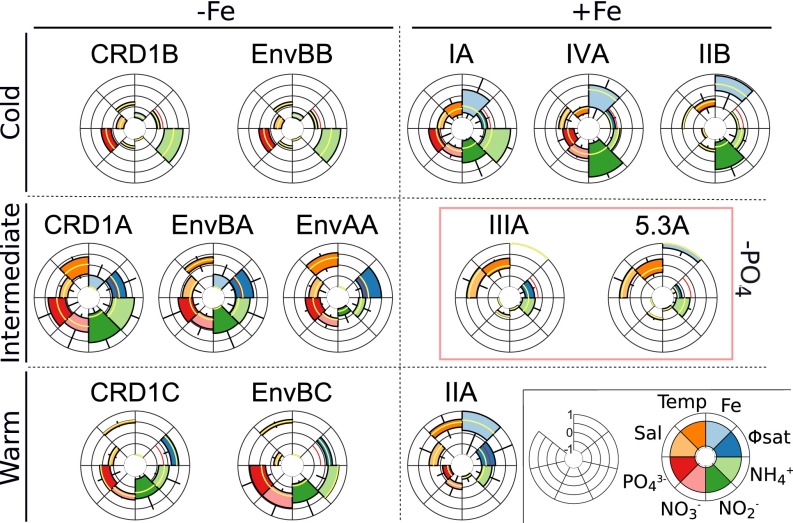
Similarly, splitting Synechococcus clades into ESTUs revealed that this genus comprises a number of specialists, mostly characterized by their respective temperature and Fe requirements (Fig. 5). Although CRD1B/EnvBB, CRD1A/EnvBA/EnvAA, and CRD1C/EnvBC were, respectively, found in cold, intermediate, and warm waters with various degrees of Fe limitation, other ESTUs preferentially thrive in regions where this nutrient is not limiting in either cold (IA, IVA, IIB), intermediate (IIIA, 5.3A), or warm (IIA) waters. The third most discriminating parameter appears to be P limitation that only ESTUs IIIA and 5.3A can stand, but only in Fe-replete conditions. It is also worth noting that several ESTUs, such as those classified as “temperature intermediate,” display a larger tolerance range with regard to temperature than their “cold” and “warm” counterparts (Fig. 5). Altogether, these results temper the paradigm of Synechococcus being a generalist and physiologically more plastic than Prochlorococcus, which mainly relied on the ability of the former to colonize much wider ecological niches than the latter and on the apparent absence of genome streamlining in Synechococcus compared with Prochlorococcus (18, 49–51). Thus, our results demonstrate that the observed ubiquity of the Synechococcus genus as a whole (1, 2) in fact rests on a complex suite of specialists adapted to fairly narrow niches, as is the case for Prochlorococcus.
Fig. 5.
Realized environmental niche of the major Synechococcus ESTUs in surface waters. For each ESTU, stations were sorted by order of normalized abundance, and only stations cumulating 80% of the total abundance were used to draw the graph. Boxplots represent the range of each parameter (in relative units) tolerated by any given ESTU, and the median is indicated by a yellow line. ESTUs are organized according to their relative temperature range (cold, intermediate, or warm), tolerance to iron limitation (–Fe, +Fe), and tolerance to phosphate limitation (–PO4). Please note that the two proxies used to estimate Fe limitation ([Fe] derived from the ECCO2-Darwin model and the Φsat index; the red line indicates the 1.4% value above which iron is considered limiting) (56) are sometimes contradictory—for example, for CRD1B and EnvBB.
Focusing on shifts in community composition associated with changes in local environmental conditions or to physical barriers (Figs. S5 and S6) provided additional insights into this global picture and revealed that some ESTUs behave as opportunists. For instance, this is the case off the Marquesas Islands, where the proximity of the coast induced an iron enrichment at TARA_123 and 124 compared with a typical HNLC situation at TARA_122 and TARA_128. Although CRD1C dominated at the latter stations, ESTU IIA took over this local population in these iron-replete patches (with an intermediate situation at TARA_125; Fig. S5). By comparison, the Prochlorococcus abundance drastically dropped at TARA_123 but without any significant change in the community structure, suggesting that the minor HLIIA component of this assemblage was not responsive enough to local Fe enrichment to outcompete the dominant HLIIIA/IVA population. Another abrupt shift in community composition occurred at the Agulhas choke point off the southern tip of Africa, where huge anticyclonic rings (i.e., Agulhas rings) are formed in the Indian Ocean and then drift across the South Atlantic (42, 52). The strong drop in temperature, occurring within the youngest ring (TARA_068), was likely responsible for a large part in the shift from a typical subtropical ESTU assemblage in the Indian Ocean, dominated by Prochlorococcus HLIIA–B and Synechococcus IIA (TARA_064-065), to a cold-water ESTU assemblage (HLIA, LLIA, CRD1A, EnvBA, and IVA–B) at TARA_068 (Fig. S5), suggesting that the latter ESTUs might also have an opportunistic behavior with regard to their warm-waters counterparts. Although these two examples correspond to biogeochemical processes likely occurring at different time scales, the observed ESTU assemblage changes likely result from differences in the intrinsic dynamics of ESTUs within both genera, the most adapted one outcompeting others in favorable ecological conditions, with Synechococcus displaying a more opportunistic behavior than Prochlorococcus.
Our results also raise several questions that can only be addressed in the laboratory or in silico. From a physiological point of view, the fact that some ESTUs seemingly get counterselected in response to nutrient enrichment (e.g., iron in the case of CRD1C) suggests that, as proposed for Prochlorococcus HLIII/IV (31), their growth capacity in nutrient-replete conditions is lower than that of opportunistic ESTUs (e.g., IIA), and this could be checked by comparing representative strains of these two lifestyles in single cultures or cocultures. It is also unclear yet whether differences between these two behaviors are due to the loss of genes costly to maintain for the cells, to a better affinity of core enzymes (e.g., for nutrient scavenging), and/or to the acquisition of specific gene sets by lateral gene transfer, as reported for Prochlorococcus regarding phosphate and nitrogen uptake and assimilation (46, 47). Adaptation to low Fe is particularly striking in this context, as our study showed that this ability seems to have appeared several times during evolution in quite distantly related ESTUs—namely, Prochlorococcus HLIIIA/HLIVA, which likely occurred via a single diversification event, and LLIB as well as Synechococcus CRD1A, CRD1C, EnvBA, EnvBC, and EnvAA (Fig. 5). Although no Prochlorococcus isolates of HLIIIA/IVA are available in culture yet, sequencing of single amplified genomes suggested that these organisms have adapted to Fe-limited environments by lowering their cellular Fe requirement through loss of genes encoding Fe-rich proteins and by acquiring siderophore transporters for efficient scavenging of organic-bound forms of this element (31, 32). Genomic comparison of Synechococcus strains, including representatives of the different CRD1 ESTUs, as well as whole genome recruitment of metagenomic data should allow one to check whether a similar adaptation process has occurred in this genus.
In conclusion, although very few studies have so far combined information from high-resolution phylogenetic markers and geographical distribution to detect ecologically coherent taxonomic groups (e.g., refs. 48, 53), we show here that this approach can bring invaluable insights for deciphering the links between genetic diversity and niche occupancy. Indeed, the definition of within-clade ESTUs using a reference petB database enriched with ecologically relevant and distantly related sequences assembled from Tara Oceans reads has allowed us to obtain clear-cut spatial distribution patterns for taxa within both Prochlorococcus and Synechococcus genera, indicating that we explored the diversity of the picocyanobacterial community at the right taxonomic resolution. Additionally, in contrast to other phytoplankton groups, such as diatoms (54), these biogeographical patterns were found to be tightly controlled by environmental factors. Besides helping to refine models of picocyanobacterial distributions and predicting their behavior in response to ongoing climate change, knowledge of the oceanic areas where poorly characterized ESTUs predominate will also guide future strain isolation (e.g., for the yet uncultured EnvA and EnvB) and sequencing efforts. Characterizing and comparing such ecologically representative strains will help further unveil the basis of niche partitioning.
Materials and Methods
Genomic Material.
This study focused on 109 Tara Oceans metagenomes corresponding to 66 stations along the Tara Oceans transect for which a “bacterial size fraction” was available (i.e., 0.2–1.6 μm for TARA_004 to TARA_052 and 0.2–3 μm for TARA_056 to TARA_152). Water samples were collected at two depths, surface and DCM, the latter sample sometimes being merely collected in the upper mixed layer, when the DCM was not clearly delineated (Dataset S3). Metagenomes were sequenced using the Illumina technology as overlapping paired reads of ∼100/108 bp with various sequencing depths, ranging from 16 × 106 to 258 × 106 reads after quality control, corresponding to an average 20.2 ± 9.9 Gb of sequence data per sample. Reads were merged using FLASH v1.2.7 with default parameters (55) and cleaned based on quality using CLC QualityTrim v4.10.86742 (CLC Bio), resulting in 100–215-bp fragments. Dataset S3 describes all metagenomic samples with location and sequencing effort. All metagenomes and corresponding environmental parameters measured during the Tara Oceans expedition are available at www.pangaea.de/, except for the iron and ammonium data, which were simulated with the Estimating the Circulation and Climate of the Ocean (ECCO2)-Darwin model and the iron limitation index Φsat (56) and are available in Dataset S3.
Building of the PetB Database.
To recruit and taxonomically assign metagenomics reads targeting the high-resolution petB gene marker, we analyzed 1,091 sequences of the petB gene from cultured isolates and environmental samples and built a reference database including all nonredundant high-quality sequences of this marker available for the marine picocyanobacteria Prochlorococcus (69 sequences covering 7 clades) and Synechococcus (399 sequences covering 3 subclusters, 22 clades, and 30 subclades). The dataset also includes outgroup sequences from publicly available cyanobacteria, including marine (13 sequences) and freshwater isolates (40 sequences), as well as representatives of the main marine eukaryotic phytoplankton taxa and eukaryotic cyanobionts (64 plastid petB sequences), raising the number of petB sequences to 585 (Datasets S1 and S2). To avoid differential alignment effects at the edge of the reference sequences, all sequences were aligned and trimmed to 557 bp. This database was secondarily complemented by 136 petB sequences assembled from selected Tara Oceans reads displaying less than 94% identity with previously known petB sequences (yet some of these sequences could exhibit more than 94% identity with one another).
Read Recruitments.
Targeted petB fragment recruitments were performed using a two-step protocol. To maximize the diversity while reducing the weight of the resulting tabulated files, translated sequences of the nonredundant petB database were used to recruit candidate petB gene fragments by BLASTX (v2.2.28+) using default parameters but by limiting the results to one target sequence. These petB candidates were then compared with the full reference petB database using BLASTN (v2.2.28+) with sensitive configuration (–task blastn –gapopen 8 –gapextend 6 –reward 5 –penalty -4 –word_size 8) and cutoffs to reduce the weight of resulting tabulated files (–perc_identity 50 –evalue 0.0001).
Reads with more than 90% of their sequence aligned and with more than 80% sequence identity to their BLASTN best hit (see Results for the determination of this cutoff) were selected as genuine picocyanobacterial petB, taxonomically assigned to their BLASTN best hit, and subsequently used to build per-strain read counts tables. Counts were then aggregated by clade or ESTU and subsequently used to build pie charts or community structure profiles.
Phylogenetic and Statistical Analyses.
Phylogenetic reconstructions were based on multiple alignments of petB nucleotide sequences generated using MAFFT v7.164b with default parameters (57). A maximum likelihood tree was inferred using PHYML v3.0–20120412 (58), with the HKY + G substitution model, as determined using jModeltest v2.1.4 (59), and the estimation of the gamma distribution parameter of the substitution rates among sites and of the proportion of invariables sites. Confidence of branch points was determined by performing bootstrap analyses including 1,000 replicate datasets. Phylogenetic trees were edited using the Archaeopteryx v0.9901 beta program (60) and drawn using iTOL (itol.embl.de) (61). OTUs for the petB reference dataset at 94% were defined by nucleotide identity using Mothur v1.34.4 (62).
In each clade, ESTUs were defined using a type 3 SIMPROF approach (53) by considering (i) for Prochlorococcus, stations with more than 100 reads and OTUs recruiting more than 150 reads and (ii) for Synechococcus, stations with more than 20 reads and OTUs recruiting more than 25 reads. Hierarchical clustering was performed on the remaining stations and OTUs using the Bray–Curtis distance between relative abundance profiles using the heatmap.3 function in GMD v0.3.1.1 R package (ward algorithm) (63). Statistical significance of the difference between clusters was first assessed by a permutation analysis using the clustsig v1.1 R package (alpha of 0.05, Bray–Curtis distance, otherwise default parameters). ESTU delineation was then manually refined; for example, ESTUs were sometimes defined from single OTUs if the Bray–Curtis distance was >0.65 or if pairs of OTUs were not defined as coherent groups because all OTUs within a clade were equally distant from each other. In contrast, some potential ESTUs were not considered as reliable—for example, if high Bray–Curtis distances were due to differences in abundance and not in distribution.
Hierarchical clustering and NMDS analyses of stations were performed using R packages cluster v1.14.4 (64) and MASS v7.3–29 (65), respectively. petB-miTag contingency tables aggregated at the ESTU level were filtered as above and normalized using Hellinger transformation that gives lower rates to rare ESTUs. The Bray–Curtis distance was then used for both clustering (agnes function, default parameters) and ordination (isoMDS function; maxit, 100; k, 2). All displayed clusters were significant (P < 0.01, permutation tests). Fitting of environmental parameters on NMDS ordination was performed with function envfit in the vegan v2.2–1 package, and P value based on 999 permutations was used to assess the significance of the fit, and only environmental parameters showing an adjusted P value below 0.05 were used.
Visualization of Realized Environmental Niches.
To visualize the tolerance range of each ESTU with regard to physico-chemical parameters, values were scaled and reduced before analysis. For each ESTU, Tara Oceans stations were sorted by order of abundance, and stations gathering 80% of all reads of the given ESTU were kept. A boxplot was then computed for each parameter taking into account the values of this parameter in the kept stations.
Supplementary Material
Acknowledgments
We thank M. Follows and O. Jahn for providing us with ECCO2-Darwin simulation values for iron and S. Speich for fruitful discussions on oceanographic context. We also thank the support and commitment of the Tara Oceans coordinators and consortium, agnès b. and E. Bourgois, the Veolia Environment Foundation, Region Bretagne, Lorient Agglomeration, World Courier, Illumina, the EDF Foundation, FRB, the Prince Albert II de Monaco Foundation, and the Tara schooner and its captains and crew. Tara Oceans would not exist without continuous support from 23 institutes (oceans.taraexpeditions.org). This work was supported by the French “Agence Nationale de la Recherche” Programs SAMOSA (ANR-13-ADAP-0010) and France Génomique (ANR-10-INBS-09), the French Government “Investissements d'Avenir” Program OCEANOMICS (ANR-11-BTBR-0008), UK Natural Environment Research Council Grants NE/I00985X/1 and NE/J02273X/1, and the European Union’s Seventh Framework Programs FP7 MicroB3 (Grant 287589) and MaCuMBA (Grant 311975). This article is contribution number 41 of Tara Oceans.
Footnotes
The authors declare no conflict of interest.
This article is a PNAS Direct Submission.
Data deposition: The sequences reported in this paper have been deposited in the GenBank database (accession nos. KU377785-990, KU670814-6, KU705397-460, and KU937818-30).
This article contains supporting information online at www.pnas.org/lookup/suppl/doi:10.1073/pnas.1524865113/-/DCSupplemental.
References
- 1.Flombaum P, et al. Present and future global distributions of the marine Cyanobacteria Prochlorococcus and Synechococcus. Proc Natl Acad Sci USA. 2013;110(24):9824–9829. doi: 10.1073/pnas.1307701110. [DOI] [PMC free article] [PubMed] [Google Scholar]
- 2.Partensky F, Hess WR, Vaulot D. Prochlorococcus, a marine photosynthetic prokaryote of global significance. Microbiol Mol Biol Rev. 1999;63(1):106–127. doi: 10.1128/mmbr.63.1.106-127.1999. [DOI] [PMC free article] [PubMed] [Google Scholar]
- 3.Dutkiewicz S, et al. Impact of ocean acidification on the structure of future phytoplankton communities. Nat Clim Chang. 2015;5:10002–11009. [Google Scholar]
- 4.Coleman ML, Chisholm SW. Code and context: Prochlorococcus as a model for cross-scale biology. Trends Microbiol. 2007;15(9):398–407. doi: 10.1016/j.tim.2007.07.001. [DOI] [PubMed] [Google Scholar]
- 5.Johnson ZI, et al. Niche partitioning among Prochlorococcus ecotypes along ocean-scale environmental gradients. Science. 2006;311(5768):1737–1740. doi: 10.1126/science.1118052. [DOI] [PubMed] [Google Scholar]
- 6.Moore LR, Rocap G, Chisholm SW. Physiology and molecular phylogeny of coexisting Prochlorococcus ecotypes. Nature. 1998;393(6684):464–467. doi: 10.1038/30965. [DOI] [PubMed] [Google Scholar]
- 7.Chandler JW, et al. Variable but persistent coexistence of Prochlorococcus ecotypes along temperature gradients in the ocean’s surface mixed layer. Environ Microbiol Rep. 2016;8(2):272–284. doi: 10.1111/1758-2229.12378. [DOI] [PubMed] [Google Scholar]
- 8.Zinser ER, et al. Influence of light and temperature on Prochlorococcus ecotype distributions in the Atlantic Ocean. Limnol Oceanogr. 2007;52(5):2205–2220. [Google Scholar]
- 9.Mackey KR, et al. Effect of temperature on photosynthesis and growth in marine Synechococcus spp. Plant Physiol. 2013;163(2):815–829. doi: 10.1104/pp.113.221937. [DOI] [PMC free article] [PubMed] [Google Scholar]
- 10.Pittera J, et al. Connecting thermal physiology and latitudinal niche partitioning in marine Synechococcus. ISME J. 2014;8(6):1221–1236. doi: 10.1038/ismej.2013.228. [DOI] [PMC free article] [PubMed] [Google Scholar]
- 11.Huang S, et al. Novel lineages of Prochlorococcus and Synechococcus in the global oceans. ISME J. 2012;6(2):285–297. doi: 10.1038/ismej.2011.106. [DOI] [PMC free article] [PubMed] [Google Scholar]
- 12.Mazard S, Ostrowski M, Partensky F, Scanlan DJ. Multi-locus sequence analysis, taxonomic resolution and biogeography of marine Synechococcus. Environ Microbiol. 2012;14(2):372–386. doi: 10.1111/j.1462-2920.2011.02514.x. [DOI] [PubMed] [Google Scholar]
- 13.Zwirglmaier K, et al. Global phylogeography of marine Synechococcus and Prochlorococcus reveals a distinct partitioning of lineages among oceanic biomes. Environ Microbiol. 2008;10(1):147–161. doi: 10.1111/j.1462-2920.2007.01440.x. [DOI] [PubMed] [Google Scholar]
- 14.Rusch DB, et al. The Sorcerer II Global Ocean Sampling expedition: Northwest Atlantic through eastern tropical Pacific. PLoS Biol. 2007;5(3):e77. doi: 10.1371/journal.pbio.0050077. [DOI] [PMC free article] [PubMed] [Google Scholar]
- 15.West NJ, Lebaron P, Strutton PG, Suzuki MT. A novel clade of Prochlorococcus found in high nutrient low chlorophyll waters in the South and Equatorial Pacific Ocean. ISME J. 2011;5(6):933–944. doi: 10.1038/ismej.2010.186. [DOI] [PMC free article] [PubMed] [Google Scholar]
- 16.Ahlgren NA, et al. The unique trace metal and mixed layer conditions of the Costa Rica upwelling dome support a distinct and dense community of Synechococcus. Limnol Oceanogr. 2014;59(6):2166–2218. [Google Scholar]
- 17.Sohm JA, et al. Co-occurring Synechococcus ecotypes occupy four major oceanic regimes defined by temperature, macronutrients and iron. ISME J. 2016;10(2):333–345. doi: 10.1038/ismej.2015.115. [DOI] [PMC free article] [PubMed] [Google Scholar]
- 18.Kettler GC, et al. Patterns and implications of gene gain and loss in the evolution of Prochlorococcus. PLoS Genet. 2007;3(12):e231. doi: 10.1371/journal.pgen.0030231. [DOI] [PMC free article] [PubMed] [Google Scholar]
- 19.Post AF, et al. Long term seasonal dynamics of synechococcus population structure in the gulf of aqaba, northern red sea. Front Microbiol. 2011;2(2):131. doi: 10.3389/fmicb.2011.00131. [DOI] [PMC free article] [PubMed] [Google Scholar]
- 20.Ahlgren NA, Rocap G. Diversity and distribution of marine Synechococcus: Multiple gene phylogenies for consensus classification and development of qPCR assays for sensitive measurement of clades in the ocean. Front Microbiol. 2012;3:213. doi: 10.3389/fmicb.2012.00213. [DOI] [PMC free article] [PubMed] [Google Scholar]
- 21.Biller SJ, Berube PM, Lindell D, Chisholm SW. Prochlorococcus: The structure and function of collective diversity. Nat Rev Microbiol. 2015;13(1):13–27. doi: 10.1038/nrmicro3378. [DOI] [PubMed] [Google Scholar]
- 22.Koeppel AF, et al. Speedy speciation in a bacterial microcosm: New species can arise as frequently as adaptations within a species. ISME J. 2013;7(6):1080–1091. doi: 10.1038/ismej.2013.3. [DOI] [PMC free article] [PubMed] [Google Scholar]
- 23.Kashtan N, et al. Single-cell genomics reveals hundreds of coexisting subpopulations in wild Prochlorococcus. Science. 2014;344(6182):416–420. doi: 10.1126/science.1248575. [DOI] [PubMed] [Google Scholar]
- 24.Armbrust EV, Palumbi SR. Marine biology. Uncovering hidden worlds of ocean biodiversity. Science. 2015;348(6237):865–867. doi: 10.1126/science.aaa7378. [DOI] [PubMed] [Google Scholar]
- 25.Karsenti E, et al. Tara Oceans Consortium A holistic approach to marine eco-systems biology. PLoS Biol. 2011;9(10):e1001177. doi: 10.1371/journal.pbio.1001177. [DOI] [PMC free article] [PubMed] [Google Scholar]
- 26.Logares R, et al. Metagenomic 16S rDNA Illumina tags are a powerful alternative to amplicon sequencing to explore diversity and structure of microbial communities. Environ Microbiol. 2014;16(9):2659–2671. doi: 10.1111/1462-2920.12250. [DOI] [PubMed] [Google Scholar]
- 27.Sunagawa S, et al. Tara Oceans coordinators Ocean plankton. Structure and function of the global ocean microbiome. Science. 2015;348(6237):1261359. doi: 10.1126/science.1261359. [DOI] [PubMed] [Google Scholar]
- 28.Bouman HA, et al. Oceanographic basis of the global surface distribution of Prochlorococcus ecotypes. Science. 2006;312(5775):918–921. doi: 10.1126/science.1122692. [DOI] [PubMed] [Google Scholar]
- 29.Malmstrom RR, et al. Temporal dynamics of Prochlorococcus ecotypes in the Atlantic and Pacific oceans. ISME J. 2010;4(10):1252–1264. doi: 10.1038/ismej.2010.60. [DOI] [PubMed] [Google Scholar]
- 30.Partensky F, Garczarek L. Prochlorococcus: Advantages and limits of minimalism. Annu Rev Mar Sci. 2010;2:305–331. doi: 10.1146/annurev-marine-120308-081034. [DOI] [PubMed] [Google Scholar]
- 31.Rusch DB, Martiny AC, Dupont CL, Halpern AL, Venter JC. Characterization of Prochlorococcus clades from iron-depleted oceanic regions. Proc Natl Acad Sci USA. 2010;107(37):16184–16189. doi: 10.1073/pnas.1009513107. [DOI] [PMC free article] [PubMed] [Google Scholar]
- 32.Malmstrom RR, et al. Ecology of uncultured Prochlorococcus clades revealed through single-cell genomics and biogeographic analysis. ISME J. 2013;7(1):184–198. doi: 10.1038/ismej.2012.89. [DOI] [PMC free article] [PubMed] [Google Scholar]
- 33.Song Q, Gordon AL, Visbeck M. Spreading of the Indonesian throughflow in the Indian Ocean. J Phys Oceanogr. 2004;34(4):772–792. [Google Scholar]
- 34.Moutin T, et al. Does competition for nanomolar phosphate supply explain the predominance of the cyanobacterium Synechococcus? Limnol Oceanogr. 2002;47(5):1562–1567. [Google Scholar]
- 35.Popendorf KJ, Duhamel S. Variable phosphorus uptake rates and allocation across microbial groups in the oligotrophic Gulf of Mexico. Environ Microbiol. 2015;17(10):3992–4006. doi: 10.1111/1462-2920.12932. [DOI] [PubMed] [Google Scholar]
- 36.Paytan A, et al. Toxicity of atmospheric aerosols on marine phytoplankton. Proc Natl Acad Sci USA. 2009;106(12):4601–4605. doi: 10.1073/pnas.0811486106. [DOI] [PMC free article] [PubMed] [Google Scholar]
- 37.Mella-Flores D, et al. Is the distribution of Prochlorococcus and Synechococcus ecotypes in the Mediterranean Sea affected by global warming? Biogeosciences. 2011;8:2785–2804. [Google Scholar]
- 38.Fuller NJ, et al. Dynamics of community structure and phosphate status of picocyanobacterial populations in the Gulf of Aqaba, Red Sea. Limnol Oceanogr. 2005;50(1):363–375. [Google Scholar]
- 39.Dufresne A, et al. Unraveling the genomic mosaic of a ubiquitous genus of marine cyanobacteria. Genome Biol. 2008;9(5):R90. doi: 10.1186/gb-2008-9-5-r90. [DOI] [PMC free article] [PubMed] [Google Scholar]
- 40.Saito MA, Rocap G, Moffett JW. Production of cobalt binding ligands in a Synechococcus feature at the Costa Rica upwelling dome. Limnol Oceanogr. 2005;50(1):279–290. [Google Scholar]
- 41.Gutierrez-Rodrıguez A, et al. Fine spatial structure of genetically distinct picocyanobacterial populations across environmental gradients in the Costa Rica Dome. Limnol Oceanogr. 2014;59(3):705–723. [Google Scholar]
- 42.Villar E, et al. Tara Oceans Coordinators Ocean plankton. Environmental characteristics of Agulhas rings affect interocean plankton transport. Science. 2015;348(6237):1261447. doi: 10.1126/science.1261447. [DOI] [PubMed] [Google Scholar]
- 43.Urbach E, Chisholm SW. Genetic diversity in Prochlorococcus populations flow cytometrically sorted from the Sargasso Sea and Gulf Stream. Limnol Oceanogr. 1998;43(7):1615–1630. [Google Scholar]
- 44.Fuller NJ, et al. Clade-specific 16S ribosomal DNA oligonucleotides reveal the predominance of a single marine Synechococcus clade throughout a stratified water column in the Red Sea. Appl Environ Microbiol. 2003;69(5):2430–2443. doi: 10.1128/AEM.69.5.2430-2443.2003. [DOI] [PMC free article] [PubMed] [Google Scholar]
- 45.Martiny JB, Jones SE, Lennon JT, Martiny AC. Microbiomes in light of traits: A phylogenetic perspective. Science. 2015;350(6261):aac9323. doi: 10.1126/science.aac9323. [DOI] [PubMed] [Google Scholar]
- 46.Martiny AC, Huang Y, Li W. Occurrence of phosphate acquisition genes in Prochlorococcus cells from different ocean regions. Environ Microbiol. 2009;11(6):1340–1347. doi: 10.1111/j.1462-2920.2009.01860.x. [DOI] [PubMed] [Google Scholar]
- 47.Martiny AC, Kathuria S, Berube PM. Widespread metabolic potential for nitrite and nitrate assimilation among Prochlorococcus ecotypes. Proc Natl Acad Sci USA. 2009;106(26):10787–10792. doi: 10.1073/pnas.0902532106. [DOI] [PMC free article] [PubMed] [Google Scholar]
- 48.Larkin AA, et al. Niche partitioning and biogeography of high light adapted Prochlorococcus across taxonomic ranks in the North Pacific. ISME J. 2016 doi: 10.1038/ismej.2015.244. [DOI] [PMC free article] [PubMed] [Google Scholar]
- 49.Palenik B, et al. The genome of a motile marine Synechococcus. Nature. 2003;424(6952):1037–1042. doi: 10.1038/nature01943. [DOI] [PubMed] [Google Scholar]
- 50.Scanlan DJ, et al. Ecological genomics of marine picocyanobacteria. Microbiol Mol Biol Rev. 2009;73(2):249–299. doi: 10.1128/MMBR.00035-08. [DOI] [PMC free article] [PubMed] [Google Scholar]
- 51.Dufresne A, Garczarek L, Partensky F. Accelerated evolution associated with genome reduction in a free-living prokaryote. Genome Biol. 2005;6(2):R14. doi: 10.1186/gb-2005-6-2-r14. [DOI] [PMC free article] [PubMed] [Google Scholar]
- 52.Biastoch A, Böning CW, Lutjeharms JR. Agulhas leakage dynamics affects decadal variability in Atlantic overturning circulation. Nature. 2008;456(7221):489–492. doi: 10.1038/nature07426. [DOI] [PubMed] [Google Scholar]
- 53.Somerfield PJ, Clarke KR. Inverse analysis in non-parametric multivariate analyses: Distinguishing of groups of associated species which covary coherently across samples. J Exp Mar Biol Ecol. 2013;449:261–273. [Google Scholar]
- 54.Malviya S, et al. Insights into global diatom distribution and diversity in the world’s ocean. Proc Natl Acad Sci USA. 2016;113(11):E1516–E1525. doi: 10.1073/pnas.1509523113. [DOI] [PMC free article] [PubMed] [Google Scholar]
- 55.Magoč T, Salzberg SL. FLASH: Fast length adjustment of short reads to improve genome assemblies. Bioinformatics. 2011;27(21):2957–2963. doi: 10.1093/bioinformatics/btr507. [DOI] [PMC free article] [PubMed] [Google Scholar]
- 56.Behrenfeld MJ, et al. Satellite-detected fluorescence reveals global physiology of ocean phytoplankton. Biogeosciences. 2009;6(5):779–794. [Google Scholar]
- 57.Katoh K, Standley DM. MAFFT: Iterative refinement and additional methods. Methods Mol Biol. 2014;1079:131–146. doi: 10.1007/978-1-62703-646-7_8. [DOI] [PubMed] [Google Scholar]
- 58.Guindon S, Gascuel O. A simple, fast, and accurate algorithm to estimate large phylogenies by maximum likelihood. Syst Biol. 2003;52(5):696–704. doi: 10.1080/10635150390235520. [DOI] [PubMed] [Google Scholar]
- 59.Darriba D, Taboada GL, Doallo R, Posada D. jModelTest 2: More models, new heuristics and parallel computing. Nat Methods. 2012;9(8):772. doi: 10.1038/nmeth.2109. [DOI] [PMC free article] [PubMed] [Google Scholar]
- 60.Han MV, Zmasek CM. phyloXML: XML for evolutionary biology and comparative genomics. BMC Bioinformatics. 2009;10:356. doi: 10.1186/1471-2105-10-356. [DOI] [PMC free article] [PubMed] [Google Scholar]
- 61.Letunic I, Bork P. Interactive Tree Of Life (iTOL): An online tool for phylogenetic tree display and annotation. Bioinformatics. 2007;23(1):127–128. doi: 10.1093/bioinformatics/btl529. [DOI] [PubMed] [Google Scholar]
- 62.Schloss PD, et al. Introducing mothur: Open-source, platform-independent, community-supported software for describing and comparing microbial communities. Appl Environ Microbiol. 2009;75(23):7537–7541. doi: 10.1128/AEM.01541-09. [DOI] [PMC free article] [PubMed] [Google Scholar]
- 63.Zhao X, Valen E, Parker BJ, Sandelin A. Systematic clustering of transcription start site landscapes. PLoS One. 2011;6(8):e23409. doi: 10.1371/journal.pone.0023409. [DOI] [PMC free article] [PubMed] [Google Scholar]
- 64.Maechler M, Rousseeuw P, Struyf A, Hubert M, Hornik K. 2015. Cluster: Cluster Analysis Basics and Extensions. R package Version 2.0.3. Available at https://cran.r-project.org/web/packages/cluster/. Accessed April 18, 2016.
- 65.Venables WN, Ripley BD. Modern Applied Statistics with S. Springer; New York: 2002. 4th Ed. 495 p. [Google Scholar]
- 66.Biller SJ, et al. Genomes of diverse isolates of the marine cyanobacterium Prochlorococcus. Sci Data. 2014;1:140034. doi: 10.1038/sdata.2014.34. [DOI] [PMC free article] [PubMed] [Google Scholar]
- 67.Choi DH, Noh JH. Phylogenetic diversity of Synechococcus strains isolated from the East China Sea and the East Sea. FEMS Microbiol Ecol. 2009;69(3):439–448. doi: 10.1111/j.1574-6941.2009.00729.x. [DOI] [PubMed] [Google Scholar]
Associated Data
This section collects any data citations, data availability statements, or supplementary materials included in this article.


