Significance
The CDC projects that by the year 2050 one in three adults will be affected by diabetes in the United States alone. A key feature of type 2 diabetes is insulin resistance, which is associated with ectopic lipid deposition in tissues such as the liver. We have discovered a novel regulatory mechanism in the liver linking protein catabolism and ureagenesis to increased lipid oxidation. By increasing urea production, flux through the enzyme argininosuccinate synthetase is enhanced, leading to activation of AMP-activated protein kinase and increased hepatic fat oxidation. These findings may lead to the development of new drugs designed to reduce fat accumulation in the liver and reverse insulin resistance.
Keywords: argininosuccinate synthetase, AMPK, ureagenesis, amino acids, lipid metabolism
Abstract
A key sensor of cellular energy status, AMP-activated protein kinase (AMPK), interacts allosterically with AMP to maintain an active state. When active, AMPK triggers a metabolic switch, decreasing the activity of anabolic pathways and enhancing catabolic processes such as lipid oxidation to restore the energy balance. Unlike oxidative tissues, in which AMP is generated from adenylate kinase during states of high energy demand, the ornithine cycle enzyme argininosuccinate synthetase (ASS) is a principle site of AMP generation in the liver. Here we show that ASS regulates hepatic AMPK, revealing a central role for ureagenesis flux in the regulation of metabolism via AMPK. Treatment of primary rat hepatocytes with amino acids increased gluconeogenesis and ureagenesis and, despite nutrient excess, induced both AMPK and acetyl-CoA carboxylase (ACC) phosphorylation. Antisense oligonucleotide knockdown of hepatic ASS1 expression in vivo decreased liver AMPK activation, phosphorylation of ACC, and plasma β-hydroxybutyrate concentrations. Taken together these studies demonstrate that increased amino acid flux can activate AMPK through increased AMP generated by ASS, thus providing a novel link between protein catabolism, ureagenesis, and hepatic lipid metabolism.
Maintaining appropriate nitrogen balance is crucial to the fitness of an organism. The decision to deaminate amino acids to use their carbon skeleton for oxidative and/or synthetic purposes is tightly regulated. Excessive amino acid catabolism not only generates toxic nitrogenous waste but also could jeopardize the ability to generate or maintain protein levels.
The liver is unique in its capacity to detoxify nitrogenous waste through the energy-requiring synthesis of urea. Accounting for nearly a third of hepatic metabolism, ureagenesis consumes three ATPs per urea produced and has an overall flux comparable to that of gluconeogenesis (1, 2). Importantly, the ligation of citrulline to aspartate via argininosuccinate synthetase (ASS) hydrolyzes one ATP into AMP per turn of the ornithine cycle, making ASS a predominant hepatocellular contributor of AMP. Hence, a metabolic signal generated through the AMP-generating ornithine cycle could be intrinsic to preserving nitrogen balance.
In oxidative tissues such as muscle, AMPK helps balance energy homeostasis by detecting fluctuations in the [AMP]:[ATP] ratio. Phosphorylation of AMPK by upstream kinases such as liver kinase B1 enhance AMPK activity, and AMP binding to an allosteric site stabilizes a conformation that supports phosphorylation and protects AMPK from dephosphorylation (3). The canonical view of AMPK activation is that, following global shifts in energy balance (e.g., excessive energy demand during exercise), adenylate kinase (AK) increases AMP synthesis to salvage ATP from ADP (4). As a consequence, the AMPK-mediated phosphorylation of sterol regulatory element-binding protein 1 (SREBP-1), acetyl-CoA carboxylase 1 (ACC1), and acetyl-CoA carboxylase 2 (ACC2), then switches metabolism from lipogenesis to lipid oxidation (5–8).
We hypothesized that the extremes in energy demand experienced in exercising muscle that would require AK rescue are much less likely in the liver and that there is a greater possibility that other AMP-generating pathways activate hepatic AMPK. In principle, a shift toward lipid oxidation would support gluconeogenesis and ketogenesis during times of high organismal energy demand. Similarly, the liver could activate lipid oxidation following protein-rich meals to support the repackaging of the surfeit of amino acid carbon into glucose for export and storage while at the same time detoxifying ammonia.
In humans, disruptive mutations in the ASS1 gene cause type I citrullinemia, an inborn error in metabolism marked by hyperammonemia (9, 10). Interestingly, ASS deficiency also is associated with reduced AMPK activation and decreased fatty acid oxidation in mice (11) and with fatty liver in humans (12). Here we propose that ASS is an important physiological regulator of hepatic AMPK, effectively coupling lipid oxidation to ornithine cycle activity.
Results
Amino Acids Activate AMPK in Primary Hepatocytes.
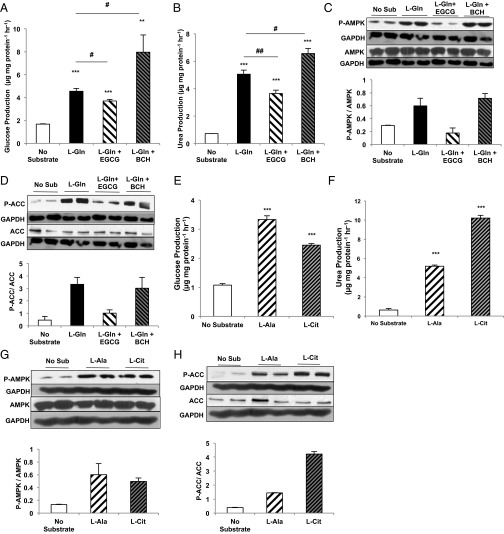
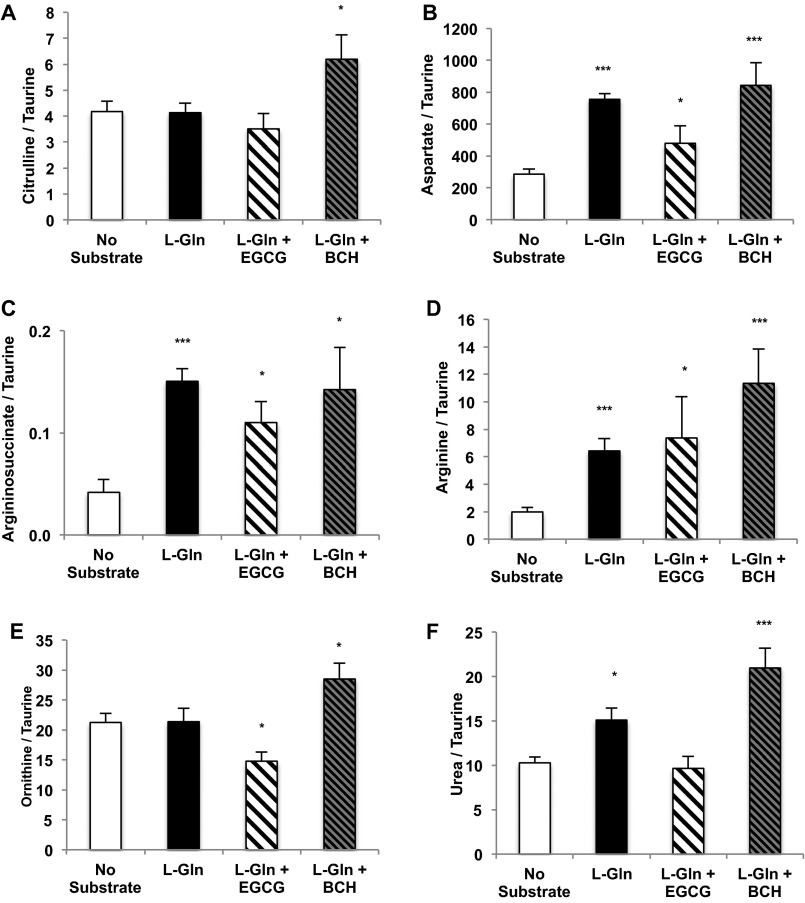
Amino acids stimulate hepatic gluconeogenesis and ureagenesis during both fasting and protein feeding (13). As expected, both glucose and urea production increased following the addition of l-glutamine to primary rat hepatocytes (Fig. 1 A and B). Intriguingly, despite the nutrient excess, AMPK was phosphorylated, and its physiologic activation was confirmed by the phosphorylation of its substrate acetyl-CoA carboxylase (ACC) (Fig. 1 C and D). Inhibition of glutamate dehydrogenase (GDH) activity by epigallocatechin gallate (EGCG) (14) diminished gluconeogenesis and ureagenesis from 10 mM l-glutamine and decreased both AMPK and ACC phosphorylation. Conversely, enhancing GDH-mediated ammonialysis with the nonmetabolizable leucine analog 2-aminobicyclo[2,2,1]heptane-2-carboxylic acid (BCH) (15) augmented both l-glutamine–dependent glucose and urea production and amplified AMPK and ACC phosphorylation. The concentration of ornithine cycle intermediates paralleled the increase in urea production (Fig. S1). Thus, there is a strong positive correlation between l-glutamine metabolism and AMPK activation in primary hepatocytes.
Fig. 1.
Amino acids activate AMPK in rat primary hepatocytes. (A) Primary hepatocytes were isolated from normal, overnight-fasted Sprague–Dawley rats and were treated with either 10 mM l-glutamine (L-Gln) or l-glutamine in the presence of a GDH inhibitor (EGCG) or activator (BCH) to modulate the contribution of l-glutamine to glucose production over 2 h (n = 6, technical replicates). (B) Urea production was measured from primary hepatocytes stimulated with l-glutamine (n = 6, technical replicates). (C, Upper) Western blots show phosphorylated AMPK and total AMPK in lysates from primary hepatocytes treated with l-glutamine in the presence and absence of GDH activation/inhibition. Blots are representative of two independent experiments from two hepatocyte preparations. (Lower) Quantitation of the P-AMPK/total AMPK ratio reflects relative AMPK activation. (D, Upper) Western blots show phosphorylated ACC and total ACC from primary hepatocytes treated with l-glutamine. Blots are representative of two independent experiments from two hepatocyte preparations. (Lower) Quantitation of the relative P-ACC/total ACC ratio reflects relative ACC deactivation by AMPK. (E) Hepatocytes were treated with l-alanine and l-citrulline, and glucose production over 2 h was measured (n = 6 technical replicates). (F) Urea production from l-alanine and l-citrulline was measured over 2 h (n = 6 technical replicates). (G, Upper) Western blots show P-AMPK and total AMPK in lysates from hepatocytes treated with l-alanine or l-citrulline. Blots are representative of three independent experiments from three hepatocyte preparations. (Lower) The ratio was calculated to represent AMPK activation. (H, Upper) Western blots show effect of l-alanine or l-citrulline treatment on P-ACC and total ACC in primary hepatocytes. Blots are representative of three independent experiments from three hepatocyte preparations. (Lower) Quantitation of the relative P-ACC/total ACC ratio reflects relative ACC deactivation by AMPK. When possible, P-ACC and P-AMPK, or total ACC and total AMPK, were probed from the same membrane and therefore have the same corresponding loading control. Error bars represent SEM. Significance by t test: **P < 0.01; ***P < 0.001; for A and B significance by ANOVA against l-Gln: #P < 0.05; ##P < 0.01.
Fig. S1.
l-Glutamine increases ornithine cycle intermediates in rat primary hepatocytes. Primary hepatocytes were isolated from normal, overnight-fasted Sprague–Dawley rats and were treated with 10 mM l-glutamine or with l-glutamine in the presence of a GDH inhibitor or activator to modulate the effect of l-glutamine on the levels of the ureagenesis metabolite and ASS substrate citrulline (A), the transamination product and ASS substrate aspartate (B), the ASS product argininosuccinate (C), arginine (D), ornithine (E), and urea (F) over 2 h (n = 6 technical replicates). Error bars represent SEM. Significance by t test: *P < 0.05; ***P < 0.001.
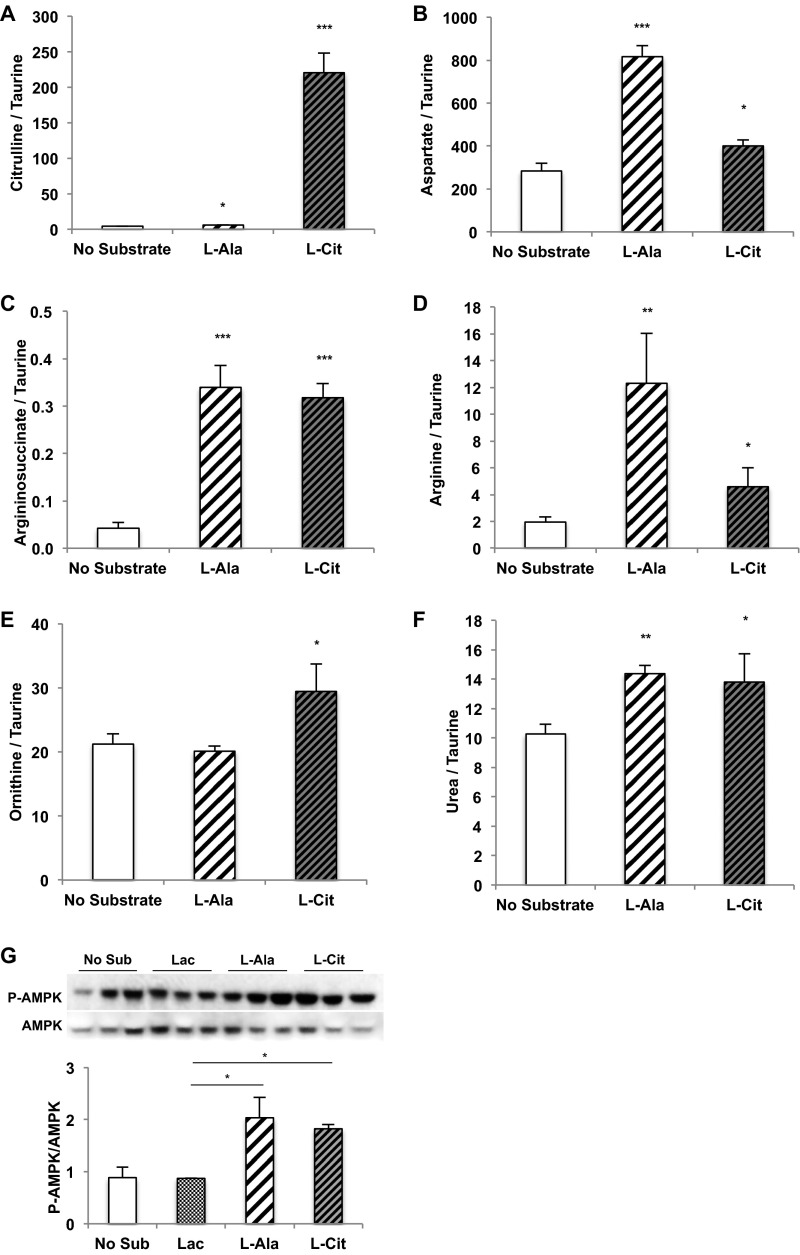
Like glutamate, alanine donates its amino nitrogen via transamination to oxaloacetate to generate aspartate. Not surprisingly, glucose and urea production increased with l-alanine provision, but AMPK activation also followed. l-citrulline, the direct substrate of ASS, displayed nearly similar increases (Fig. 1 E–H). The intracellular metabolic products of alanine and citrulline also were increased, as would be expected (Fig. S2 A–F). Importantly, the gluconeogenic substrate lactate did not increase AMPK activation (Fig. S2G). Thus, glutamine, alanine, and citrulline all share the ability to increase metabolic flux through ASS to generate both argininosuccinate and AMP. As suggested by these data, at the confluence of aspartate and citrulline metabolism there appears to be a functional metabolic sensor that activates hepatic AMPK.
Fig. S2.
l-Alanine and l-citrulline increase ornithine cycle intermediates in rat primary hepatocytes. (A–F) Primary hepatocytes were isolated from normal, overnight-fasted Sprague–Dawley rats and were treated with either 10 mM l-alanine or 10 mM l-citrulline to determine their effect on the levels of ornithine cycle intermediates citrulline (A), aspartate (B), argininosuccinate (C), arginine (D), ornithine (E), and urea (F) over 2 h (n = 6, technical replicates). (G) Treatment of primary rat hepatocytes with 10 mM lactate did not trigger AMPK phosphorylation compared with 10 mM l-alanine and l-citrulline. Error bars represent SEM. Significance by t test: *P < 0.05; **P < 0.01; ***P < 0.001.
ASS Silencing Decreases Ureagenesis and Amino Acid-Mediated AMPK Activation.
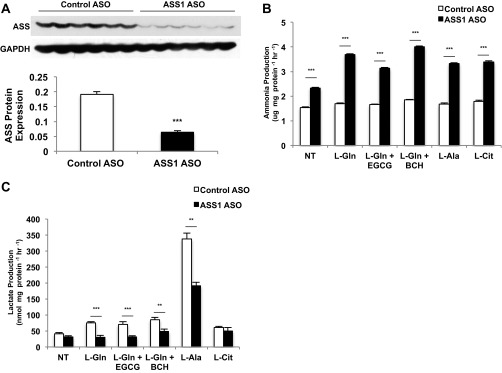
To assess whether AMP generated from ASS is capable of activating AMPK during ureagenesis, an antisense oligonucleotide (ASO) was used to silence expression of the ASS1 gene acutely in vivo (ASSASO) compared with a control ASO (CONASO) (Fig. S3A). Hepatocytes then were isolated and cultured from the different rat livers. ASS-dependent gluconeogenesis and ureagenesis were both blunted significantly from the substrates l-glutamine, l-alanine, and l-citrulline in ASSASO hepatocytes (Fig. 2 A and B). Consistent with the known detoxifying role of ASS, ammonia production was elevated in hepatocytes where ASS was depleted (Fig. S3B). Similarly, lactate production in the presence of amino acids was decreased following ASS knockdown, manifesting decreased deaminative capacity (Fig. S3C).
Fig. S3.
Knockdown of ASS1 expression by ASO alters ammoniagenesis and transamination in rat primary hepatocytes. (A) Primary hepatocytes were isolated from overnight-fasted Sprague–Dawley rats that had been treated with either CONASO or ASSASO for more than 4 wk. Hepatocytes were given either 10 mM l-glutamine or l-glutamine with a GDH inhibitor or activator (10 mM l-alanine, or 10 mM l-citrulline, respectively) substrate. ASO treatment effectively decreased ASS protein levels in hepatocytes (n = 6 technical replicates). (B) Knockdown of ASS1 expression increased ammonia production over 2 h (n = 6 technical replicates). (C) Lactate levels were decreased over 2 h (n = 6 technical replicates). Error bars represent SEM. Significance by t test: **P < 0.01; ***P < 0.001.
Fig. 2.
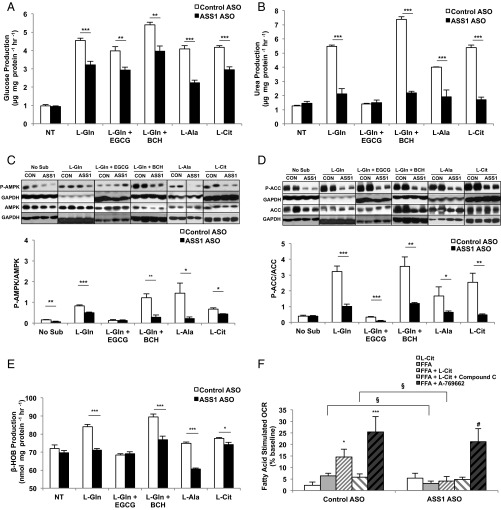
Knockdown of ASS1 inhibits activation of AMPK by amino acids in rat primary hepatocytes. (A) Primary hepatocytes were isolated from Sprague–Dawley rats treated with either CONASO or ASSASO for knockdown. ASSASO and CONASO hepatocytes were stimulated with 10 mM substrate (l-glutamine or l-glutamine in the presence of a GDH inhibitor or activator, l-alanine and l-citrulline, respectively). Glucose production was measured over 2 h (n = 6 technical replicates). (B) Ureagenesis from control and ASSASO hepatocytes was measured using various amino acid substrates (n = 6 technical replicates). (C) AMPK activation was determined by assessing the relative phosphorylation of AMPK as a ratio of total AMPK as determined by Western blotting (n = 6 technical replicates). (D) Inactivation of the downstream AMPK target ACC was measured as a ratio of P-ACC to total ACC as evaluated by Western blotting (n = 6 technical replicates). When possible, P-ACC and P-AMPK, or total ACC and total AMPK, were probed from the same membrane and therefore have the same corresponding loading control. (E) Ketogenesis was assessed indirectly by measuring β-hydroxybutyrate production upon stimulation by amino acids for 2 h (n = 6 technical replicates). (F) The effect of ASS1 knockdown by ASO on fatty acid oxidation was determined by measuring fatty acid-stimulated oxygen consumption in both CONASO and ASSASO primary rat hepatocytes (n = 6 technical replicates; data are representative of three separate experiments done with separate hepatocyte preparations). Error bars represent SEM. Significance by t test: *P < 0.05; **P < 0.01; ***P < 0.001; for F. significance by t test within the ASSASO group: #P < 0.05 and §P < 0.05 between control and ASSASO groups.
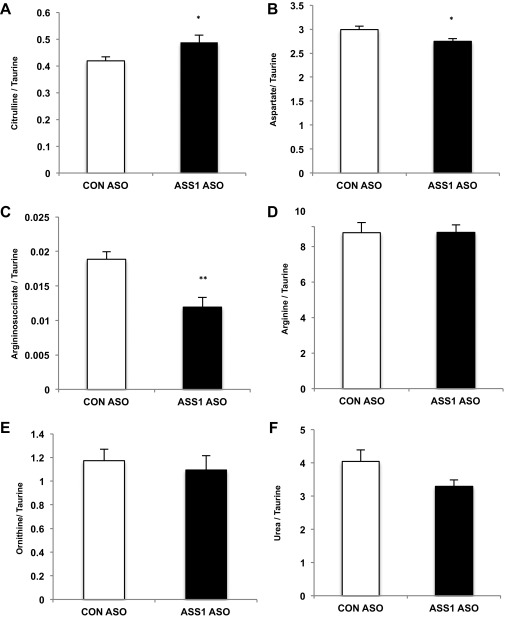
ASSASO hepatocytes also exhibited a distinct ornithine cycle metabolite pattern compared with CONASO hepatocytes. Metabolic crossover occurred at the ASS step with the substrate citrulline increased and the product argininosuccinate diminished (Fig. S4). Such an altered metabolite pattern is consistent with the citrullinemia of clinical ASS deficiency (16, 17). l-glutamine, l-alanine, and l-citrulline all increased AMPK and ACC phosphorylation in CONASO hepatocytes, but this effect was markedly diminished in hepatocytes from ASSASO rats (Fig. 2 C and D). Supplementation of primary hepatocytes with amino acids also increased the production of β-hydroxybutyrate, reflecting an increase in ketogenesis that was blunted in ASSASO hepatocytes (Fig. 2E). Importantly, the loss of amino acid-stimulated AMPK and ACC phosphorylation was functionally accompanied by decreased fatty acid oxidation in hepatocytes lacking ASS (Fig. 2F). In normal hepatocytes, fatty acid oxidation was enhanced by l-citrulline, and this augmentation was reversed when cells were treated with the AMPK inhibitor compound C. Furthermore, both CONASO and ASSASO hepatocytes responded to the AMPK activator A-769662, indicating that the inhibitory effect of ASS knockdown on fatty acid-stimulated oxygen consumption is not caused by a nonspecific effect on fatty acid metabolism or the AMPK pathway but is specifically a result of ASS-regulated AMPK. Thus, ASS is essential for amino acid-triggered AMPK activation, and the absence of ASS is functionally associated with decreased fatty acid oxidation.
Fig. S4.
l-Glutamine increases ornithine cycle intermediates in rat primary hepatocytes. Primary hepatocytes were isolated from overnight-fasted Sprague–Dawley rats that had been treated for more than 4 wk with CONASO or ASSASO. ASS1 knockdown increased levels of the ASS substrate citrulline (A), decreased aspartate (B), decreased the ASS product argininosuccinate (C), did not alter arginine (D) or ornithine (E), and slightly decreased urea (F) over 2 h (n = 6 technical replicates). Error bars represent SEM. Significance by t test: *P < 0.05; **P < 0.01.
ASS Modulates AMPK in Vivo.
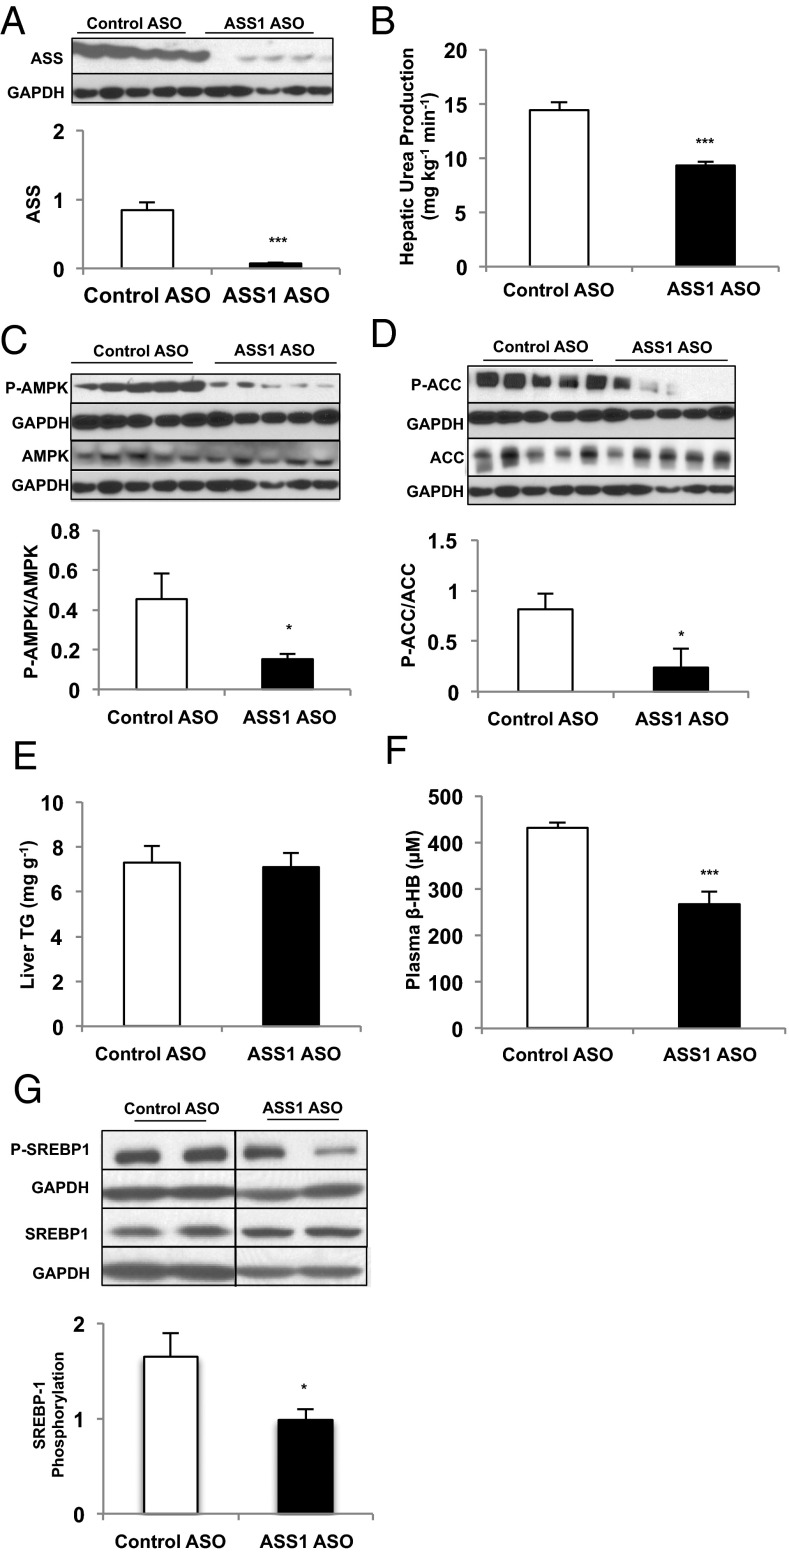
To determine the physiologic relevance of ASS-activated AMPK, we assessed ASSASO rats in vivo. Both hepatic ASS protein and urea turnover were decreased by ASSASO treatment in healthy adult Sprague–Dawley rats, as is consistent with a physiologically relevant reduction in ASS (Fig. 3 A and B). A consequence of ASS reduction was diminished hepatic AMPK and ACC phosphorylation (Fig. 3 C and D) that not only confirms the in vitro observations but also supports a physiologically relevant association between hepatic ASS and AMPK. Of note, there were no differences in hepatic triglyceride content on a regular chow diet (Fig. 3E); nonetheless, ASSASO treatment significantly decreased plasma β-hydroxybutyrate concentrations (Fig. 3F). Furthermore, phosphorylation of the key lipogenic transcription factor SREBP-1c was decreased in ASSASO rat livers (Fig. 3G), suggesting decreased hepatic AMPK activity and decreased inhibition of lipogenesis (5). These data suggest that ASS deficiency in vivo promotes lipogenesis by protecting SREBP-1 from inhibition by AMPK and limits AMPK-mediated activation of mitochondrial lipid oxidation via reduced ACC phosphorylation, as reflected by lowered fasting plasma ketone concentrations.
Fig. 3.
Knockdown of liver ASS protein expression inhibits ureagenesis and hepatic AMPK activity in vivo. (A) ASSASO achieved significant knockdown of ASS protein expression in the liver compared with CONASO (n = 6 biological replicates). (B) Ureagenesis was measured in rats treated with either ASSASO or CONASO (n = 6 biological replicates). (C) Liver AMPK activation was assessed by taking the ratio of P-AMPK to total AMPK as measured by Western blot (n = 5 biological replicates). (D) Liver ACC phosphorylation was determined as a ratio of total ACC via Western blot (n = 5 biological replicates). When possible, P-ACC and P-AMPK, or total ACC and total AMPK, were probed from the same membrane and therefore have the same corresponding loading control. (E) Liver triglyceride content was measured in livers isolated from rats treated with either CONASO or ASSASO (n = 6 biological replicates). (F) Plasma β-hydroxybutyrate concentration was measured to assess indirectly the effect of ASSASO treatment on ketogenesis in vivo (n = 6 biological replicates). (G) Liver SREBP-1 phosphorylation was assessed by Western blot and normalized to total SREBP-1 (n = 7 CONASO and n = 6 ASSASO biological replicates). Error bars represent SEM. Significance by t test: *P < 0.05; ***P < 0.001.
AMPK and ASS Reside in a Functional Physical Complex.
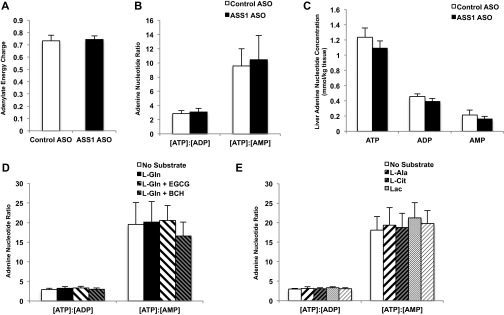
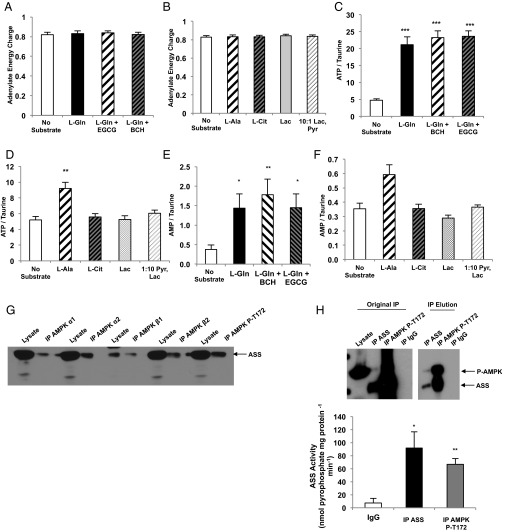
The finding that AMP produced during ureagenesis acutely regulates AMPK activity even in a nutrient-rich environment departs from the classical paradigm of AMPK activation. Thus, a specific ornithine cycle-generated AMP pool may be a pertinent input into the AMPK-controlled metabolism. Knockdown of ASS1 expression by ASO did not affect total basal adenylate energy charge, as determined by Atkinson’s reaction [(ATP) + 1/2 (ADP)]/[(ATP) + (ADP) + (AMP)] (Fig. S5A), and did not significantly alter the [ATP]:[ADP] or [ATP]:[AMP] ratios (Fig. S5B) or fasting [ATP], [ADP], or [AMP] in the liver (Fig. S5C). To determine whether increased flux through ureagenesis in hepatocytes can alter adenine nucleotide levels and energy state, we measured [ATP], [ADP], and [AMP] in primary rat hepatocytes treated with various amino acid substrates (Tables S1 and S2). Adenylate energy charge was not significantly altered by the addition of any substrate (Fig. 4 A and B), nor were the ratios of [ATP]:[ADP] or [ATP]:[AMP] altered (Fig. S5 D and E). However, [ATP] was increased by the addition of amino acids (Fig. 4 C and D). Notably, [AMP] was elevated in hepatocytes given amino acid substrate (Fig. 4 E and F). These data suggest that although amino acids increase [ATP] and do not significantly alter the cellular energy state, they also augment [AMP].
Fig. S5.
Adenine nucleotide concentrations in amino acid-treated rat hepatocytes and in liver tissue from rats treated with CONASO and ASSASO. (A) Livers were rapidly harvested from overnight-fasted Sprague–Dawley rats that had been treated with CONASO or ASSASO for more than 4 wk. Adenylate energy charge, measured as [(ATP) + 1/2 (ADP)]/[(ATP) + (ADP) + (AMP)], was assessed from adenine nucleotide concentrations measured by LC/MS/MS (n = 7 CONASO and n = 8 ASSASO biological replicates). (B) Adenine nucleotide ratios were calculated from individual ATP, ADP, and AMP concentrations in rat liver tissue (n = 7 CONASO and n = 8 ASSASO biological replicates). (C) Individual concentrations of adenine nucleotides (n = 7 CONASO and n = 8 ASSASO biological replicates). (D and E) Adenine nucleotide ratios were calculated from adenine nucleotide concentrations measured by LC/MS/MS in rat hepatocytes treated with l-glutamine and modulators of GDH activity (D) and in hepatocytes treated with l-alanine, l-citrulline, or the gluconeogenic substrates lactate and pyruvate (E) (n = 6 technical replicates). Error bars represent SEM. Significance was determined by t test.
Table S1.
Adenine nucleotide concentrations in rat hepatocytes treated with l-glutamine and modulators of GDH
| Substrate | Adenine nucleotide concentration normalized to taurine | ||
| ATP | ADP | AMP | |
| No substrate | 4.81 ± 0.40 | 1.74 ± 0.19 | 0.38 ± 0.11 |
| l-Gln | 21.16 ± 2.29 | 6.84 ± 0.68 | 1.44 ± 0.37 |
| l-Gln+EGCG | 23.25 ± 2.04 | 7.92 ± 0.60 | 1.78 ± 0.40 |
| l-Gln+BCH | 23.63 ± 1.63 | 7.55 ± 0.86 | 1.45 ± 0.35 |
Individual concentrations of adenine nucleotides were measured by LC/MS/MS and normalized to taurine in rat hepatocytes treated with l-glutamine in the presence or absence of the GDH modulators EGCG and BCH (n = 6 technical replicates).
Table S2.
Adenine nucleotide concentrations in rat hepatocytes treated with amino acids and non-amino acid substrates
| Substrate | Adenine nucleotide concentration normalized to taurine | ||
| ATP | ADP | AMP | |
| No substrate | 5.20 ± 0.46 | 1.79 ± 0.17 | 0.36 ± 0.04 |
| l-Ala | 9.20 ± 0.78 | 2.99 ± 0.17 | 0.59 ± 0.07 |
| l-Cit | 5.58 ± 0.43 | 1.88 ± 0.20 | 0.36 ± 0.03 |
| Lac | 5.26 ± 0.50 | 1.61 ± 0.13 | 0.29 ± 0.02 |
| 10:1 Lac, Pyr | 6.05 ± 0.41 | 1.95 ± 0.09 | 0.37 ± 0.02 |
Individual concentrations of adenine nucleotides were measured by LC/MS/MS and normalized to taurine in rat hepatocytes treated with l-alanine, l-citrulline, or non-amino acid gluconeogenic substrates (n = 6 technical replicates).
Fig. 4.
Amino acid regulation of [AMP] and interaction of ASS with AMPK in rat liver. (A) Adenylate energy charge is calculated by the equation [(ATP) + 1/2 (ADP)]/[(ATP) + (ADP) + (AMP)] from adenine nucleotide concentrations in rat hepatocytes supplemented with l-glutamine and treated with GDH modulators as measured by LC/MS/MS (n = 6 technical replicates). (B) Adenylate energy charge in rat hepatocytes supplemented with l-alanine, l-citrulline, and non-amino acid substrates was calculated from adenine nucleotide measurements made by LC/MS/MS (n = 6 technical replicates). (C) Concentration of ATP in hepatocytes provided with l-glutamine and treated with GDH modulators was measured by LC/MS/MS and normalized to taurine concentration (n = 6 technical replicates). (D) Concentration of ATP in hepatocytes given l-alanine, l-citrulline, and non-amino acid substrates was measured by LC/MS/MS and normalized to taurine concentration (n = 6 technical replicates). (E) AMP concentration in hepatocytes supplemented with l-glutamine and treated with GDH modulators was measured by LC/MS/MS and normalized to taurine concentration (n = 6, technical replicates). (F) AMP concentration was measured by LC/MS/MS and normalized to taurine in hepatocytes treated with l-alanine, l-citrulline, or non-amino acid substrate (n = 6 technical replicates) (G) Immunoprecipitation of various subunits of AMPK, as well as phosphorylated AMPK, from rat liver also coprecipitated ASS protein as determined by Western blot. Data are representative of three independent experiments done with separate liver lysate preparations. (H) ASS enzymatic activity was measured in both ASS and AMPK immunoprecipitates from rat liver lysates. ASS activity was assessed via a coupled reaction to pyrophosphatase and by directly measuring the conversion of pyrophosphate produced by ASS to phosphate (n = 3; data are representative of three independent experiments done with separate liver lysate preparations). Error bars represent SEM. Significance by t test: *P < 0.05; **P < 0.01; ***P < 0.001.
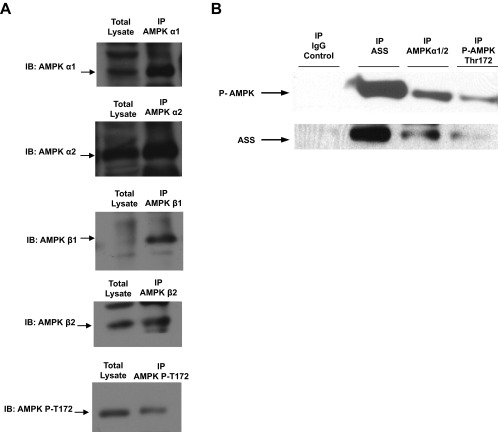
Therefore it is possible that hepatic AMP generated exclusively by ASS can act as a signal to stimulate AMPK activation. A critical question then is whether, in the absence of global shifts in energy charge in the liver, localized increases in [AMP] could be facilitated by a physical interaction between ASS and AMPK. AMPK from rat liver coimmunoprecipitated ASS protein, ASS protein immunoprecipitating with the α1, α2, β1, and β2 AMPK subunits, and T172-phosphorylated AMPK (Fig. 4G and Fig. S6A). Additionally, ASS protein immunoprecipitates also contained T172-phosphorylated AMPK (Fig. S6B). Finally, ASS activity was detected in AMPK immunoprecipitates (Fig. 4H). These data provide strong evidence for the existence of a catalytically active ASS–AMPK complex in the liver and raise the possibility that AMP synthesized by ASS is directly channeled to AMPK to modulate its activity allosterically (Fig. S7).
Fig. S6.
Coimmunoprecipitation of ASS and AMPK subunits. (A) Different subunits of AMPK were immunoprecipitated to determine if ASS protein can be retrieved in a complex with liver AMPK. Western blotting shows initial input lysate and immunoprecipitated AMPK α1, α2, β1, and β2 and T172 phosphorylated AMPK protein, showing that ASS was detected in a complex containing the respective immunoprecipitated AMPK subunits. (B) ASS protein was detected in AMPK α2 as well as in T172 phosphorylated AMPK immunoprecipitates, and T172 phosphorylated AMPK was detected in ASS immunoprecipitate. No ASS or AMPK protein was detected in the IgG control. Data are representative of three independent experiments done with separate liver preparations.
Fig. S7.
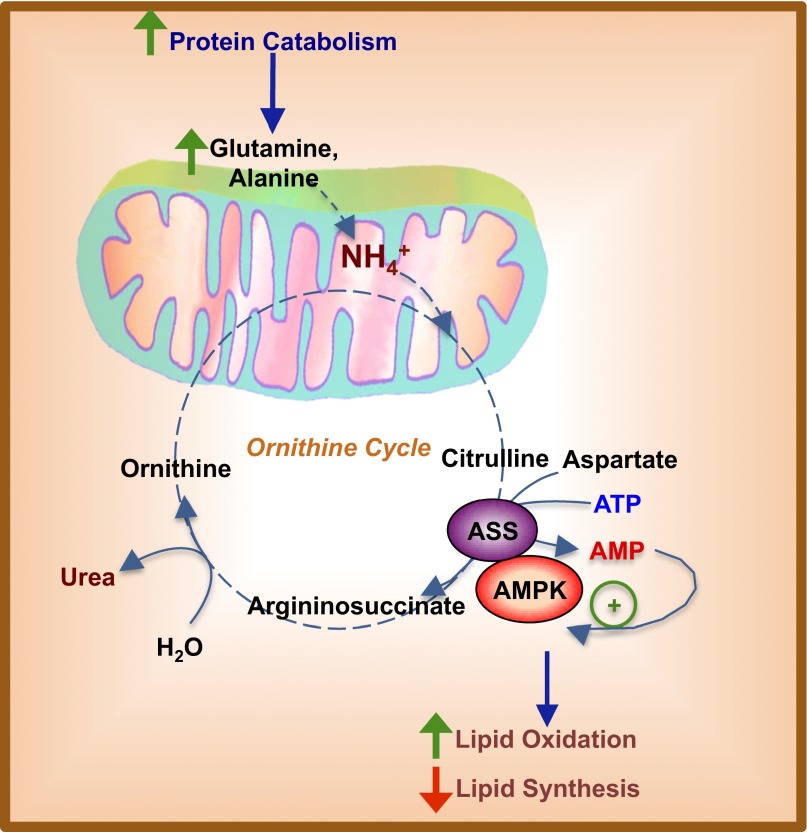
Schematic representation of AMPK regulation via ureagenesis and increased ASS enzyme flux. ASS and AMPK reside in a complex in the cytosol and act as a sensor of energy status sensitive to fluctuations in amino acid catabolism. Increased protein breakdown and influx of amino acids such as l-glutamine and l-alanine would lead to the release of ammonium, which contributes to increased ureagenesis. Citrulline, an intermediate metabolite of the ornithine cycle, is converted along with aspartate to argininosuccinate by the enzyme ASS. This process hydrolyzes one ATP to AMP and pyrophosphate. Being in close physical interaction with AMPK, AMP produced by ASS then can act as a local allosteric signal coupling enhanced ornithine cycling or ureagenesis to AMPK activation. AMPK activation then will lead to increased lipid oxidation and decreased lipogenesis in the hepatocyte, thus increasing ATP production to fuel processes such as gluconeogenesis. Such a mechanism of metabolic regulation would be beneficial in fasting states, in which increased protein catabolism suggests inadequate plasma glucose concentrations.
Discussion
Here, we provide evidence that ASS transduces ornithine cycle flux into a signal that activates AMPK. Consequently, ACC phosphorylation will limit de novo lipogenesis and, by lowering malonyl-CoA, will enhance mitochondrial lipid entry through CPT-1 (18, 19). Although the details of the ASS–AMPK connection in the broad physiological context remain to be determined, the utility of such a mechanism is compelling. In the protein-fed state, amino acid excess is allosterically “sensed” by this cytosolic metabolic circuit. Subsequent AMPK phosphorylation then could increase lipid oxidation and concomitantly redirect anaplerotic carbons away from oxidative pathways and into synthetic cataplerotic pathways such as gluconeogenesis. During fasting, activation of β-oxidation by such a circuit not only would spare amino acid oxidation but also would decrease gluconeogenic demand by activating ketogenesis. Regardless the role, hepatic AMPK activation by ASS can be clearly separated from a nutrient-limited state that appears to be its primary mechanism of activation in oxidative tissues.
Nitrogen balance also is allosterically regulated at the level of the mitochondria where three enzymes direct the flow of nitrogen into urea depending on the energetic state in the matrix. Glutaminase (GLS2) generates ammonia and glutamate from glutamine in a manner dependent upon phosphate, ADP, and ammonia concentrations (20). Transamination of α-ketoglutarate is the route taken by the majority of amino acid nitrogen to reach glutamate (21). Glutamate then can be oxidatively deaminated by GDH to generate free ammonia and to regenerate α-ketoglutarate. GDH activity is highly controlled by allosteric regulation; mitochondrial GTP (mtGTP) inhibits GDH, whereas l-leucine activates GDH (22, 23). mtGTP is an important mitochondrial energy sensor in both hepatocytes and pancreatic islet cells, reflecting the balance between tricarboxylic acid cycle and gluconeogenic fluxes implicated in glucose production, insulin secretion, and glucagon secretion (2, 24–26). In contrast, as an essential amino acid, l-leucine reflects high nutrient protein levels and can activate GDH even when mitochondrial energy is high. A third level of allosteric regulation of urea production occurs with carbamoyl phosphate synthase 1 (CPS1), which initiates the entry of free ammonia into the ornithine cycle via synthesis of carbamoyl phosphate. CPS1 is allosterically activated by N-acetylglutamate, a mitochondrial coincidence detector of lipid and amino acid abundance. Integration of all these allosteric signals acutely shapes the flow of amino acids into metabolic pathways within the mitochondria.
We propose the existence of similar control points managing nitrogen balance in the cytosol that are orchestrated via collaboration between AMPK and ASS. Activation of the AMPK switch that controls ACC during times of increased ureagenesis would enhance the delivery of fatty acids to the mitochondria for oxidation, reserving carbohydrate and amino acid metabolites for gluconeogenesis. During fasting or caloric restriction, the ASS–AMPK complex may activate a similar protein-sparing switch. Indeed, knockdown of hepatic ASS expression led to decreased plasma β-hydroxybutyrate concentrations, suggesting that ASS activity is also important for maintaining ketogenesis.
In summary, we show that hepatic AMPK is modulated via a direct interaction with ASS that links ureagenesis with lipid oxidation. These findings reveal a mechanism by which substrate flux alters cellular signaling pathways to adapt rapidly to nutrient availability. Activation of AMPK is classically considered to result from extreme metabolic conditions. Here we show that even under normal in vivo conditions of altered amino acid flux, AMP generated by ASS can activate AMPK, thus providing a novel link between protein catabolism and ureagenesis to hepatic lipid metabolism.
Methods
Hepatocyte Studies.
Primary hepatocytes were freshly prepared by the Yale University Liver Center from livers of hepatic glycogen-deplete, 24-h–fasted Sprague–Dawley rats by collagenase digestion. Isolated hepatocytes were suspended and washed two times in recovery medium [DMEM high glucose (Sigma, D5648) with 10% (vol/vol) FBS, 1 nM insulin, 100 nM dexamethasone, 10,000 U/mL penicillin, 10 mg/mL streptomycin, 10 mM Hepes, and 3.7 mg/mL NaHCO3]. Cell count and viability were estimated by Trypan blue exclusion. Cells were plated at 3 × 10⁵ cells per well in recovery medium in collagen-coated six-well plates and were cultured overnight under 5% CO2 and 95% O2 at 37 °C. Cells then were preincubated for 2 h in DMEM containing no glucose, 10 mM Hepes, and 3.7 mg/mL sodium bicarbonate. This preincubation was followed by a 2-h incubation in no-glucose DMEM supplemented with 10 mM substrate (all substrates were obtained from Sigma). The GDH inhibitor EGCG was added at 20 μM, and the GDH activator BCH was added at 10 mM. For all hepatocyte studies comparing CONASO with ASSASO knockdown, hepatocytes were isolated from animals treated with the respective ASO using the protocol used for all the in vivo studies (please see Animal Studies below for the ASO treatment methods).
Metabolite Measurement.
Glucose in the medium from hepatocyte studies was measured using Genzyme Glucose-SL reagent, and glucose production was normalized to total protein levels as measured by Bradford assay. Urea production from hepatocytes was assessed by measuring urea in the medium by an enzymatic reaction coupling urease production of ammonia from urea to GDH and observing changes in NADH oxidation at 340 nm absorbance [buffer composition: 30 mM potassium phosphate (pH 7.6), 2.875 mM ADP, 0.9 mM NADH, 3.25 mM α-ketoglutarate; 12.5 U GDH, 1 U urease in a total reaction volume of 200 μL, 10 min incubation at room temperature] (27). Urea produced was normalized to total protein. Ureagenesis in 24-h–fasted rats was measured by an i.v. single dose prime, 14.89 mg/kg of [15N2]-urea, followed by continuous infusion of [15N2]-urea at 0.025 mg⋅kg−1⋅min−1 over 2 h. Plasma collected from infused rats was deproteinized using one volume of ZnSO4 and Ba(OH)2, dried down in a speed-vacuum, and derivatized by adding one volume of acetic anhydride and pyridine and incubation at 65 °C for 15 min. Derivatized samples were added to 75 μL of methanol, and 2H enrichment was measured via GC/MS as previously described (28). Production of β-hydroxybutyrate from hepatocytes and in rat plasma was measured using the Ketone Body Assay (Sigma Aldrich catalog no. MAK134). Liver triglycerides were measured using Genzyme Triglyceride-SL reagent. Hepatocyte urea cycle intermediates were measured from cell extracts. Cells were washed with 1× PBS after treatment and were lysed on dry ice by adding 250 μL extraction buffer [20% (vol/vol) methanol, 0.1% formic acid, 1 mM phenylalanine, 3 mM NaF, 100 μM EDTA] to each well of a six-well plate and scraping cells for collection. Cell extracts were snap frozen in liquid nitrogen and then were thawed and centrifuged to remove debris. Supernatants were analyzed by LC/MS/MS, and metabolite levels were normalized to taurine. Ammonia production from hepatocytes was measured via enzymatic reaction of GDH in medium samples and following the change in NADH absorbance at 340 nm [buffer composition: 30 mM potassium phosphate (pH 7.6), 2.875 mM ADP, 0.9 mM NADH, 3.25 mM α-ketoglutarate, 12.5 U GDH in a total reaction volume of 200 μL, 10 min incubation at room temperature]. Lactate production by hepatocytes was measured in medium samples via enzymatic reaction of lactate dehydrogenase (LDH) and following the change in NADH absorbance at 340 nm [buffer composition: 320 mM glycine, 320 mM hydrazine, 2.4 mM NAD+, 10 U/mL LDH in a final reaction volume of 150 μL, 10 min incubation at 37 °C] (29). All endpoint absorbance measurements were made using the FlexStation 3 Benchtop Multi-Mode Microplate Reader (Molecular Devices).
Adenine Nucleotide Measurement.
Primary rat hepatocytes were isolated and plated in recovery medium as described. After 4 h, cells were washed with PBS; the medium was changed to DMEM low glucose (5 mM; Sigma, D5921) supplemented with antibiotics, 1 nM insulin, and 100 nM dexamethasone, and cells were cultured overnight. Hepatocytes were incubated for 2 h in the presence of 10 mM substrate in DMEM supplemented only with 100 nM dexamethasone and 0.2% BSA. At the end of the incubation period, hepatocytes were quenched by rapid washing with ice-cold PBS and were collected in 100 μL of extraction buffer [50% (vol/vol) acetonitrile, 100 μM EDTA, and 10 mM spermine] (24). Samples were centrifuged at 4 °C before LC-MS/MS analysis of nucleotide content. Samples were injected onto a C18 column (5-μm particle size, 4.6 mm × 25 cm; Vydac) at a flow rate of 1 mL/min. A binary solvent system, consisting of 15 mM ammonium formate (A) and 60% (vol/vol) acetonitrile, 35% (vol/vol) isopropyl alcohol, and 15 mM ammonium formate (B), was used to achieve chromatographic separation between AMP, ADP, and ATP. The following gradient was used: 90% (vol/vol) B between 0 and 0.5 min, linear decline to 10% (vol/vol) B between 0.5 and 2 min, 10% (vol/vol) B between 2 and 5 min, linear increase to 90% (vol/vol) B between 5 and 5.5 min, 90% (vol/vol) B between 5.5 and 6 min. Samples were ionized by electrospray into an ABSCIEX 5500 QTRAP equipped with a SelexION device for differential mobility separation (DMS) and were acquired using multiple reaction monitoring (MRM) in negative mode. The source parameters were CUR (curtain): 30, CAD (collision activated dissociation): high, IS (ionization voltage): –1,500, TEM (ion source temperature): 625, GS1 (gas source 1): 50, and GS2 (gas source 2): 55. DMS parameters were temperature (DT): low, MD (modifier): 2-propanol, MDC (modifier composition): low, DMO (DMS offset): 3 and DR (DMS resolution enhancement): off. Separation voltage and compensation voltage were optimized for maximum signal intensities. Retention times were confirmed with known standards and peaks integrated using MultiQuant (AB SCIEX) using the following MRM transition pairs (Q1/Q3): 506/159 for ATP, 426/79 for ADP, and 346/79 for AMP.
Animal Studies.
Male Sprague–Dawley rats were acquired from Charles River Laboratories and were administered regular chow and water ad libitum. Rats were housed individually on a 12:12-h light/dark cycle. Arterial lines were surgically implanted into the carotid artery, and venous lines were implanted into the jugular vein of rats for the studies. All animal studies included 6–10 rats per group, aged 9–12 wk and weighing 300–450 g at the time of study. Animals were randomly allocated to treatment groups before the collection of any data (e.g., weight) or surgical procedures, and the studies were performed unblinded. Sample sizes were selected to detect moderate to large (>20%) differences. All studies were performed in awake, unrestrained animals. Rats were fasted for 24 h before studies were conducted. Rats were anesthetized by i.v. pentobarbital. ASO treatment was administered at a dosing schedule of 37.5 mg/kg twice weekly for 4 wk by i.p. injection. ASOs used in vivo were selected from a pool of ∼80 ASOs that were prescreened in vitro for target efficacy. The most active compounds were screened further in vivo to select the ASO used in this study. The ASO identification numbers and sequences are as follows: control ASO used in all studies: 5′-CCTTCCCTGAAGGTTCCTCC-3′ (ID: ISIS 141923) and ASS1 ASO: 5′-CCACTTTTGTAGGCTATACC-3′ (ID: ISIS 470628). ASOs used for i.p. injections were resuspended in sterile 0.9% saline at concentrations of 6.271 mM (CONASO) and 6.206 mM (ASSASO).
All studies involving animals were conducted with prior approval from the Yale University Institutional Animal Care and Use Committee (IACUC) in compliance with the ethical standards outlined by the IACUC.
Western Blotting.
Liver lysates were made by pulverizing freeze-clamped liver tissue and homogenizing in lysis buffer [50 mM Tris⋅HCl (pH 7.4), 1 mM EGTA, 150 mM NaCl, 5 mM MgCl2, 1% Nonidet P-40 with cOmplete protease inhibitor tablet (Roche) per 50 mL buffer]. Hepatocyte lysates were made by adding 500 μL of lysis buffer directly to the wells of six-well plates. SDS samples were prepared by adding 2× SDS sample buffer [20% (vol/vol) glycerol, 120 mM Tris⋅HCl (pH 6.8), 4% (wt/vol) SDS, 0.02% bromophenol blue, 4% (vol/vol) β-mercaptoethanol] to one volume of lysate and boiling at 95 °C for 5 min. Samples were run on Novex 4–12% Tris-Glycine gels (Invitrogen), and gels were transferred to PVDF membranes by semidry transfer. Antibodies used to determine protein expression were ASS1 antibody (C-19) (Santa Cruz catalog no. sc-46064), Phospho-AMPKα Thr172 40H9 (Cell Signaling catalog no. 2535), AMPKα (Cell Signaling catalog no. 2532), Phospho-acetyl-CoA carboxylase (Ser79) (D7D11) rabbit mAb (Cell Signaling catalog no. 11818), Acetyl-CoA carboxylase antibody (Cell Signaling catalog no. 3662), SREBP-1 (Abcam catalog no. ab3259), phospho-SREBP-1 (Cell Signaling catalog no. 9874), and GAPDH D16H11 XP (Cell Signaling catalog no. 5174). Blotting for total AMPK and phospho-AMPK (P-AMPK) or for total ACC and phospho-ACC (P-ACC) was done on separate gels, and GAPDH was used as a loading control for each individual blot to determine the P-AMPK/AMPK and P-ACC/ACC ratios.
ASS Activity Assay and Immunoprecipitation.
Rat livers were rapidly isolated and freeze-clamped within 10 s after animals were killed to prevent aberrations in metabolite and adenine nucleotide concentrations that may result from hypoxia (30, 31). Freeze-clamped livers were ground and lysed in buffer A [50 mM Tris⋅HCl (pH 7.4), 1 mM EGTA, 150 mM NaCl, 5 mM MgCl2, 1% Nonidet P-40 with cOmplete protease inhibitor tablet (Roche) per 50 mL buffer]. Liver homogenates were centrifuged at 20,800 × g for 15 min at 4 °C, and protein concentration was measured by Bradford assay. For enzyme assays, phosphorylated AMPKα2 was immunoprecipitated overnight from cell lysates containing 1 mg protein using 10 μL Cell Signaling Phospho-AMPKα (Thr172) (40H9) rabbit mAb (catalog no. 2535). Liver ASS was immunoprecipitated using 10 μL ASS1 antibody (C-19) (Santa Cruz catalog no. sc-46064) per 10 mg liver lysate protein. Normal IgG was used as a control. Total protein immunoprecipitated on the protein-A/G agarose beads was either boiled off in SDS buffer to prepare Western blot samples or acid-eluted using 0.2 M glycine (pH 2.5) and neutralized using Tris (pH 8.0). Eluted supernatant was concentrated using an Amicon Ultra-2 Centrifugal Filter Unit with Ultracel-10 membrane (Millipore catalog no. UFC201024). Protein concentration was measured by Bradford assay. Liver ASS activity was determined from these elutions by coupling ASS production of pyrophosphate to pyrophosphatase and measuring inorganic phosphate production. Reaction buffer contained 20 mM Tris⋅HCl (pH 7.8), 2 mM ATP, 10 mM citrulline, 10 mM aspartate, 6 mM MgCl2, 20 mM KCl, and 0.2 U pyrophosphatase. The reaction was incubated for 30 min at 37 °C. A 50-μL aliquot of the reaction was added to 50 μL molybdate buffer [10 mM ascorbic acid, 2.5 mM ammonium molybdate, 2% (vol/vol) sulfuric acid], and absorbance was measured at 660 nm. Increased absorbance corresponds to increased ASS activity as determined by pyrophosphate produced (based un an inorganic phosphate standard curve) and was normalized to eluted protein levels. For coimmunoprecipitation of ASS and AMPK, the following antibodies were used to immunoprecipitate AMPK: Santa Cruz AMPKα1 antibody (C-20) (catalog no. sc-19128), Santa Cruz AMPKα2 antibody (C-20) (catalog no. sc-19131), Abcam anti–AMPK-beta 1 antibody (Y367) (catalog no. ab32112), Cell Signaling AMPKβ2 antibody (catalog no. 4148), Cell Signaling Phospho-AMPKα (Thr172) (40H9) rabbit mAb (catalog no. 2535), and AMPKα antibody (catalog no. 2532).
Oxygen Consumption Studies.
Primary rat hepatocytes were freshly prepared and plated in 24-well Seahorse plates coated with collagen before each study on the Seahorse Bioscience XF24 Analyzer. Cells were incubated overnight in recovery medium. Before the study, medium was removed, and cells were incubated 5 h in DMEM base supplemented with either no substrate or treatment. Cells then were washed with Krebs–Henseleit buffer (KHB; 111 mM NaCl, 4.7 mM KCl, 2 mM MgSO4, 1.2 mM Na2HPO4, 2.5 mM glucose, 0.5 mM carnitine). Then 600 μL KHB was added to each well containing cells, and the plate was preincubated in the Seahorse CO2-free incubator at 37 °C for 1 h. Either 75 μL BSA control or BSA-conjugated palmitate was added to port A of the Seahorse flux plate. Fatty acid-stimulated oxygen consumption was measured over 40 min after reading basal respiration rates. Etomoxir was added in port B for a final concentration of 40 μM of the flux plate to inhibit respiration and to ascertain that the rates measured were specific to fatty acid stimulation.
Statistical Analysis.
All data are expressed as mean ± SEM. P values less than 0.05 were considered statistically significant differences as determined by unpaired two-tailed Student's t test or ANOVA. Data shown are representative of repeated experiments performed as indicated; where not indicated, a single experiment was performed. All replicates are biological replicates unless otherwise indicated.
SI Text
EGCG was used as a tool to modulate GDH activity and to demonstrate the importance of glutamine flux via GDH and the relative contribution of this amino acid to ureagenesis, gluconeogenesis, and AMPK activation. EGCG is reported to inhibit GDH and glutamine oxidation at 20 μM (14), and 1 μM EGCG was shown to increase AMPK phosphorylation in mouse primary hepatocytes (32). The much higher concentrations used in this study have an inhibitory effect on AMPK in rat primary hepatocytes in the presence of 10 mM glutamate. The differences in our data regarding the effects of EGCG on AMPK activity are likely caused by the very different experimental setup for our studies: The incubation time used here was much longer (2 h as opposed to 30 min), and the concentration of EGCG used was much higher. The effects seen with EGCG are under glutamine push conditions (10 mM l-glutamine supplementation) in which the influence of GDH flux on AMPK activity may be greater.
Acknowledgments
We thank Jianying Dong, Mario Kahn, Gina Butrico, Yanna Kosover, and Kathy Harry for technical support and Yasmeen Rahimi and Max C. Petersen for helpful discussions. This work was supported by NIH Grants R01 DK40936, R01 DK092606, U24 DK059635, and P30 DK45735.
Footnotes
The authors declare no conflict of interest.
This article contains supporting information online at www.pnas.org/lookup/suppl/doi:10.1073/pnas.1606022113/-/DCSupplemental.
References
- 1.Rolfe DF, Brown GC. Cellular energy utilization and molecular origin of standard metabolic rate in mammals. Physiol Rev. 1997;77(3):731–758. doi: 10.1152/physrev.1997.77.3.731. [DOI] [PubMed] [Google Scholar]
- 2.Stark R, et al. A role for mitochondrial phosphoenolpyruvate carboxykinase (PEPCK-M) in the regulation of hepatic gluconeogenesis. J Biol Chem. 2014;289(11):7257–7263. doi: 10.1074/jbc.C113.544759. [DOI] [PMC free article] [PubMed] [Google Scholar]
- 3.Gowans GJ, Hawley SA, Ross FA, Hardie DG. AMP is a true physiological regulator of AMP-activated protein kinase by both allosteric activation and enhancing net phosphorylation. Cell Metab. 2013;18(4):556–566. doi: 10.1016/j.cmet.2013.08.019. [DOI] [PMC free article] [PubMed] [Google Scholar]
- 4.Zeleznikar RJ, et al. Evidence for compartmentalized adenylate kinase catalysis serving a high energy phosphoryl transfer function in rat skeletal muscle. J Biol Chem. 1990;265(1):300–311. [PubMed] [Google Scholar]
- 5.Li Y, et al. AMPK phosphorylates and inhibits SREBP activity to attenuate hepatic steatosis and atherosclerosis in diet-induced insulin-resistant mice. Cell Metab. 2011;13(4):376–388. doi: 10.1016/j.cmet.2011.03.009. [DOI] [PMC free article] [PubMed] [Google Scholar]
- 6.Foretz M, et al. Short-term overexpression of a constitutively active form of AMP-activated protein kinase in the liver leads to mild hypoglycemia and fatty liver. Diabetes. 2005;54(5):1331–1339. doi: 10.2337/diabetes.54.5.1331. [DOI] [PubMed] [Google Scholar]
- 7.Assifi MM, et al. AMP-activated protein kinase and coordination of hepatic fatty acid metabolism of starved/carbohydrate-refed rats. Am J Physiol Endocrinol Metab. 2005;289(5):E794–E800. doi: 10.1152/ajpendo.00144.2005. [DOI] [PubMed] [Google Scholar]
- 8.Fullerton MD, et al. Single phosphorylation sites in Acc1 and Acc2 regulate lipid homeostasis and the insulin-sensitizing effects of metformin. Nat Med. 2013;19(12):1649–1654. doi: 10.1038/nm.3372. [DOI] [PMC free article] [PubMed] [Google Scholar]
- 9.Gao HZ, et al. Identification of 16 novel mutations in the argininosuccinate synthetase gene and genotype-phenotype correlation in 38 classical citrullinemia patients. Hum Mutat. 2003;22(1):24–34. doi: 10.1002/humu.10230. [DOI] [PubMed] [Google Scholar]
- 10.Engel K, Höhne W, Häberle J. Mutations and polymorphisms in the human argininosuccinate synthetase (ASS1) gene. Hum Mutat. 2009;30(3):300–307. doi: 10.1002/humu.20847. [DOI] [PubMed] [Google Scholar]
- 11.Leung TM, et al. Argininosuccinate synthase conditions the response to acute and chronic ethanol-induced liver injury in mice. Hepatology. 2012;55(5):1596–1609. doi: 10.1002/hep.25543. [DOI] [PMC free article] [PubMed] [Google Scholar]
- 12.Kuhara H, et al. Neonatal type of argininosuccinate synthetase deficiency. Report of two cases with autopsy findings. Acta Pathol Jpn. 1985;35(4):995–1006. [PubMed] [Google Scholar]
- 13.Felig P, Owen OE, Wahren J, Cahill GF., Jr Amino acid metabolism during prolonged starvation. J Clin Invest. 1969;48(3):584–594. doi: 10.1172/JCI106017. [DOI] [PMC free article] [PubMed] [Google Scholar]
- 14.Li C, et al. Green tea polyphenols modulate insulin secretion by inhibiting glutamate dehydrogenase. J Biol Chem. 2006;281(15):10214–10221. doi: 10.1074/jbc.M512792200. [DOI] [PubMed] [Google Scholar]
- 15.Zaleski J, Wilson DF, Erecinska M. Glutamine metabolism in rat hepatocytes. Stimulation by a nonmetabolizable analog of leucine. J Biol Chem. 1986;261(30):14082–14090. [PubMed] [Google Scholar]
- 16.Häberle J, et al. Mild citrullinemia in Caucasians is an allelic variant of argininosuccinate synthetase deficiency (citrullinemia type 1) Mol Genet Metab. 2003;80(3):302–306. doi: 10.1016/j.ymgme.2003.08.002. [DOI] [PubMed] [Google Scholar]
- 17. Quinonez SC, Thoene JG (2004) Citrullinemia Type I. Gene Reviews. Available at https://www.ncbi.nlm.nih.gov/books/NBK1458/. Accessed May 18, 2016.
- 18.McGarry JD, Leatherman GF, Foster DW. Carnitine palmitoyltransferase I. The site of inhibition of hepatic fatty acid oxidation by malonyl-CoA. J Biol Chem. 1978;253(12):4128–4136. [PubMed] [Google Scholar]
- 19.Kudo N, Barr AJ, Barr RL, Desai S, Lopaschuk GD. High rates of fatty acid oxidation during reperfusion of ischemic hearts are associated with a decrease in malonyl-CoA levels due to an increase in 5′-AMP-activated protein kinase inhibition of acetyl-CoA carboxylase. J Biol Chem. 1995;270(29):17513–17520. doi: 10.1074/jbc.270.29.17513. [DOI] [PubMed] [Google Scholar]
- 20.McGivan JD, Lacey JH, Joseph SK. Localization and some properties of phosphate-dependent glutaminase in disrupted liver mitochondria. Biochem J. 1980;192(2):537–542. doi: 10.1042/bj1920537. [DOI] [PMC free article] [PubMed] [Google Scholar]
- 21.Häussinger D, Stoll B, Stehle T, Gerok W. Hepatocyte heterogeneity in glutamate metabolism and bidirectional transport in perfused rat liver. Eur J Biochem. 1989;185(1):189–195. doi: 10.1111/j.1432-1033.1989.tb15101.x. [DOI] [PubMed] [Google Scholar]
- 22.Fang J, et al. Expression, purification and characterization of human glutamate dehydrogenase (GDH) allosteric regulatory mutations. Biochem J. 2002;363(Pt 1):81–87. doi: 10.1042/0264-6021:3630081. [DOI] [PMC free article] [PubMed] [Google Scholar]
- 23.Tomita T, Kuzuyama T, Nishiyama M. Structural basis for leucine-induced allosteric activation of glutamate dehydrogenase. J Biol Chem. 2011;286(43):37406–37413. doi: 10.1074/jbc.M111.260265. [DOI] [PMC free article] [PubMed] [Google Scholar]
- 24.Kibbey RG, et al. Mitochondrial GTP regulates glucose-stimulated insulin secretion. Cell Metab. 2007;5(4):253–264. doi: 10.1016/j.cmet.2007.02.008. [DOI] [PMC free article] [PubMed] [Google Scholar]
- 25.Stark R, et al. Phosphoenolpyruvate cycling via mitochondrial phosphoenolpyruvate carboxykinase links anaplerosis and mitochondrial GTP with insulin secretion. J Biol Chem. 2009;284(39):26578–26590. doi: 10.1074/jbc.M109.011775. [DOI] [PMC free article] [PubMed] [Google Scholar]
- 26.Kibbey RG, et al. Mitochondrial GTP insensitivity contributes to hypoglycemia in hyperinsulinemia hyperammonemia by inhibiting glucagon release. Diabetes. 2014;63(12):4218–4229. doi: 10.2337/db14-0783. [DOI] [PMC free article] [PubMed] [Google Scholar]
- 27.Roch-Ramel F. An enzymic and fluorophotometric method for estimating urea concentrations in nanoliter specimens. Anal Biochem. 1967;21(3):372–381. doi: 10.1016/0003-2697(67)90312-0. [DOI] [PubMed] [Google Scholar]
- 28.Ayala JE, et al. NIH Mouse Metabolic Phenotyping Center Consortium Standard operating procedures for describing and performing metabolic tests of glucose homeostasis in mice. Dis Model Mech. 2010;3(9-10):525–534. doi: 10.1242/dmm.006239. [DOI] [PMC free article] [PubMed] [Google Scholar]
- 29.Pesce MA, Bodourian SH, Nicholson JF. Rapid kinetic measurement of lactate in plasma with a centrifugal analyzer. Clin Chem. 1975;21(13):1932–1934. [PubMed] [Google Scholar]
- 30.Faupel RP, Seitz HJ, Tarnowski W, Thiemann V, Weiss C. The problem of tissue sampling from experimental animals with respect to freezing technique, anoxia, stress and narcosis. A new method for sampling rat liver tissue and the physiological values of glycolytic intermediates and related compounds. Arch Biochem Biophys. 1972;148(2):509–522. doi: 10.1016/0003-9861(72)90170-1. [DOI] [PubMed] [Google Scholar]
- 31.Madiraju AK, et al. Metformin suppresses gluconeogenesis by inhibiting mitochondrial glycerophosphate dehydrogenase. Nature. 2014;510(7506):542–546. doi: 10.1038/nature13270. [DOI] [PMC free article] [PubMed] [Google Scholar]
- 32.Collins QF, et al. Epigallocatechin-3-gallate (EGCG), a green tea polyphenol, suppresses hepatic gluconeogenesis through 5′-AMP-activated protein kinase. J Biol Chem. 2007;282(41):30143–30149. doi: 10.1074/jbc.M702390200. [DOI] [PMC free article] [PubMed] [Google Scholar]


