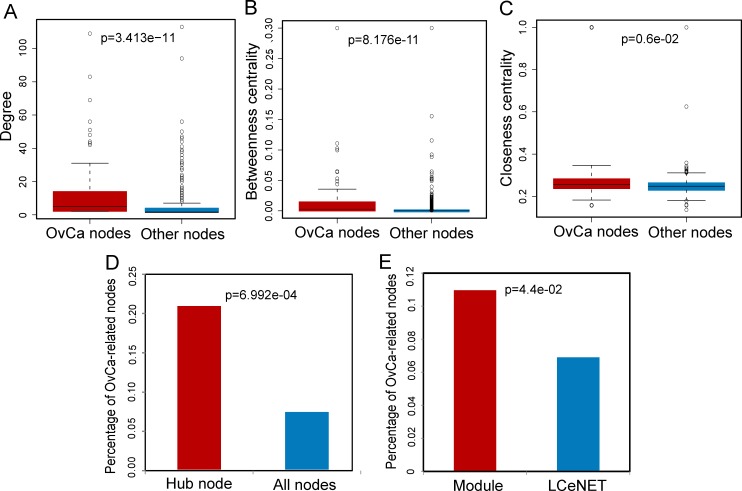
Figure 2. The ovarian cancer-associated nodes tend to be hubs and are enriched in modules.
A. The difference of degree between ovarian cancer-associated nodes and other nodes. Ovarian cancer-associated nodes had a higher degree than other nodes. B. The difference of betweenness centrality between ovarian cancer-associated nodes and other nodes. Ovarian cancer-associated nodes had a higher betweenness centrality than other nodes. C. The difference of clustering coefficient between ovarian cancer-associated nodes and other nodes. Ovarian cancer-associated nodes had a higher clustering coefficient than other nodes. P-values were calculated based on Wilcoxon rank sum test. D. The proportion of ovarian cancer-associated nodes among hubs and all nodes in the LCeNET. E. The proportion of ovarian cancer-associated nodes among modules and LCeNET. P-values were calculated based on Hypergeometric test.

