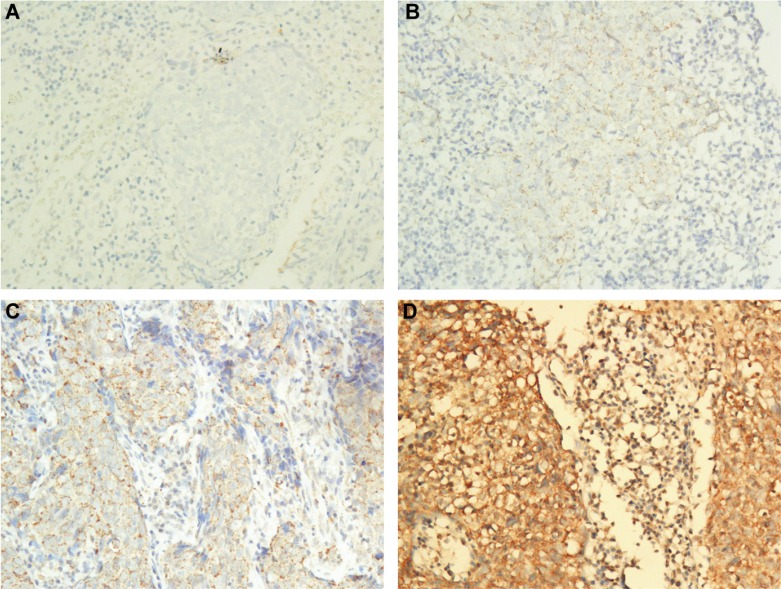
Figure 1. Representative images of the different intensities of the IHC staining for CTLA-4 expression.
(A) Negative staining of CTLA-4 in NPC tumor and lymphocyte (200 ×); (B) Weak staining of CTLA-4 in NPC tumor and lymphocyte (200 ×); (C) Moderate staining of CTLA-4 in NPC tumor and lymphocyte (200 ×); (D) Strong staining of CTLA-4 in NPC tumor and lymphocyte (200 ×).

