ABSTRACT
Dedifferentiated fat (DFAT) cells have been shown to be multipotent, similar to mesenchymal stem cells (MSCs). In this study, we aimed to establish and characterize equine DFAT cells. Equine adipocytes were ceiling cultured, and then dedifferentiated into DFAT cells by the seventh day of culture. The number of DFAT cells was increased to over 10 million by the fourth passage. Flow cytometry of DFAT cells showed that the cells were strongly positive for CD44, CD90, and major histocompatibility complex (MHC) class I; moderately positive for CD11a/18, CD105, and MHC class II; and negative for CD34 and CD45. Moreover, DFAT cells were positive for the expression of sex determining region Y-box 2 as a marker of multipotency. Finally, we found that DFAT cells could differentiate into osteogenic, chondrogenic, and adipogenic lineages under specific nutrient conditions. Thus, DFAT cells could have clinical applications in tissue regeneration, similar to MSCs derived from adipose tissue.
Keywords: Adipocyte, dedifferentiated fat cell, equine, multipotency
Various cell sources, culture media, and protocols have been investigated for rapid preparation of adequate numbers of mesenchymal stem cells (MCSs) as multipotent cells for clinical use. Adipose tissue (AT) contains more MSCs per unit weight of tissue than other tissues, such as bone marrow (BM) and the umbilical cord [2]. However, regeneration therapy using AT-derived MSCs (AT-MSCs) could be difficult to achieve using racehorses as cell sources because Thoroughbreds have relatively low body fat percentages [7]. Differentiated cells from embryonic stem cells or iPS cells would be more hopeful cell sources for regeneration of lost tissues compared with these somatic stem cells. However, there are some major problems including canceration, immunoreaction, expenditure, and so on, which must be resolved before medical trials.
Previous studies have shown that mature adipocytes isolated from fat tissue can be dedifferentiated into fibroblast-like cells having proliferative activity using the ceiling culture (CC) method [16,17,18]. Recent studies have described mature adipocyte-derived dedifferentiated fat (DFAT) cells that are multipotent and can be obtained in large numbers by CC of mouse, human, rat, porcine, rabbit, bovine, and feline cells [6, 8,9,10, 22, 23]. Mature adipocytes are the most abundant cells in AT [10] and are therefore more numerous than MSCs in AT. Furthermore, AT contains more adipocytes that could be DFAT cells than BM, and skin incision to collect AT could be less invasiveness than paracentesis to aspirate BM. Also, DFAT cells have been reported to show properties similar to BM-derived MSCs [15]. Accordingly, if equine adipocytes could be converted into DFAT cells, the number of multipotent cells derived from AT could be easily increased, and the time required to prepare adequate numbers of stem cells for various therapies could be shortened.
In this study, we aimed to establish equine DFAT cells derived from mature adipocytes and to investigate the characteristics and multipotency of these cells, and we proposed the advantage that two kinds of multipotent cells (not only AT-MSCs but also DFAT cells) could be propagated from AT.
Materials and Methods
All procedures in this study were approved by the Animal Care and Use Committee of Kagoshima University (approval no. A11029).
Adipocyte isolation
Five gram of AT, obtained as a lump through a 10-cm skin incision in the gluteal region of nine horses raised as food animals (one male and eight female Normandy horses, 2–10 years of age, 809–1,017 kg body weight) immediately after euthanasia, was treated with five volumes (25 ml) of phosphate-buffered saline (PBS) containing 0.1% collagenase (collagenase type I, Worthington Biomedical Corp., Lakewood, NJ, U.S.A.) at 37°C for 90 min, filtered through a 70-µm nylon filter (Cell Strainer, BD Falcon, Sparks, MD, U.S.A.), and centrifuged at 160 × g for 5 min at room temperature (RT). One milliliter of the approximately 5 ml supernatant (containing mature adipocytes) was collected for DFAT culture.
Adipocyte dedifferentiation
The supernatant was placed in a 12.5-cm2 culture flask filled completely with complete culture medium (CCM) consisting of Dulbecco’s modified Eagle’s medium (DMEM; Thermo Fisher Scientific, Waltham, MA, U.S.A.), 10% fetal bovine serum (FBS; Thermo Fisher Scientific), and 1% antibiotic-antimycotic preparation (500 U penicillin G, 500 µg streptomycin, and 1.25 µg amphotericin B; Antibiotic-Antimycotic, Thermo Fisher Scientific). As the flask was inverted, the floating cells in the medium touched the ceiling plane of the flask (i.e., CC). Following 7 days of CC at 37°C in 5% CO2, the medium was changed, and the flask was return to normal culture conditions (seventh day at passage 0 [P0D7]). After another 7 days, the cells adhering to the bottom plane of the flask were washed with PBS, harvested with 0.05% trypsin and 0.2 mM ethylenediaminetetraacetic acid (EDTA; Trypsin-EDTA, Thermo Fisher Scientific) as DFAT cells, and centrifuged (P0D14).
Isolation of MSCs from AT
Subcutaneous AT was obtained from the gluteal region of two horses, which were a 10-year-old male pony (350 kg) and a 3-year-old female pony (150 kg), using liposuction under epidural anesthesia with 2% lidocaine (Xylocaine Injection 2%, AstraZeneca, London, U.K.) following premedication with 40 µg/kg medetomidine HCl (Domitor, Zenoaq, Koriyama, Japan) and 10 µg/kg butorphanol tartrate (Vetorphale, Meiji Seika, Tokyo, Japan). After subcutaneous injection of 100–200 ml liposuction solution consisting of 500 ml physiological saline (Otsuka Normal Saline, Otsuka, Tokyo, Japan), 20 ml of 1% lidocaine, and 20 ml of 0.001% adrenaline (200 mg lidocaine and 200 µg adrenaline; Xylocaine Injection 1% with Epinephrine, AstraZeneca) through a 5-mm skin incision, the swollen AT was aspirated with a probe (Collection Cannula, 14 G, 30 cm long, Cytori Therapeutics Inc., San Diego, CA, U.S.A.) connected to a 50-ml syringe. This procedure was repeated three times. Fifteen gram of AT was digested with five volumes of PBS containing 0.1% collagenase (collagenase type I) at 37°C for 90 min, filtered through a 70-µm nylon filter (Cell Strainer), and centrifuged at 160 × g for 5 min at RT. The cell pellet was resuspended in CCM and incubated at 37°C in an atmosphere containing 5% CO2 for 9 days, and cells adhering to the bottom of the flask were then washed with PBS and harvested as AT-MSCs. The medium was changed on day 6 (P0D6).
Cell proliferation
The cells detached from the bottom of a flask was resuspended in CCM and incubated at 37°C in an atmosphere containing 5% CO2 for 6 days (P1D0). The medium was changed every 3 days for 6 days after P1. The cells were harvested and centrifuged (P1D6). After decanting the supernatant, the pellet was rinsed with CCM, and the cells were replated at a density of 1 × 10⁶ cells/150-cm2 dish and cultured for 6 days (P2D0). This serial process of passaging was repeated to obtain more than 1 × 10⁷ cells for the following analysis in vitro. The total number of cells at every passage from P0 was determined with a cell counter (TC10, Bio-Rad, Hercules, CA, U.S.A.). Proliferation rates were calculated as the cell doubling number and cell doubling time using the following formulas:
Cell doubling number= ln (final number of cells / initial number of cells)/ ln (2).
Cell doubling time [days]=cell culture time / cell doubling number.
RT-PCR for the embryonic genetic markers
Total RNA from the cultured cells at P5 was prepared with a mirVana miRNA Isolation Kit (Thermo Fisher Scientific) and then was converted to cDNA with a ReverTra Dash RT-PCR kit (Toyobo, Osaka, Japan) according to the manufacturer’s instructions. The expression of sex determining region Y-box 2 (Sox-2) mRNA was evaluated as a marker of multipotency by RT-PCR (Table 1) as previously reported [4, 13, 21]. The PCR products were separated by electrophoresis on 1.5% agarose gels and labeled with SYBR green.
Table 1. Reverse transcriptase PCR primer sequences, annealing temperatures, and amplification product sizes for multipotent genes.
| Marker | Gene | Sequence (forward/reverse) | Annealing temperature (°C) |
Fragment (base pairs) |
|---|---|---|---|---|
| Multipotency | Sox-2 | 5′-TGGTTACCTCTTCCTCCCACT-3′ | 58.0 | 179 |
| 5′-GGGCAGTGTGCCGTTAAT-3′ | ||||
| Housekeeping | GAPDH | 5′-ACCACAGTCCATGCCATCAC-3′ | 60.0 | 450 |
| 5′-TCCACCACCCTGTTGCTGTA-3′ | ||||
Sox2, sex determining region Y-box 2; GAPDH, glyceraldehyde-3-phosphate dehydrogenase.
Flow cytometry for the immunological cell-surface markers
At P5, cells (1 × 10⁴) were resuspended in 500 µl staining buffer (SB; PBS containing 1% FBS) and incubated for 30 min at RT with 20 µg/ml antibodies targeting equine CD11a/CD18 (polyclonal), CD34 (581/CD34), CD44 (CVS18), CD45 (2D1), CD90 (5E10), CD105 (SN6), and major histocompatibility complex (MHC) classes I (polyclonal) and II (polyclonal), as detailed in Table 2 [13]. Antibodies against CD11a/CD18, CD44, and MHC classes I and II were coupled with secondary antibodies (polyclonal) conjugated to fluorescein isothiocyanate (FITC). Nonspecific FITC mouse immunoglobulin G1κ (MOPC-21) was used as a negative control. Cell fluorescence was evaluated as a shift in the mean fluorescence intensity (MFI) using a flow cytometer (FACSAria II, BD, Sparks, MD, U.S.A.). The data were analyzed using FACSDiva software (BD).
Table 2. Antibodies for analyzing the specific molecular markers on the cell surface.
| Antibody | Company | Clone | Epitope | Dilution |
|---|---|---|---|---|
| CD11a/CD18 | Gifted | CZ3.2, 117, 2E11, B10 | Not confirmed | 1:10 |
| CD34 | BD Biosciences | 581/CD34 | O-glycosylated transmembrane glycoprotein | 1:5 |
| CD44 | AbD Serotec | CVS18 | Not confirmed | 1:10 |
| CD45 | BD Biosciences | 2D1 | T200 family | 1:2.5 |
| CD90 | BD Biosciences | 5E10 | Not confirmed | 1:10 |
| CD105 | AbD Serotec | SN6 | Glycoprotein homodimer | 1:10 |
| MHC class I | Gifted | CZ3, 117, 1B12, C11 | Not confirmed | 1:10 |
| MHC class II | Gifted | CZ11, 130, 8E8, D9 | Not confirmed | 1:10 |
| Secondary (FITC) | Rockland | - | Mouse IgG (H and L) | 1:500 |
| Isotype control | BD Biosciences | MOPC-21 | Not confirmed | 1:10 |
MHC, major histocompatibility complex; FITC, fluorescein isothiocyanate. The antibodies against CD11a/18 and MHC classes I and II were gifted by Dr Douglas Antczak, Cornell University, Ithaca, NY, U.S.A.
Trilineage differentiation assay
To investigate osteogenic differentiation, cells were plated in 6-well plates (6 Well Plate-N, NEST Biotech, China) in CCM at an initial density of 2.5 × 10³ cells/cm2. After incubation for 24 hr, CCM was replaced with osteogenic induction medium (Differentiation Basal Medium-Osteogenic, Lonza, Basel, Switzerland) supplemented with 100 µM ascorbic acid, 10 mM β-glycerophosphate, and 1 µM dexamethasone. After 2 weeks in induction medium, the production of calcium crystals in the osteogenic extracellular matrix was evaluated by staining with Alizarin Red.
For chondrogenic differentiation, cells were plated in 6-well plates in CCM at an initial density of 2.5 × 10³ cells/cm2. Chondrogenic differentiation was induced in 6-well plates in 2 ml of induction medium (Differentiation Basal Medium-Chondrogenic, Lonza) supplemented with 4.5 g/l D-glucose, 350 µM L-proline, 100 nM dexamethasone, and 0.02 g/l transforming growth factor beta 3 (TGF-β3). The medium was replaced three times per week. After 2 weeks, production of mucopolysaccharide in the chondrogenic extracellular matrix was determined by staining with Alcian blue.
Adipogenic induction was initiated when cells reached a density of 15,000 cells/cm2 on 6-well plates in basal medium. Following preincubation for 24 hr, CCM was replaced with adipogenic induction medium (Differentiation Basal Medium-Adipogenic, Lonza), composed of DMEM supplemented with 4.5 g/l D-glucose, 100 µM indomethacin, 10 µg/ml insulin, 0.5 mM 3-isobutyl-1-methylxanthine, 1 µM dexamethasone, and 5% rabbit serum. Five days later, adipocyte-specific intracellular lipids were stained with oil red O.
Results
Adipocyte isolation and dedifferentiation
After collagenase treatment and centrifugation of AT, most of the floating cells in the upper layer were monovacuolar spherical adipocytes. Approximately 50% of the cells adhered to the ceiling of the flask and exhibited extended cytoplasms by day 5 (P0D5; Fig. 1A). Some of the cells had many divided droplets in their cytoplasms (P0D6; Fig. 1B). The cells generated fibroblast-like DFAT cells, colonized by day 7 (P0D7; Fig. 1C), and became DFAT cells thereafter, exhibiting a spindle-shaped morphology without droplets by day 14 at P0 (P0D14; Fig. 1D).
Fig. 1.
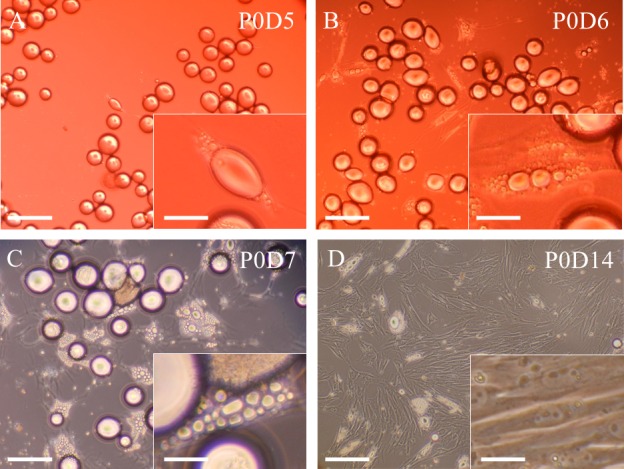
Representative images showing a series of dedifferentiation of equine mature fat cells prepared from gluteal subcutaneous adipose tissue. The majority of cells floating in the upper layer were monovacuolar spherical adipocytes at the beginning of ceiling culture, but approximately 50% of isolated cells adhered to the ceiling of the flask and exhibited extended cytoplasm by day 5 (P0D5; A). Some cells had many divided droplets in their cytoplasm (P0D6; B). The cells divided and generated fibroblast-like DFAT cells and thereafter colonized by day 7 (P0D7; C). DFAT cells exhibited a spindle-shaped morphology without droplets by day 14 at P0 (P0D14; D). Scale bar=100 µm or 10 µm (in insert images). DFAT, dedifferentiated fat.
Cell proliferation
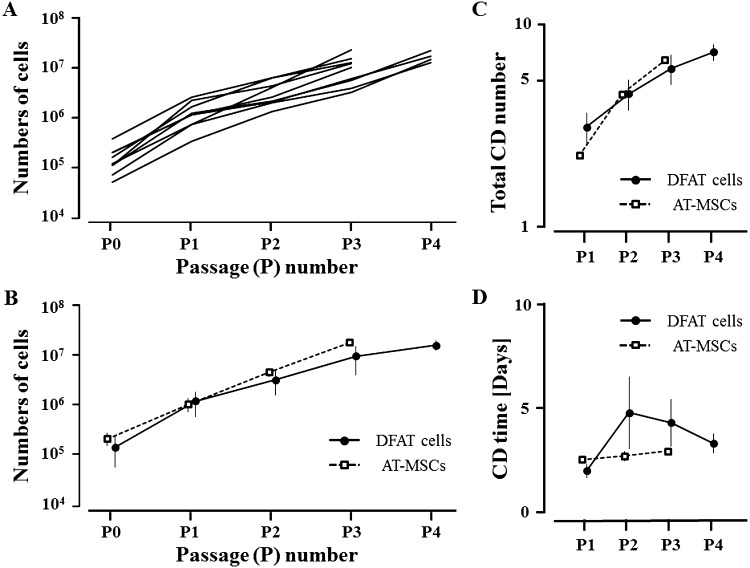
The proliferation rates of DFAT cells and AT-MSCs are shown in Fig. 2. DFAT cells proliferated to over 1 × 10⁷ cells at P3 or P4 (Fig. 2A), and the average numbers of DFAT cells were 1.54 × 10⁵ ± 9.27 × 10⁴, 1.3 × 10⁶ ± 6.76 × 10⁵, 3.44 × 10⁶ ± 1.75 × 10⁶, 1.02 × 10⁷ ± 5.98 × 10⁶, and 1.68 × 10⁷ ± 3.61 × 10⁶ cells at P0, P1, P2, P3, and P4, respectively (Fig. 2B). Thus, the total cell doubling numbers of DFAT cells were 3.08 ± 0.57, 4.52 ± 0.78, 6.02 ± 0.99, and 7.28 ± 0.69 at P1, P2, P3, and P4, respectively (Fig. 2C), and the cell doubling times were 2.01 ± 0.33, 4.8 ± 1.73, 4.32 ± 1.14, and 3.33 ± 0.46 days at P1, P2, P3, and P4, respectively (Fig. 2D).
Fig. 2.
Growth curves (A) from passages 0 to 4 (P0–P4) of DFAT cells collected from nine horses. Average growth curve (B), total CD numbers (C), and CD time (D) from P0–P4 of DFAT cells collected from the horses and adipose tissue-derived mesenchymal stem cells (AT-MSCs) collected from two horses. Five DFAT cell samples produced >1 × 10⁷ cells at P3, and four DFAT cell samples required another 6 days to reach >1 × 10⁷ cells at P4 (A). DFAT, dedifferentiated fat. CD number=ln (Nf/Ni)/ln (2). CD time=cell culture time [Days]/CD number. Nf, final number of cells; Ni, initial number of cells.
AT-MSCs proliferated to over 1 × 10⁷ cells at P3, reaching 2.24 × 10⁵ ± 6.4 × 10⁴, 1.11 × 10⁶ ± 3.34 × 10⁵, 4.89 × 10⁶ ± 9.05 × 10⁵, and 1.96 × 10⁷ ± 2.35 × 10⁶ cells at P0, P1, P2, and P3, respectively (Fig. 2B). Thus, the total cell doubling numbers of AT-MCSs were 2.3 ± 0.02, 4.48 ± 0.15, and 6.5 ± 0.25 at P1, P2, and P3, respectively (Fig. 2C), and the cell doubling times were 2.61 ± 0.03, 2.76 ± 0.23, and 2.98 ± 0.14 days at P1, P2, and P3, respectively (Fig. 2D).
RT-PCR and flow cytometry
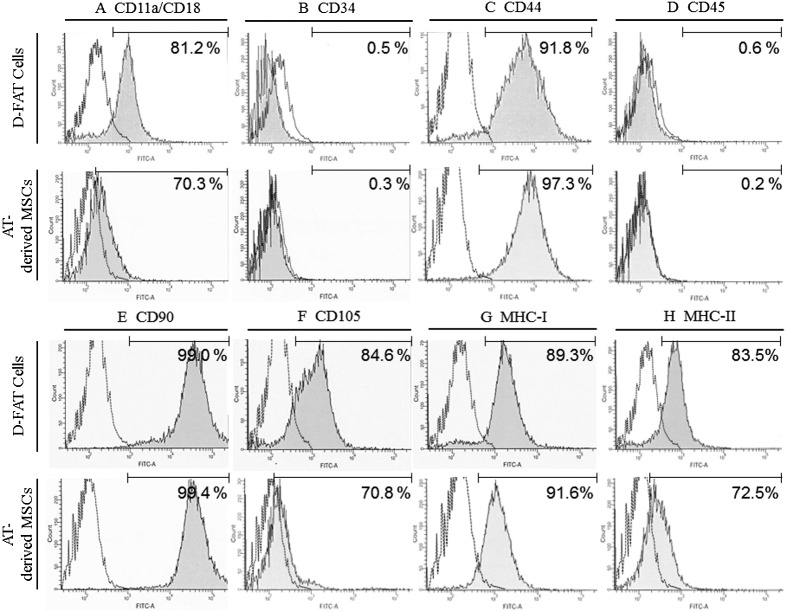
DFAT cells were positive for the expression of Sox-2 mRNA like other equine MSCs derived from synovial fluid and bone marrow (Fig. 3) [13, 21]. As shown in Fig. 4, the MFI strongly shifted when antibodies targeting CD44 (91.8%), CD90 (99.0%), and MHC class I (89.3%) were used. In contrast, positive shifts were moderate with antibodies targeting CD11a/18 (81.2%), CD105 (84.6%), and MHC class II (83.5%), and no positive reactions were detected with antibodies targeting CD34 (0.5%) and CD45 (0.6%). Antibodies targeting CD34 and CD45 were detected in equine mononuclear blood cells (data not shown), as previously described [1, 14].
Fig. 3.
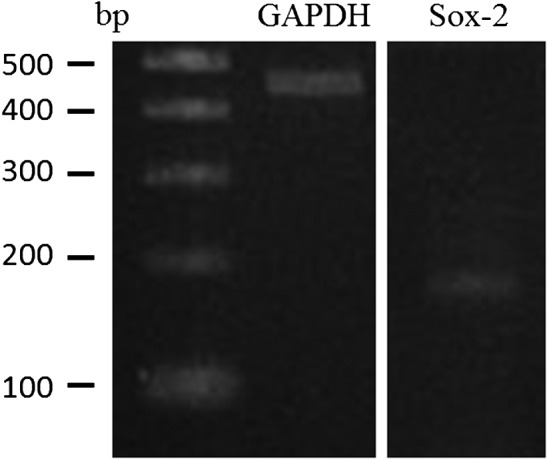
Results of reverse transcriptase-PCR using Sox-2 as a multipotency marker gene of dedifferentiated fat cells. Sox2, sex determining region Y-box 2; G3PDH, glyceraldehyde-3-phosphate dehydrogenase.
Fig. 4.
Results of flow cytometry using immunological markers on DFAT cells and AT-MSCs. A strong shift in MFI was detected with antibodies against CD44 (C), CD90 (E), and MHC class I (G); a positive signal with antibodies against CD11a/18 (A), CD105 (F), and MHC class II (H) partially overlapped with the negative control; and no positive signal was detected with antibodies against CD34 (B) and CD45 (D). The dotted line represents the negative control. The horizontal line in individual histograms indicates the population (%) of positive cells. DFAT, dedifferentiated fat; AT-MSCs, adipose tissue-derived mesenchymal stem cells; MFI, mean fluorescence intensity; MHC, major histocompatibility complex.
In accordance with our previous results for AT-MSCs [13], the MFI shifted strongly when antibodies targeting CD44 (97.3%), CD90 (99.4%), and MHC class I (91.6%) were used. Similarly, positive shifts were moderate with antibodies targeting CD11a/18 (70.3%), CD105 (70.8%), and MHC class II (72.5%), whereas no positive reactions were detected with antibodies targeting CD34 (0.3%) and CD45 (0.2%) (Fig. 4).
Trilineage differentiation
Following osteogenic induction, clusters of DFAT cells produced a specific matrix including calcium apatite crystals, which were positively stained with Alizarin Red (Fig. 5A). After chondrogenic induction, DFAT cells aggregated and then contracted to form colonies that stained intensely with Alcian blue (Fig. 5D). Adipogenic induction of DFAT cells resulted in adipocyte-like flattened cells with small lipid vesicles that stained positively with oil red O (Fig. 5G). The negative controls were cultured with CCM during the corresponding periods of time taken to induce osteogenic, adipogenic, and chondrogenic differentiation (Fig. 5B, 5E and 5H). These results were consistent with findings in AT-MSCs (Fig. 5C, 5F and 5I). The staining intensity specific to the three types of differentiation (osteogenesis, chondrogenesis, and adipogenesis) was also the same between these two types of cells derived from AT.
Fig. 5.
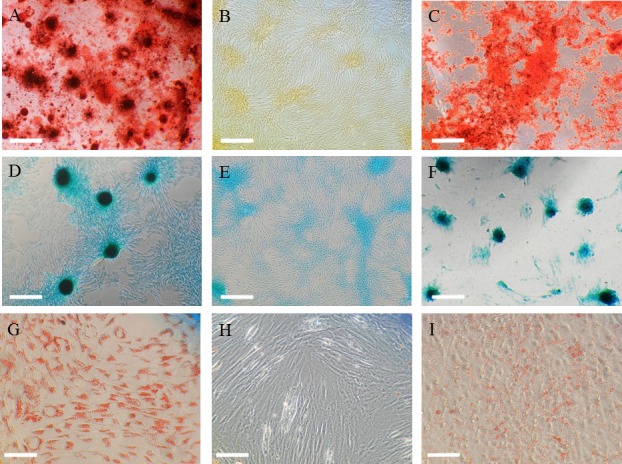
Representative images showing staining with alizarin red (A, B, C), alcian blue (D, E, F), and oil red O (G, H, I). Following 2 weeks of osteogenic induction, the DFAT cells (A) and AT-MSCs (C) aggregated and contracted to form colonies and produced a specific matrix including calcium apatite crystals, which were positively stained with alizarin red. Scale bar=500 µm (A, B, C). Plate culture of DFAT cells (D) and AT-MSCs (F) in chondrogenic induction medium induced formation of colonies and production of extracellular matrix stained with alcian blue. Scale bar=500 µm (D, E, F). Adipogenic induction of DFAT cells (G) and AT-MSCs (I) resulted in adipocyte-like flattened cells with small lipid vesicles that stained red with oil red O. Scale bar=250 µm (G, H, I). The negative controls were cultured with CCM during the corresponding periods of time taken to induce osteogenic, adipogenic, and chondrogenic differentiation (B, E, H). DFAT, dedifferentiated fat; AT-MSCs, adipose tissue-derived mesenchymal stem cells; CCM, complete culture medium.
Discussion
In this study, we established and characterized equine DFAT cells as multipotent cells similar to MSCs. Our results showed that DFAT cells could be obtained from equine AT and prepared using simple procedures to produce abundant amounts of cells able to undergo osteogenic, adipogenic, and chondrogenic differentiation. These data provide important information for establishing novel sources of large amounts of multipotent cells for tissue regeneration applications.
In this study, the initial cultures of equine DFAT cells were started using 1 ml of fatty layer, which was obtained from the approximately 5-ml supernatant after centrifugation of 5 g AT treated with 25 ml of 0.1% collagenase solution. In contrast, to collect an adequate amount of cell pellet for the initial culture of equine AT-MSCs, 15 g of AT had to be treated with 75 ml of 0.1% collagenase solution. Therefore, the initial requirement for culture of equine DFAT cells was calculated to be 1 g of AT, that is, one-fifteenth of the initial requirement (15 g of AT) for collecting an adequate amount of cell pellet to start culture of equine AT-MSCs. Because the numbers of DFAT cells and AT-MSCs at P0, P1, and P2 were almost the same, as presented in Fig. 2B, it is also suggested that the initial number of DFAT cells per weight of AT is more abundant (approximately 15 times) than that of AT-MSCs; that is, DFAT cells could be isolated and propagated with smaller amount of fat tissue than AT-MSCs. Equine adipocytes may have potential applications as a source of DFAT cells for multipotent differentiation in tissue regeneration, as previously reported in other animals [10]. DFAT cells which could be propagated after MSC isolation due to enzymatic digestion of AT, are another cell source from AT. We showed in this paper that these two kinds of multipotent cells were obtained from AT and that both two cells should be useful for regenerative medicine as somatic stem cells. However, we do not have any substantial results suggesting the superiority of the cells for clinical use.
A previous study indicated that equine adipocytes could be harvested at a density of 1.8 × 10⁶ cells/g tissue on average [3]. Additionally, previous reports have shown that approximately 40–50% of adipocytes adhere to the ceiling of the flask during CC [8, 10]. Based on these reports, we would expect to have obtained approximately 8.0 × 10⁶ DFAT cells in CC at P0P7 from the given amount of adipocytes. However, we actually obtained about 1.5 × 10⁵ cells in normal culture after CC at P0D14, which was less than expected. The adipocytes included in a unit weight could be higher or lower in accordance with the animal species, age, gender, and so on [5, 7, 19, 20]. The finding of fewer cells than expected might be due to the increased weight of adipose tissues in the fatter horses as food. This is because of the negative correlation between the number of adipocytes and the total weight of adipose tissue [20]. In a similar way, another report showed that only 5.0 × 10⁴ DFAT cells were obtained from 1 g of AT, which was approximately 40 times lower than the number of AT-MSCs (2.0 × 10⁶) at the beginning of primary culture [8].
The total doubling numbers of equine DFAT cells were slightly lower than those of AT-MSCs at P1, P2, and P3. Moreover, the doubling time of equine DFAT cells ranged from 48 to 120 hr, which was longer than those of the other species, such as humans and felines [8, 10]. The doubling number and time could be easily affected by the different contents of culture media. In a previous study, a hyper-nutrient medium comprised of DMEM supplement with 20%FBS [6, 8,9,10, 15] or Ham’s F-12 [22] was used. On the other hand, we used DMEM+10% FBS to determine the growth rates with the usual culture medium containing the minimum requirements for nutrition. The results of flow cytometry analysis showed the same immunophenotypes (positive for CD44 and CD90; negative for CD34 and CD45) in both equine DFAT cells and AT-MSCs [13]. Equine DFAT cells also showed similar immunophenotypes in DFAT cells of other animals [8,9,10,11,12]. Equine DFAT cells showed multilineage differentiation potential similar to that of AT-MSCs, as reported in other animals [8, 10].
In summary, these findings suggested that AT-MSCs and DFAT cells are promising cell sources for cell-based therapies in horses.
Conflict of Interest
None of the authors have any financial or personal relationships that could inappropriately influence or bias the content of the paper.
Acknowledgments
The authors would like to thank Dr. Douglas Antczak, Mr. Donald Miller, and Ms. Becky Harman for kindly providing the antibodies targeting CD11a/18 and MHC classes I and II. We would also like to thank Editage for English language editing.
References
- 1.Barberini D.J., Freitas N.P., Magnoni M.S., Maia L., Listoni A.J., Heckler M.C., Sudano M.J., Golim M.A., da Cruz Landim-Alvarenga F., Amorim R.M. 2014. Equine mesenchymal stem cells from bone marrow, adipose tissue and umbilical cord: immunophenotypic characterization and differentiation potential. Stem Cell Res. Ther. 5: 25. [DOI] [PMC free article] [PubMed] [Google Scholar]
- 2.Burk J., Ribitsch I., Gittel C., Juelke H., Kasper C., Staszyk C., Brehm W. 2013. Growth and differentiation characteristics of equine mesenchymal stromal cells derived from different sources. Vet. J. 195: 98–106. [DOI] [PubMed] [Google Scholar]
- 3.Carrington E.F., Desautels M., Naylor J.M. 2003. beta-Adrenergic stimulated lipolysis in pony adipocytes is exclusively via a beta2-subtype and is not affected by lactation. Comp. Biochem. Physiol. A Mol. Integr. Physiol. 136: 311–320. [DOI] [PubMed] [Google Scholar]
- 4.Gao Q., Zhao L., Song Z., Yang G. 2012. Expression pattern of embryonic stem cell markers in DFAT cells and ADSCs. Mol. Biol. Rep. 39: 5791–5804. [DOI] [PubMed] [Google Scholar]
- 5.Geissler P.J., Davis K., Roostaeian J., Unger J., Huang J., Rohrich R.J. 2014. Improving fat transfer viability: the role of aging, body mass index, and harvest site. Plast. Reconstr. Surg. 134: 227–232. [DOI] [PubMed] [Google Scholar]
- 6.Kikuta S., Tanaka N., Kazama T., Kazama M., Kano K., Ryu J., Tokuhashi Y., Matsumoto T. 2013. Osteogenic effects of dedifferentiated fat cell transplantation in rabbit models of bone defect and ovariectomy-induced osteoporosis. Tissue Eng. Part A 19: 1792–1802. [DOI] [PMC free article] [PubMed] [Google Scholar]
- 7.Kearns C.F., McKeever K.H., Kumagai K., Abe T. 2002. Fat-free mass is related to one-mile race performance in elite standardbred horses. Vet. J. 163: 260–266. [DOI] [PubMed] [Google Scholar]
- 8.Kono S., Kazama T., Kano K., Harada K., Uechi M., Matsumoto T. 2014. Phenotypic and functional properties of feline dedifferentiated fat cells and adipose-derived stem cells. Vet. J. 199: 88–96. [DOI] [PubMed] [Google Scholar]
- 9.Ono H., Oki Y., Bono H., Kano K. 2011. Gene expression profiling in multipotent DFAT cells derived from mature adipocytes. Biochem. Biophys. Res. Commun. 407: 562–567. [DOI] [PubMed] [Google Scholar]
- 10.Matsumoto T., Kano K., Kondo D., Fukuda N., Iribe Y., Tanaka N., Matsubara Y., Sakuma T., Satomi A., Otaki M., Ryu J., Mugishima H. 2008. Mature adipocyte-derived dedifferentiated fat cells exhibit multilineage potential. J. Cell. Physiol. 215: 210–222. [DOI] [PubMed] [Google Scholar]
- 11.McIntosh K., Zvonic S., Garrett S., Mitchell J.B., Floyd Z.E., Hammill L., Kloster A., Di Halvorsen Y., Ting J.P., Storms R.W., Goh B., Kilroy G., Wu X., Gimble J.M. 2006. The immunogenicity of human adipose-derived cells: temporal changes in vitro. Stem Cells 24: 1246–1253. [DOI] [PubMed] [Google Scholar]
- 12.Mitchell J.B., McIntosh K., Zvonic S., Garrett S., Floyd Z.E., Kloster A., Di Halvorsen Y., Storms R.W., Goh B., Kilroy G., Wu X., Gimble J.M. 2006. Immunophenotype of human adipose-derived cells: temporal changes in stromal-associated and stem cell-associated markers. Stem Cells 24: 376–385. [DOI] [PubMed] [Google Scholar]
- 13.Murata D., Miyakoshi D., Hatazoe T., Miura N., Tokunaga S., Fujiki M., Nakayama K., Misumi K. 2014. Multipotency of equine mesenchymal stem cells derived from synovial fluid. Vet. J. 202: 53–61. [DOI] [PubMed] [Google Scholar]
- 14.Mohanty N., Gulati B.R., Kumar R., Gera S., Kumar P., Somasundaram R.K., Kumar S. 2014. Immunophenotypic characterization and tenogenic differentiation of mesenchymal stromal cells isolated from equine umbilical cord blood. In Vitro Cell. Dev. Biol. Anim. 50: 538–548. [DOI] [PubMed] [Google Scholar]
- 15.Poloni A., Maurizi G., Leoni P., Serrani F., Mancini S., Frontini A., Zingaretti M.C., Siquini W., Sarzani R., Cinti S. 2012. Human dedifferentiated adipocytes show similar properties to bone marrow-derived mesenchymal stem cells. Stem Cells 30: 965–974. [DOI] [PubMed] [Google Scholar]
- 16.Sugihara H., Funatsumaru S., Yonemitsu N., Miyabara S., Toda S., Hikichi Y. 1989. A simple culture method of fat cells from mature fat tissue fragments. J. Lipid Res. 30: 1987–1995. [PubMed] [Google Scholar]
- 17.Sugihara H., Yonemitsu N., Miyabara S., Toda S. 1987. Proliferation of unilocular fat cells in the primary culture. J. Lipid Res. 28: 1038–1045. [PubMed] [Google Scholar]
- 18.Sugihara H., Yonemitsu N., Miyabara S., Yun K. 1986. Primary cultures of unilocular fat cells: characteristics of growth in vitro and changes in differentiation properties. Differentiation 31: 42–49. [DOI] [PubMed] [Google Scholar]
- 19.Tchoukalova Y.D., Koutsari C., Karpyak M.V., Votruba S.B., Wendland E., Jensen M.D. 2008. Subcutaneous adipocyte size and body fat distribution. Am. J. Clin. Nutr. 87: 56–63. [DOI] [PubMed] [Google Scholar]
- 20.Tchoukalova Y.D., Koutsari C., Votruba S.B., Tchkonia T., Giorgadze N., Thomou T., Kirkland J.L., Jensen M.D. 2010. Sex- and depot-dependent differences in adipogenesis in normal-weight humans. Obesity (Silver Spring) 18: 1875–1880. [DOI] [PMC free article] [PubMed] [Google Scholar]
- 21.Violini S., Ramelli P., Pisani L.F., Gorni C., Mariani P. 2009. Horse bone marrow mesenchymal stem cells express embryo stem cell markers and show the ability for tenogenic differentiation by in vitro exposure to BMP-12. BMC Cell Biol. 10: 29. [DOI] [PMC free article] [PubMed] [Google Scholar]
- 22.Wei S., Du M., Jiang Z., Duarte M.S., Fernyhough-Culver M., Albrecht E., Will K., Zan L., Hausman G.J., Elabd E.M., Bergen W.G., Basu U., Dodson M.V. 2013. Bovine dedifferentiated adipose tissue (DFAT) cells: DFAT cell isolation. Adipocyte 2: 148–159. [DOI] [PMC free article] [PubMed] [Google Scholar]
- 23.Yagi K., Kondo D., Okazaki Y., Kano K. 2004. A novel preadipocyte cell line established from mouse adult mature adipocytes. Biochem. Biophys. Res. Commun. 321: 967–974. [DOI] [PubMed] [Google Scholar]


