Abstract
Clinical magnetic resonance imaging of multiple sclerosis (MS) has focused on indirect imaging of myelin in white matter by detecting signal from protons in the water associated with myelin. Here we show that protons in myelin can be directly imaged using ultrashort echo time (UTE) free induction decay (FID) and imaging sequences on a clinical 3T MR scanner. An adiabatic inversion recovery UTE (IR-UTE) sequence was used to detect signal from myelin and simultaneously suppress signal from water protons. Validation studies were performed on myelin lipid and myelin basic protein (MBP) phantoms in the forms of lyophilized powders as well as suspensions in D2O and H2O. IR-UTE sequences were then used to image MS brain specimens, healthy volunteers, and patients. The T2* of myelin was measured using a UTE FID sequence, as well as UTE and IR- UTE sequences at different TEs. T2* values of ~110–330 μs were measured with UTE FID, as well as with UTE and IR-UTE sequences for myelin powders, myelin-D2O and myelin-H2O phantoms, consistent with selective imaging of myelin protons with IR-UTE sequences. Our studies showed myelin selective imaging of white matter in the brains in vitro and in vivo. Complete or partial signal loss was observed in specimens in areas of the brain with histopathologic evidence of myelin loss, and in the brain of patients with MS.
Keywords: myelin, myelin lipid, myelin basic protein, UTE, MRI
Graphical abstract
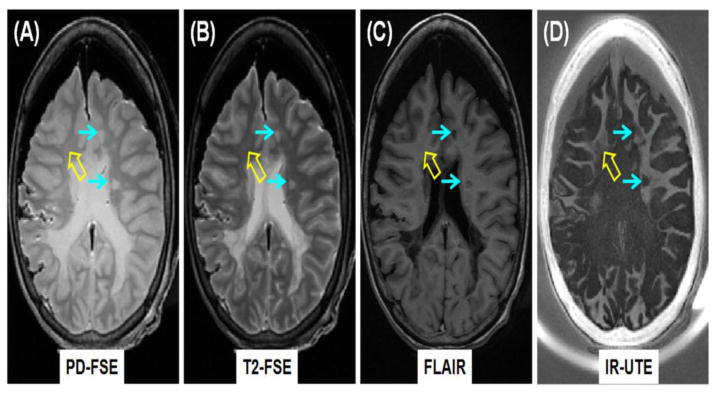
Clinical PD-FSE (A), T2-FSE (B) and FLAIR (C) imaging as well as IR-UTE (D) imaging of a brain specimen from a 28 year old female donor with confirmed MS. MS lesions are hyperintense (thin arrows, A, B) on the PD-FSE and T2-FSE images, and hypointense (thin arrows, C) on the FLAIR image, and show signal loss on the IR-UTE image (thin arrows, D). Complete myelin loss is obvious in regions indicated by the thin arrows. Partial loss of signal is seen in the IR-UTE image (thick arrow, D) where the PD-FSE, T2-FSE and FLAIR images appear normal (thick arrows, A–C).
Introduction
Multiple sclerosis (MS) is a demyelinating disease which mainly affects the central nervous system (CNS) (Noseworthy et al., 2006). Early diagnosis and treatment can lead to improved symptom management and reduce future disability. Magnetic resonance imaging (MRI) was first utilized for imaging of MS in 1981 (Young et al., 1981), and since that time has been widely used for noninvasive evaluation of the disease (McDonald et al., 2001). MS is a disease that relatively specifically targets myelin, a lamellar tissue which contains alternating protein and lipid layers (van der Knaap et al., 2005). It has a very short T2* and is not directly detected with conventional clinical MR sequences. A common strategy is to employ conventional T2-weighted fast spin echo (FSE) and T1-weighted gradient recalled echo (GRE) or SE sequences to detect the effects of increased T2s and T1s in the longer T2 components of white matter that are seen in MS lesions. Although these sequences show focal macroscopic tissue abnormalities in the brains of patients with MS, they are not specific with respect to the pathologic substrate of the MS lesion (Filippi et al., 2011).
Evaluation of the integrity of myelin in white matter may be important for the diagnosis and assessment of prognosis in MS. Advanced imaging sequences such as myelin water imaging and magnetization transfer MRI have been used to indirectly assess myelin (Alonso-Oriz et al., 2015), however there is a lack of a robust biomarker for demyelination and remyelination in MS patients (Munzel et al., 2013). It would therefore be a significant achievement to develop and validate an MRI technique for direct imaging of conventionally MR “invisible” myelin and use this to evaluate damage and repair to myelin in vivo.
Recent studies using high performance NMR spectrometers indicate that the protons in myelin have T2*s in the range of 50 μs to a few hundred microseconds (Horch et al., 2011; Wilhelm et al., 2012). We have developed ultrashort echo time (UTE) sequences with a minimum nominal TE of 8 μs that is 100–1000 times shorter than the TEs of most conventional clinical sequences. The UTE sequences can directly detect signals from tissues with ultrashort T2*s (e.g., cortical bone) using clinical MR scanners (Du et al., 2010).
A major challenge in direct imaging of myelin with such sequences is the concurrent detection of high signal from longer T2 protons in water within white matter (WML) and gray matter (GML). The signal from these components may be ten or more times greater than that detected from the short T2 components in myelin itself with a short T1 of ~226 ms (Du et al., 2014) and low relative proton density of ~4% (Du et al., 2013b), making it difficult to distinctly demonstrate them. Adiabatic inversion recovery (IR) pulses have been used to provide robust and uniform suppression of signals from WML, allowing selective imaging of the ultrashort T2* components in white matter of the brain (Du et al., 2013; Waldman et al., 2003).
In this study we first evaluated UTE and IR-UTE sequences for direct imaging and quantitative T2* characterization of myelin lipid and myelin basic protein (MBP), two major components of myelin, using a whole-body clinical 3T MR scanner. We then investigated IR-UTE imaging of myelin in human brain specimens from donors with MS (with histopathology correlation), and conducted studies in healthy volunteers, and patients with MS.
Materials and Methods
Pulse Sequences
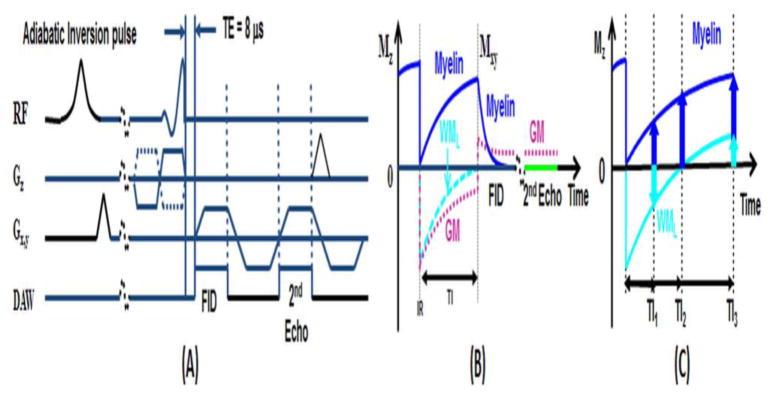
A 2D UTE sequence (Figure 1) was implemented on a 3T Signa TwinSpeed Scanner (GE Healthcare, Milwaukee, WI). The sequence employs a half pulse radiofrequency (RF) excitation (pulse duration = 472 μs, bandwidth ~ 2.7 kHz) with peak RF power deposition during the ramp down of the slice selection gradient (Du et al., 2010; Robson et al., 2003). The sequence was further modified by replacing the slice-selective half pulse with a short rectangular pulse (pulse duration = 32 μs, bandwidth ~ 30 kHz) for non-slice selective UTE imaging, and by setting all the imaging gradients to zero for UTE FID data collection.
Figure 1.
Pulse sequence for 2D UTE imaging using half pulse excitation and radial ramp sampling with a minimal nominal TE of 8 μs (A). An adiabatic IR preparation pulse together with dual echo acquisition was used to create short T2 contrast (B). The adiabatic IR pulse provides robust inversion of the longitudinal magnetizations of gray matter (GM) and the long T2 components in white matter (WML). Myelin has ultrashort T2* and experience significant transverse relaxation during the long adiabatic inversion process, and is not inverted but saturated. UTE acquisition starts when the inverted longitudinal magnetization of WML reaches the null point, leaving signals from myelin and residual GM to be detected by the FID acquisition. The 2nd echo contains signal from GM, with near zero signal from myelin due to its ultrashort T2*. Subtraction of the 2nd echo from the FID provides selective imaging of myelin. However, myelin contrast highly depends on TI (C): when TI is too short, WML has negative magnetization leading to myelin signal cancellation; when TI is too long, WML has positive magnetization leading to myelin signal overestimation. The correct TI can be calculated based on measured T1 of WML and TR.
Myelin only represents a small fraction of the total MR signal detectable from the brain. Larger signals come from the longer T2 components WML and GML. We employed an IR-UTE sequence to invert and null the longitudinal magnetization of WML (Figure 1b). The 2nd echo image acquired signals from the residual longer T2 tissue components. Subtraction of signal from the 2nd echo image from that of the first provided selective imaging of myelin. The optimal TI can be calculated based on the measured T1 of WML. We used IR-UTE images acquired at a series of TEs to selectively image and quantify T2*s based on a single exponential decay model as shown in Eq. [1],
| [1] |
where S(TE) is the myelin signal with noise corrected using the Miller approach (Miller et al., 1993):
| [2] |
where <M(TE)2> is the measured signal, and σ is the background noise calculated as the standard deviation of signal from a region of interest (ROI) drawn in air away from streaks.
Tissue Phantoms
Three groups of tissue phantoms were prepared for this study. These each contained one of (i) biologically derived bovine myelin lipid phantom (type-I bovine brain extract obtained from Signa-Aldrich Corp, St. Louis MO). This is an organophilic extract of predominantly myelin-related brain lipids (Folch et al., 1942); (ii) synthetic myelin lipid formulated to approximate the non-protein portion of biological myelin including cholesterol, galactocerebroside, phosphatidylcholine and sphingomyelin (all lipids from Sigma-Aldrich Corp); and (iii) 90% purified (SDS-PAGE) bovine MBP obtained from Sigma-Aldrich Corp. We first ran regular UTE imaging of the bovine myelin lipid and bovine myelin basic protein in lyophilized powder form, to investigate direct imaging of myelin lipid of different types, and MBP using a clinical 3T scanner. The bovine myelin lipid, bovine myelin basic protein, and synthetic myelin powders were then each combined with deionised D2O or deionised H2O respectively, to form six suspensions with a solid-liquid mass ratio of 3:2, the expected value in physiological myelin. The phantoms were then subject to UTE and IR-UTE imaging as well as T2* measurements. A custom-made solenoid coil (5 mm in diameter) was used for signal excitation and reception.
Before UTE and IR-UTE imaging experiments, the effects of excitation pulses were investigated on purified bovine myelin extract powder and paste phantoms by acquiring UTE FID data with the short rectangular pulse and the longer half pulse, respectively. Since a low but non-zero signal was observed with the coil itself, UTE FID of each myelin phantom was subtracted from that of the coil. The following parameters were used: sampling bandwidth (BW) = 125 kHz, 4096 sampling points, 100 averages, flip angle = 10°, TR = 1000 ms, total scan time = 100 sec.
Slice selective half pulses were used for all the UTE and IR-UTE imaging experiments with the following parameters: field of view (FOV) = 4 cm, slice thickness = 3 mm, BW = 62.5 kHz, flip angle = 60°, reconstruction matrix = 128×128, number of projections = 403. For T2* measurements, a TR of 1000 ms and 12 TEs ranging of 8 μs, 0.1, 0.2, 0.3, 0.4, 0.6, 0.8, 1.0, 1.2, 1.6, 2.0 and 2.5 ms were used. The TI for use with the IR-UTE sequence was determined for each tissue phantom from measurement of the T1 of the longer T2 component (when it was present) using clinical IR-FSE sequences. Standard clinical sequences, including T1-weighted FSE and GRE sequences were performed for comparison. A rubber eraser, which was used as a T2* calibration phantom in the in vivo study (details shown below), was also imaged with the above protocol for T2* quantification.
Brain Specimens
Five post-mortem brains from MS patient donors (2 male, 3 female, ages 28–71) were acquired from University of California, San Diego (UCSD) anatomical services within 24 hours of death. Brains were refrigerated (4 °C) until scanning. They were allowed to warm up to room temperature for two hours. An eight-channel head coil was used for signal reception. The following imaging parameters were used: FOV = 24 cm, slice thickness = 5 mm, BW = 256 kHz, flip angle = 60°, reconstruction matrix = 256×256, number of projections = 131, sampling points per projection = 192, TR = 1500 ms, dual echo with TEs of 8 μs and 2.2 ms, scan time = 6.5 min. For T2* measurements, four sets of dual echo UTE acquisitions (TE = 0.008/2.2 ms; 0.2/2.2 ms; 0.6/2.2 ms; 1.5/4.4 ms) were acquired during a total scan time of 26 min. Clinical T1- and T2-weighted FSE sequences, T2-FLAIR and MP-RAGE sequences were also performed for comparison. Brains were returned to anatomical services for routine whole brain fixation within 48 hours of the end of scanning and further refrigeration. After fixation, the brains were sectioned to sample specific brain regions corresponding with the regions visualized on the MR images.
Histopathology
Following MRI in the unfixed condition, specimens were flotation-immersed in 10% buffered formalin and kept at room temperature for ~six months. The postmortem interval before fixation was less than 48 hours. Tissue blocks (~1.5×1.5×1 cm3) containing regions of interests (ROIs) detected on MRI were dissected. Approximately four regions per brain and four formalin fixed paraffin embedded (FFPE) blocks per region were prepared. The blocks were then sectioned at 5 μm thickness for histochemical and immunohistochemical (IHC) staining (Ferguson et al., 1997). This included Hematoxylin and Eosin (H&E), Luxol Fast blue (LFB), CD68, myelin basic protein, GFAP and vimentinto staining to assess the state of myelination, the relative numbers of oligodendrocytes, reactive astrocytes, axons, microglia and macrophages.
In Vivo Study
Ten healthy volunteers (all male, ages 27–70) and ten MS patients (6 women and 4 men, ages 29–71) were recruited for this study, which was reviewed and approved by the Institutional Review Board (IRB) of UCSD before it began. Written informed consent approved by the IRB was obtained prior to the participation of each subject. The MRI protocol was similar to that used in the brain specimen study. T2* measurements were only performed on healthy volunteers due to the long scan time. An eraser was placed near the head for T2* calibration. The rubber eraser was also imaged with a non-slice selective 2D UTE sequence. This employed a short rectangular pulse (duration = 32 μs) for signal excitation, thus eliminating errors due to the eddy currents associated with conventional half-pulse excitation. This was done in order to improve the accuracy of measurements of T2* of the eraser.
Data Analysis
Quantitative evaluation of T2* was performed on each phantom, specimen and human subject. T2* values were obtained using a Levenberg-Marquardt fitting algorithm based on equation [1]. To minimize fitting error, UTE data were truncated so that only those with signal above the noise floor were used for T2* estimation (He et al., 2008). The analysis algorithm was written in Matlab (The Mathworks Inc. Natick, MA, USA), and executed offline on the magnitude UTE FID data or DICOM images obtained using the protocols described above. After fitting was finished, goodness of fit statistics, including the R-squared value, mean squared error, root mean squared error and standard error were calculated. Contrast to noise ratio (CNR) measurements were performed to evaluate the different imaging techniques. The CNR between MS lesions and surrounding normal appearing white matter (NAWM) was calculated as their signal difference divided by background noise. This is the standard deviation calculated from placing multiple ROIs in different regions. The ROIs were arbitrarily selected in regions of NAWM for in vivo studies of healthy volunteers and MS patients.
Results
Signal validation in UTE and IR-UTE imaging of the myelin phantoms
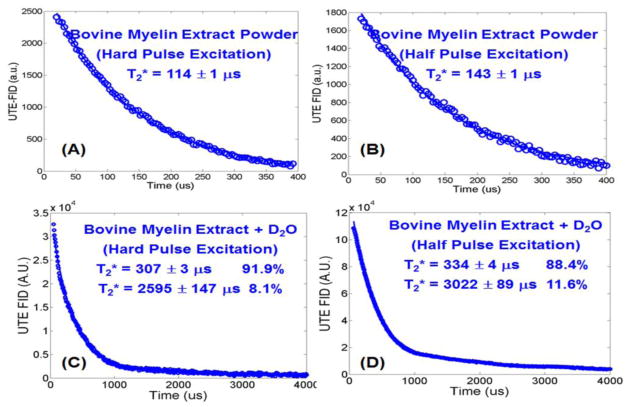
The subtracted UTE FIDs of bovine myelin extract in the forms of powder and D2O paste are displayed in Figure 2 to show the effects of RF pulse shape and bandwidth on myelin proton excitation. Excellent single component decays were observed with the bovine myelin extract powder with a short T2* of 114±1 μs when a short rectangular pulse excitation was used, and a short T2* of 143±1 μs when a half pulse excitation was used. The longer T2* observed with the half pulse excitation may have been due to its narrower excitation bandwidth, and thus lower efficiency in exciting the shorter T2* pools of myelin protons. When suspended in D2O, two components were observed (R2 = 0.9981 for bi-component fitting and 0.9575 for single-component fitting) in the subtracted UTE FIDs with significantly increased short T2* values of 307±3 μs for hard pulse excitation and 334±4 μs for half pulse excitation. The longer T2* components had T2* values of 2595 μs for hard pulse excitation and 3022 μs for half pulse excitation. They may have been due to H2O contamination in the D2O solution. Compared to the myelin powder, the myelin-D2O suspensions showed longer T2*s probably due to a reduction in susceptibility effects as well as an increase in proton mobility.
Figure 2.
UTE FID of bovine myelin extract powder with a short rectangular hard pulse excitation (duration = 32 μs) and a half pulse excitation (duration = 472 μs), and UTE FID of bovine myelin extract paste (powder suspended in D2O) with a short hard pulse excitation (C) and half pulse excitation (D). The powder shows single-component signal decay with a T2* of 114±1 μs when excited with the short rectangular pulse (A), or a T2* of 143±1 μs when excited with the half pulse (B). The paste shows bi-component signal decay with a short T2* of 307±3 μs and a longer T2* of 2595 ± 147 μs, as well as a short T2* fraction of 91.9% and longer T2* fraction of 8.1% when excited with the hard pulse (C), and a short T2* of 334±4 μs and a longer T2* of 3022±89 μs, as well as a short T2* fraction of 88.4% and longer T2* fraction of 11.6% when excited with the half pulse (D).
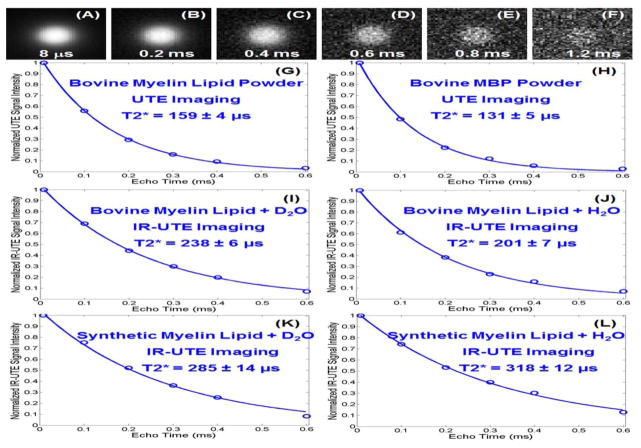
Figure 3 shows selected UTE images of bovine myelin lipid powder at different TEs obtained with the 3T clinical MR system. IR-UTE images showed a similar pattern. High signal was seen from the bovine myelin lipid as well as synthetic myelin lipid and MBP. Conventional FSE or GRE sequences did not detect signal from the myelin lipid or MBP powder samples. Using regular UTE sequences the bovine myelin lipid powder had an ultrashort T2* of 159±4 μs, while the MBP powder had an even shorter T2* of 131±5 μs. When suspended in D2O, the bovine myelin lipid showed an ultrashort T2* of 238±6 μs when determined with the IR-UTE sequence. When suspended in H2O, the bovine myelin lipid showed a short T2* of 201±7 μs when measured using the IR-UTE sequence. Similar results were observed for the synthetic myelin lipid and MBP phantoms. The similar short T2* values for myelin powders, myelin-D2O suspensions, and myelin-H2O suspensions measured with IR-UTE imaging suggested that the signal from water protons was effectively suppressed by the IR-UTE sequence, thus allowing selective imaging of protons in myelin lipid and MBP.
Figure 3.
UTE imaging of bovine myelin lipid powder with TEs of 8 μs (A), 0.2 (B), 0.4 (C), 0.6 (D), 0.8 (E) and 1.2 ms (F). The powder shows excellent single-component signal decay with a T2* of 159±4 μs (G). Bovine MBP also shows a high signal with a short T2* of 131±5 μs (H). IR-UTE (TR/TI = 300/110 ms) imaging shows a short T2* of 238±6 μs for the bovine myelin lipid-D2O paste (I), 201±7 μs for the bovine myelin lipid-H2O paste (J), 285±14 μs for the synthetic myelin lipid-D2O paste (K), and 318±12 μs for the synthetic myelin lipid-H2O paste (L).
IR-UTE imaging in MS brain specimens
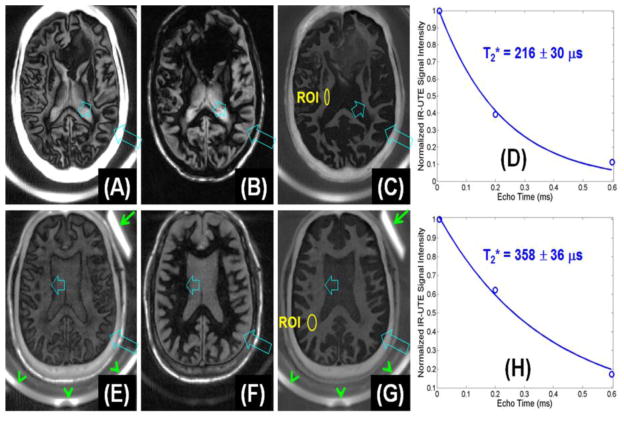
Figure 4A–D shows IR-UTE imaging of a cadaveric MS brain specimen from a 64 year old female donor as well as T2* measurements. IR-UTE signal of normal appearing white matter (NAWM) decayed to near zero with a TE of 0.6 ms, suggesting extremely fast signal decay. Single component fitting shows that intact areas of white matter had a short T2* of 216±30 μs, which was comparable to that of purified bovine MBP and myelin lipid, suggesting that myelin was being directly imaged.
Figure 4.
IR-UTE imaging of the brain from a 64 year old female donor (TR/TI = 1500/410 ms) with confirmed MS with TEs of 8 μs (A), 2.2 ms (B) and subtraction image (C). Single-component fitting (D) shows a T2* of 216±30 μs for an ROI drawn in the NAWM shown in (C). IR-UTE imaging of a 60 year old male volunteer (TR/TI = 1500/412 ms) with TEs of 8 μs (E), 2.2 ms (F) and subtraction image (G). Single-component fitting (H) shows a T2* of 358±36 μs for an ROI drawn in the NAWM shown in (G).
Figure 5 shows representative clinical and IR-UTE images of the brain from a 28 year old female donor with confirmed MS. Areas of NAWM appear high signal on the IR-UTE subtracted images, and areas of abnormality appear low signal. Some lesions seen on the IR-UTE images correspond to T2 hyperintense areas on conventional T2-weighted images and hypointense areas on FLAIR images, but the abnormalities seen on the IR-UTE images extended into the adjacent areas of NAWM seen with the conventional images. The IR-UTE sequence showed areas of abnormality in locations that appeared normal with conventional T2-weighted and FLAIR images.
Figure 5.
Clinical PD-FSE (A), T2-FSE (B) and FLAIR (C) imaging as well as IR-UTE (TR/TI = 1500/410 ms) (D) imaging of a brain specimen from a 28 year old female donor with confirmed MS. MS lesions are hyperintense (thin arrows, A, B) on the PD-FSE and T2-FSE images, and hypointense (thin arrows, C) on the FLAIR image, and show signal loss on the IR-UTE image (thin arrows, D). Complete myelin loss is obvious in regions indicated by the thin arrows. Partial loss of signal is seen in the IR-UTE image (thick arrow, D) where the PD-FSE, T2-FSE and FLAIR images appear normal (thick arrows, A–C).
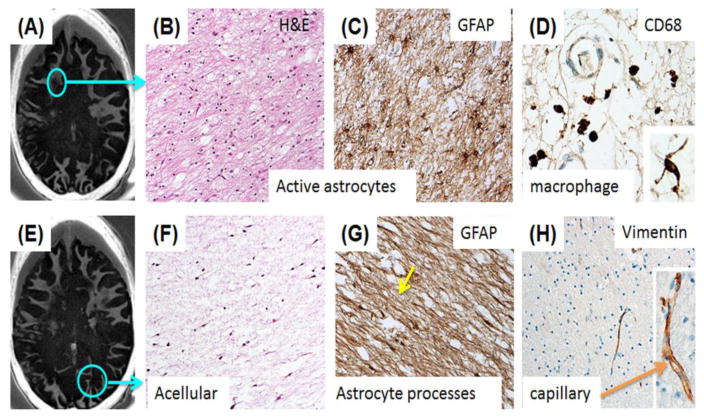
Routine whole brain fixation in 10% neutral buffered formalin after the MRI examination was adequate for histopathologic analysis with H&E and IHC staining of GFAP protein to highlight reactive astrogliosis, CD-68 to label mononuclear and microglial cells, and vimentin to assess overall tissue epitope preservation. General and IHC staining of abnormal appearing white matter from a cadaveric MS brain specimen showed myelin loss in an area of frontal periventricular and subcortical white matter (Figure 6A–D). A subacute demyelinating lesion showed marked disruption of normal histology with numerous reactive astrocytes in this area. GFAP IHC of the same region demonstrated reactive, markedly hypertrophic astrocytosis and CD-68 demonstrated perivascular macrophages. Another selected slice from the IR-UTE imaging of the cadaveric MS brain specimen showed myelin loss in an area within the occipital lobe (Figure 6E–H). H&E staining of this region demonstrated a large chronic demyelinating lesion.
Figure 6.
A selected slice from IR-UTE imaging of a cadaveric MS brain specimen shows loss of signal within the circled area (A); Histology of frontal subcortical WM from the subacute demyelinating lesion shown in the circle displays marked disruption of the normal histology with numerous reactive astrocytes (H&E) (B); GFAP IHC of the same region demonstrates the reactive, markedly hypertrophic astrocytosis (C); CD-68 staining demonstrates small numbers of perivascular macrophages in the same region as (B) and (C). Rare microglial cells are present in the acellular astroglial scar of the large, chronic demyelinated lesion in the occipital lobe (D, Inset); Another slice from IR-UTE imaging of the same MS brain specimen (E). This shows similar extensive myelin loss (F); A large chronic demylinated lesion in the occipital lobe of the same patient (circle, E) demonstrates the typical paucicellular astroglial scar with H&E staining (F); GFAP immunoreactivity shows the dense astrogial processes that have replaced normal structures in this demyelinated lesion (G); Vimentin immunoreactivity in the microvasculature of the both of the sampled brain regions demonstrates preservation of an epitope that is sensitive to fixation/processing (H). Higher magnification shows the delicate capillary labeling (H, Inset).
IR-UTE imaging in healthy volunteers and MS patients
IR-UTE imaging of a 60 year old healthy volunteer as well as T2* measurements were also shown in Figure 4E–H. Exponential signal decay fitting gave a T2* of 358±36 μs for myelin, which was comparable to that of myelin lipid or MBP suspension, suggesting that myelin was being directly imaged. Rubber and coil are only visible with a TE of 8 μs. Non-slice selective 2D UTE imaging showed that the rubber eraser had a T2* of 340±20 μs. In vivo IR-UTE imaging showed a T2* value of 370±90 μs for the rubber eraser, confirming the general accuracy of ultrashort T2* measurement in vivo (with 9% overestimation in this case).
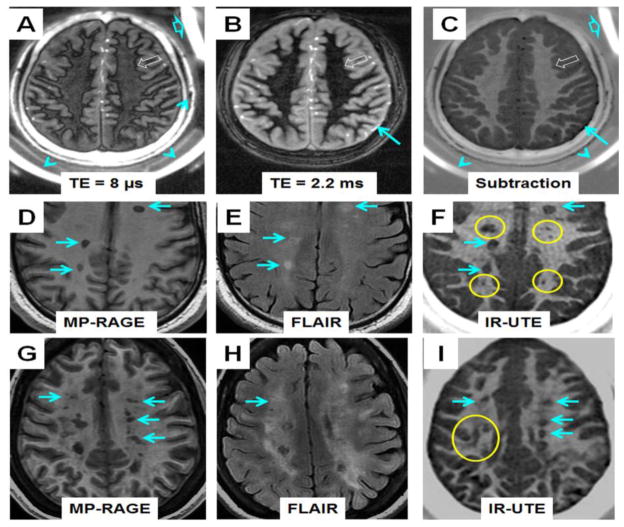
Figure 7 shows representative IR-UTE imaging of a 34 year old healthy volunteer as well as IR-UTE and clinical MR imaging of two MS patients: a 29 year old male MS patient and a 43 year old female MS patient. Intact myelin was observed in the normal volunteer while myelin loss was observed in MS patients. Lesions seen with the FLAIR and/or MP-RAGE sequences were also identified with high contrast with the IR-UTE sequence (e.g., regions shown by blue arrows, where a CNR of 37.1 ± 1.5, 15.9 ± 0.7, and 20.5 ± 0.9 were measured for the FLAIR, MP-RAGE and IR-UTE images, respectively). Lesions less visible with MP-RAGE and/or T2-FLAIR sequences were more clearly seen with the IR-UTE sequence (e.g., regions marked with yellow circles, where a CNR of 3.1 ± 0.2, 5.2 ± 0.3, and 16.8 ± 1.1 were measured for the FLAIR, MP-RAGE and IR-UTE images, respectively).
Figure 7.
Dual echo IR-UTE imaging of a 34 year old healthy volunteer (TR/TI = 1500/420 ms) with a TE of 8 μs (A) and 2.2 ms (B). The subtraction image (C) shows intact myelin in white matter of normal brain. Also shown are images of a 29 year old male MS patient using clinical MP-RAGE (D), FLAIR (E) and IR-UTE (TR/TI = 1500/420 ms) (F) sequences, as well as images of a 43 year old female MS patient using clinical MP-RAGE (G), FLAIR (H) and IR-UTE (TR/TI = 1500/418 ms) (I) sequences. “Black hole” lesions (arrows) visible on MP-RAGE and T2-FLAIR images are clearly visible on IR-UTE images. Several lesions clearly visible on IR- UTE images are invisible or less visible on MP-RAGE and T2-FLAIR images (circles). UTE lesions were confirmed after examining neighboring slices to eliminate the possibility of misdiagnosis due to partial volume effects between GM and WM.
Discussion
In this study we demonstrated for the first time that myelin lipid and MBP, is detectable and can be imaged with UTE and IR-UTE sequences using a clinical whole-body scanner. Myelin in white matter of the brain can be selectively imaged with the IR-UTE sequence, when an adiabatic inversion pulse is used to invert and null the higher signal from the longer T2 components in water within white matter. The residual longer T2 signal from GML was suppressed via dual echo acquisition and echo subtraction. Myelin water is a potential contaminator since a variety of recent studies have demonstrated that myelin water has a relative short T2 (~10–50 ms) (Lancaster et al., 2003; MacKay et al., 2006) and T2* (~3–10 ms) (Hwang et al., 2010; Oh et al., 2012) when compared to the longer T2 components in white matter. A similar challenge has been seen in cortical bone where there are two water compartments including the collagen-bound water with a short T2* close to that of myelin protons, and pore water with T2*s slightly shorter than that of myelin water (Du et al., 2013a). Our recent studies suggest that the pore water component can be inverted and nulled by the adiabatic inversion pulse, while the collagen-bound water component can be selectively imaged with the IR-UTE sequence (Du et al., 2013a). Therefore, it is reasonable to hypothesize that myelin water which has a T2* close to or slightly longer than that of pore water in cortical bone will also be significantly suppressed by the adiabatic inversion pulse. As a result, signals from myelin appear high with the IR-UTE sequence after efficient suppression of signals from myelin water, intra/extra axonal water and interstitial water via use of the adiabatic inversion pulse.
The histopathological study of the MS brain specimens confirmed that IR-UTE imaging of white matter was able to detect demyelination in MS lesions. Some of these lesions were also visible with conventional imaging (e.g., thin arrows in Figure 5) but some areas of abnormal white matter on IR-UTE imaging appear normal on T2 and T1-weighted images (e.g. thick arrow in Figure 5). Complete or partial loss of myelin is clearly visible. In regions with lesions identifiable on clinical T2-FLAIR or MP-RAGE images, myelin signal dropped to the background noise level suggesting complete myelin loss (thin arrows in Figures 5–7). On traditional MR images these MS lesions appear as T2 hyperintensity or T1 hypointensity. Increased T2 lesions are seen with a variety of pathological features including inflammation and demyelination, as well as active and inactive lesions. Similarly, hypointensity on T1-weighted image may represent myelin or axonal loss, but it can also be non-specific and related to edema. Neither has been shown to correlate with clinical disease status or prognosis (Filippi et al., 2011). The IR-UTE sequence is able to identify the presence of demyelination. In some regions with invisible lesions on clinical FLAIR or MP-RAGE images, an obvious signal decrease was observed with IR-UTE sequences (thick arrow in Figure 5). As a result, the IR-UTE sequence may provide more specific information in evaluating clinical disease status or prognosis.
There are several potential technical problems with the IR-UTE approach. First, there is no absolute evidence showing the contribution to IR-UTE signal is only from myelin in the in vitro and in vivo brain studies. The high signal from purified bovine myelin extract shows that UTE sequences can detect signal from myelin (both lipid and MBP) on clinical scanners. However, imperfect suppression of WML may result in signal contamination, reducing the selectivity of the myelin imaging. Signals from other macromolecules or structures may also contribute to the IR-UTE image. And the short T2 myelin signal will be partly suppressed by the adiabatic inversion pulse (Larson et al., 2007). Second, other techniques such as long T2 saturation UTE (Larson et al., 2006) have been proposed for direct imaging of myelin, but are not investigated in this study. Further studies are needed to compare their efficiency in suppressing WML and preserving signal from myelin. Third, we used 2D UTE sequences for myelin imaging. Partial volume artifact is a potential source of error with this approach. We confirmed all UTE lesions by examining neighboring slices to eliminate misclassification due to partial volume effects. Fourth, myelin in GM is not being investigated in this study. It is more challenging to image myelin in this tissue compared to white matter due to the lower density of ultrashort T2 protons within it. Fifth, the T2* times reported for myelin lipids and MBP in our study are about three times longer than the shortest T2*s in the spectrum reported by Horch et al (Horch et al., 2011) and Wilhem et al (Wilhem et al., 2012). There may be several reasons for this. Our aqueous myelin phantoms presumably form lipid bilayers where the dipolar interactions will scale the line shape resulting in a superlorentzian shape (Wennerstrom, 1973). Fitting with exponentials may result in overestimating the T2*. In addition our field strength of 3T is lower than the systems used by Horch et al at 4.7T and Willhelm et al at 9.4T. Shorter T2* values are expected at higher field strength. The low SNR, small number of TEs and high sensitivity to noise may also lead to errors in T2* quantification. Sixth, the number of MS brain specimens and patients is relatively small, allowing the feasibility to be demonstrated, but limiting the clinical significance of the study. The patterns of myelin loss, as well as changes in T1 (Du et al., 2014), T2* and myelin density in different clinical types of MS (e.g., relapsing-remitting MS, primary-progressive MS, secondary-progressive MS) remain to be investigated.
Conclusion
Our results suggest that the protons in myelin can be directly imaged using UTE and IR-UTE sequences. Partial and complete loss of myelin can be directly detected with the IR-UTE sequence. The IR-UTE sequence allows selective imaging of myelin in vitro and vivo, providing a new tool to evaluate demyelination and remyelination in MS patients.
Acknowledgments
Funding
The authors acknowledge grant support from the NIH (1R01 NS092650). VS was supported by the UCSD Clinician Scientist Program and NIBIB T32-EB005970.
Footnotes
Publisher's Disclaimer: This is a PDF file of an unedited manuscript that has been accepted for publication. As a service to our customers we are providing this early version of the manuscript. The manuscript will undergo copyediting, typesetting, and review of the resulting proof before it is published in its final citable form. Please note that during the production process errors may be discovered which could affect the content, and all legal disclaimers that apply to the journal pertain.
References
- 1.Alonso-Ortiz E, Levesque IR, Pike GB. MRI-based myelin water imaging: a technical review. Magn Reson Med. 2015;73:70–81. doi: 10.1002/mrm.25198. [DOI] [PubMed] [Google Scholar]
- 2.Du J, Carl M, Bydder M, Takahashi A, Chung CB, Bydder GM. Qualitative and quantitative ultrashort echo time (UTE) imaging of cortical bone. J Magn Reson. 2010;207:304–311. doi: 10.1016/j.jmr.2010.09.013. [DOI] [PubMed] [Google Scholar]
- 3.Du J, Hermida JC, Diaz E, Corbeil J, Znamirowski R, D’Lima DD, et al. Assessment of cortical bone with clinical and ultrashort echo time sequences. Magn Reson Med. 2013;70:697–704. doi: 10.1002/mrm.24497. [DOI] [PubMed] [Google Scholar]
- 4.Du J, Ma G, Li S, Carl M, Szeverenyi NM, VandenBerg S, et al. Ultrashort TE echo time (UTE) magnetic resonance imaging of the short T2 components in white matter of the brain using a clinical 3T scanner. NeuroImage. 2013;87:32–41. doi: 10.1016/j.neuroimage.2013.10.053. [DOI] [PMC free article] [PubMed] [Google Scholar]
- 5.Du J, Sheth V, Qun H, Carl M, Chen J, Corey-Bloom J, Bydder GM. Measurement of T1 of the ultrashort T2* components in white matter of the brain at 3T. PLoS ONE. 9(8):e103296. doi: 10.1371/journal.pone.0103296. [DOI] [PMC free article] [PubMed] [Google Scholar]
- 6.Ferguson B, Matyszak MK, Esiri MM, Perry VH. Axonal damage in acute multiple sclerosis lesions. Brain. 1997;120:393–399. doi: 10.1093/brain/120.3.393. [DOI] [PubMed] [Google Scholar]
- 7.Filippi M, Rocca MA. MR imaging of multiple sclerosis. Radiology. 2011;259:659–681. doi: 10.1148/radiol.11101362. [DOI] [PubMed] [Google Scholar]
- 8.Folch J. Brain cephalin, a mixture of phosphatides. Separation from IT of phosphatidyl serine, phosphatidyl ethanolamine, and a fraction containing an inositol phosphatide. J Biol Chem. 1942;146:35–44. [Google Scholar]
- 9.He T, Gatehouse PD, Smith GC, Mohiaddin RH, Pennell DJ, Firmin DN. Myocardial T2* measurements in iron overload thalassemia: an in vivo study to investigate the optimal methods of quantification. Magn Reson Med. 2008;60:1082–1089. doi: 10.1002/mrm.21744. [DOI] [PMC free article] [PubMed] [Google Scholar]
- 10.Horch RA, Gore JC, Does MD. Origins of the ultrashort T2 1H NMR signals in myelinated nerve: a direct measure of myelin content? Magn Reson Med. 2011;66:24–31. doi: 10.1002/mrm.22980. [DOI] [PMC free article] [PubMed] [Google Scholar]
- 11.Hwang D, Kim DH, Du YP. In vivo multi-slice mapping of myelin water content using T2* decay. NeuroImage. 2010;52:198–204. doi: 10.1016/j.neuroimage.2010.04.023. [DOI] [PubMed] [Google Scholar]
- 12.Munzel EJ, Williams A. Promoting remyelination in multiple sclerosis – recent advances. Drugs. 2013;73:2017–2029. doi: 10.1007/s40265-013-0146-8. [DOI] [PMC free article] [PubMed] [Google Scholar]
- 13.Lancaster JL, Andrews T, Hardies LJ, Dodd S, Fox PT. Three-pool model of white matter. J Magn Reson Imaging. 2003;17:1–10. doi: 10.1002/jmri.10230. [DOI] [PubMed] [Google Scholar]
- 14.Larson PE, Conolly SM, Pauly JM, Nishimura DG. Using adiabatic inversion pulses for long-T2 suppression in ultrashort echo time (UTE) imaging. Magn Reson Med. 2007;58:952–961. doi: 10.1002/mrm.21341. [DOI] [PMC free article] [PubMed] [Google Scholar]
- 15.Larson PE, Gurney PT, Nayak K, Gold GE, Pauly JM, Nishimura DG. Designing long-T2 suppression pulses for ultrashort echo time imaging. Magn Reson Med. 2006;56:94–103. doi: 10.1002/mrm.20926. [DOI] [PMC free article] [PubMed] [Google Scholar]
- 16.MacKay A, Laule C, Vavasour I, Bjarnason T, Kolind S, Madler B. Insights into brain microstructure from the T2 distribution. Magn Reson Imaging. 2006;24:515–525. doi: 10.1016/j.mri.2005.12.037. [DOI] [PubMed] [Google Scholar]
- 17.McDonald WI, Compston A, Edan G, Goodkin D, Hartung HP, Lublin FD, et al. Recommended diagnostic criteria for multiple sclerosis: guidelines from the International Panel on the diagnosis of multiple sclerosis. Ann Neurol. 2001;50:121–127. doi: 10.1002/ana.1032. [DOI] [PubMed] [Google Scholar]
- 18.Miller AJ, Joseph PM. The use of power images to perform quantitative analysis of low SNR MR images. Magn Reson Imaging. 1993;11:1051–1056. doi: 10.1016/0730-725x(93)90225-3. [DOI] [PubMed] [Google Scholar]
- 19.Miller DH, Barkhof F, Nauta JJP. Gadolinium enhancement increases the sensitivity of MR in detecting disease activity in multiple sclerosis. Brain. 1993;116:1077–1094. doi: 10.1093/brain/116.5.1077. [DOI] [PubMed] [Google Scholar]
- 20.Noseworthy JH, Lucchinetti C, Rodriguez M, Weinshenker BG. Multiple sclerosis. N Engl J Med. 2006;354:938–952. doi: 10.1056/NEJM200009283431307. [DOI] [PubMed] [Google Scholar]
- 21.Oh SJ, Bilello M, Schindler M, Markowitz CE, Detre JA, Lee J. Direct visualization of short transverse relaxation time component (ViSTa) NeuroImage. 2013;83:485–492. doi: 10.1016/j.neuroimage.2013.06.047. [DOI] [PMC free article] [PubMed] [Google Scholar]
- 22.Robson MD, Gatehouse PD, Bydder M, Bydder GM. Magnetic resonance: an introduction to ultrashort TE (UTE) imaging. J Comput Assist Tomogr. 2003;27:825–846. doi: 10.1097/00004728-200311000-00001. [DOI] [PubMed] [Google Scholar]
- 23.Rovaris M, Judica E, Sastre-Garriga J, Rovira A, Sormani MP, Benedetti B, et al. Large-scale, multicenter, quantitative MRI study of brain and cord damage in primary progressive multiple sclerosis. Multiple Sclerosis. 2008;14:455–464. doi: 10.1177/1352458507085129. [DOI] [PubMed] [Google Scholar]
- 24.van der Knaap MS, Valk J. In: Magnetic resonance of myelination and myelin disorders. Heilmann U, Mennecke-Buhler D, editors. Springer; Berlin: 2005. pp. 1–19. [Google Scholar]
- 25.Waldman A, Rees JH, Brock CS, Robson MD, Gatehouse PD, Bydder GM. MRI of the brain with ultra-short echo time pulse sequences. Neuroradiology. 2003;45:887–892. doi: 10.1007/s00234-003-1076-z. [DOI] [PubMed] [Google Scholar]
- 26.Wennerstrom H. Proton nuclear magnetic resonance lineshapes in lamellar liquid crystals. Chem Phys Lett. 1973;18:41–44. [Google Scholar]
- 27.Wilhelm MJ, Ong HH, Wehrli SL, Li C, Tsai PH, Hackney DB, et al. Direct magnetic resonance detection of myelin and prospects for quantitative imaging of myelin density. Proc Natl Acad Sci USA. 2012;109:9605–9610. doi: 10.1073/pnas.1115107109. [DOI] [PMC free article] [PubMed] [Google Scholar]
- 28.Young IR, Hall AS, Pallis CA, Legg NJ, Bydder GM, Steiner RE. Nuclear magnetic resonance imaging of the brain in multiple sclerosis. Lancet. 1981;14:1063–1066. doi: 10.1016/s0140-6736(81)91273-3. [DOI] [PubMed] [Google Scholar]


