Abstract
Administering polymyxin antibiotics in a traditional fashion may be ineffective against Gram-negative ESKAPE (Enterococcus faecium, Staphylococcus aureus, Klebsiella pneumoniae, Acinetobacter baumannii, Pseudomonas aeruginosa, and Enterobacter species) pathogens. Here, we explored increasing the dose intensity of polymyxin B against two strains of Acinetobacter baumannii in the hollow-fiber infection model. The following dosage regimens were simulated for polymyxin B (t1/2 = 8 h): non-loading dose (1.43 mg/kg of body weight every 12 h [q12h]), loading dose (2.22 mg/kg q12h for 1 dose and then 1.43 mg/kg q12h), front-loading dose (3.33 mg/kg q12h for 1 dose followed by 1.43 mg/kg q12h), burst (5.53 mg/kg for 1 dose), and supraburst (18.4 mg/kg for 1 dose). Against both A. baumannii isolates, a rapid initial decline in the total population was observed within the first 6 h of polymyxin exposure, whereby greater polymyxin B exposure resulted in greater maximal killing of −1.25, −1.43, −2.84, −2.84, and −3.40 log10 CFU/ml within the first 6 h. Unexpectedly, we observed a paradoxical effect whereby higher polymyxin B exposures dramatically increased resistant subpopulations that grew on agar containing up to 10 mg/liter of polymyxin B over 336 h. High drug exposure also proliferated polymyxin-dependent growth. A cost-benefit pharmacokinetic/pharmacodynamic relationship between 24-h killing and 336-h resistance was explored. The intersecting point, where the benefit of bacterial killing was equal to the cost of resistance, was an fAUC0–24 (area under the concentration-time curve from 0 to 24 h for the free, unbound fraction of drug) of 38.5 mg · h/liter for polymyxin B. Increasing the dose intensity of polymyxin B resulted in amplification of resistance, highlighting the need to utilize polymyxins as part of a combination against high-bacterial-density A. baumannii infections.
INTRODUCTION
The polymyxin antibiotics have emerged as a last line of defense for the treatment of Gram-negative strains resistant to all other currently available antibiotics (1–3). Polymyxin B and colistin are often the only available agents with activity against these Gram-negative superbugs (4, 5). Even more worrisome is the first report of plasmid-mediated polymyxin resistance in Escherichia coli, which could be transferred to other Gram-negative strains (6). Furthermore, current dosage regimens for both polymyxin B and colistin result in polymyxin plasma concentrations that are suboptimal in a significant proportion of patients (7–10). In vitro and animal studies clearly demonstrate that antibiotic resistance is amplified during exposure to suboptimal polymyxin concentrations, especially against polymyxin-heteroresistant strains that are frequently isolated in Acinetobacter baumannii (11–14).
Administering nontraditional, high-intensity polymyxin regimens may be a strategy to maximize bacterial killing while minimizing resistance and potential toxicity. We have previously determined that front-loading colistin resulted in greater bacterial killing within the first 24 h against Pseudomonas aeruginosa (15). The polymyxins are suitable candidates for high-intensity exposure at the beginning of therapy due to their rapid bactericidal activity against high bacterial densities (16). However, high-intensity regimens for polymyxin B have not been evaluated against A. baumannii. To date, there have been no studies that profiled the time course of A. baumannii responses to polymyxin B over long-term durations at high bacterial densities that correspond to infections such as ventilator-associated pneumonia (VAP) (17, 18).
In the present study, we explored how increasing the dose intensity of polymyxin B influences bactericidal activity and resistance suppression against A. baumannii. A hollow-fiber infection model (HFIM) was used to simulate a range for polymyxin B varying in initial dose intensity. Bacterial killing and detailed population analysis profiles that tracked the amplification of resistance over a 14-day period were evaluated.
MATERIALS AND METHODS
Bacterial isolates, antibiotics, and susceptibility testing.
Two A. baumannii strains were utilized, ATCC 19606 and 03-149.01. ATCC 19606 was selected as a laboratory control isolate. 03-149.01 was from a patient enrolled in an open-label population pharmacokinetic study who received colistin methanesulfonate as part of his or her clinical care for treatment of a bloodstream infection or pneumonia due to a Gram-negative bacillus (9). Neither isolate was previously exposed to polymyxin B or colistin. Analytical-grade polymyxin B was purchased from Sigma-Aldrich (lot WXBB4470V; St. Louis, MO). Fresh stock solutions of polymyxin B were prepared immediately prior to each experiment. Cation-adjusted Mueller-Hinton broth (CAMHB) (Difco, Detroit, MI, USA) supplemented with calcium (25 mg/liter) and magnesium (12.5 mg/liter) was used as the growth medium. MIC values were determined in quadruplicate according to the CLSI guidelines. Both strains had a polymyxin B MIC of 0.5 mg/liter.
HFIM.
The HFIM was used to simulate the time course of unbound plasma concentrations observed in patients receiving polymyxin B regimens by using an approach that was previously described (19, 20). Cellulosic hollow-fiber cartridges (C3008; Fiber Cell Systems, Fredrick, MD) were utilized in all experiments, and samples were serially collected for 336 h. Total population counts were quantified by depositing appropriately diluted bacterial samples on Mueller-Hinton agar (MHA) plates. In addition, population analysis profiles (PAP) were performed by plating diluted samples onto MHA plates containing polymyxin B at 0.5, 1, 2, 3, 4, 6, 8, or 10 mg/liter to track resistant subpopulations over 336 h.
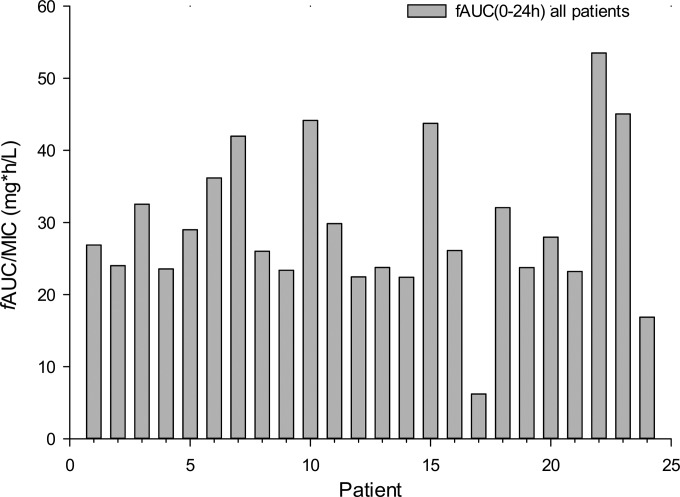
Dosage regimens were simulated for polymyxin B (t1/2 = 8 h) using a protein binding level of 42%, based on the population pharmacokinetic model by Sandri et al. (7, 8), from 24 adult patients that received physician-selected, intravenous polymyxin B dosage regimens ranging from 0.45 to 3.38 mg/kg/day. Of the 24 patients participating in the population pharmacokinetic study, 23 patients received the drug every 12 h and 1 patient received polymyxin B every 24 h. The following resultant fAUC0–24 (area under the concentration-time curve from 0 to 24 h for the free, unbound fraction of drug) values were determined: range of 6.2 to 53.5 mg · h/liter, median of 26.5 mg · h/liter, average of 29.4 mg · h/liter, and standard deviations of 10.4 mg · h/liter, as shown in Fig. 1 (7). The maximum fAUC over 24 h at steady state was 60.4 mg · h/liter. There were 5 regimens simulated in the HFIM: regimen 1, polymyxin B non-loading dose (1.43 mg/kg every 12 h [q12h], generating an fAUC0–24 of 28.9 mg · h/liter across the first day and an fAUC at steady state [fAUCss] of 35.9 mg · h/liter); regimen 2, polymyxin B with loading dose (2.22 mg/kg for 1 dose followed by 1.43 mg/kg q12h starting 12 h later, fAUC0–24 of 35.9 mg · h/liter across each day); regimen 3, polymyxin B front-loading dose (3.33 mg/kg for 1 dose followed by 1.43 mg/kg q12h starting 12 h later, with an fAUC0–24 of 48.2 mg · h/liter across the first day and an fAUCss of 35.9 mg · h/liter at steady state); regimen 4, polymyxin B burst (5.53 mg/kg for 1 dose followed by no subsequent doses, with an fAUC0–24 of 60.4 mg · h/liter); and regimen 5, polymyxin B supraburst (18.4 mg/kg for 1 dose followed by no subsequent doses, with an fAUC0–24 h of 202.5 mg · h/liter).
FIG 1.
fAUCs over 0 to 24 h for polymyxin B for each of the 24 critically ill adult patients are shown and are based on the population pharmacokinetic model by Sandri et al. (7, 8). All patients received physician-selected, intravenous polymyxin B regimens ranging from 0.45 to 3.38 mg/kg/day. The resulting fAUCs are shown for each patient. In the previous population pharmacokinetic study, there were 23 patients who received the drug every 12 h and 1 patient who received polymyxin B every 24 h. The fAUC (0 to 24 h) ranged from 6.2 to 53.5 mg · h/liter with a median of 26.5 mg · h/liter, average of 29.4 mg · h/liter, and standard deviation of 10.4 mg · h/liter. The maximum fAUC over 24 h at steady state was 60.4 mg · h/liter. These data served as the basis for the simulated regimens to be studied in the hollow-fiber infection model.
Four of the above-described regimens (non-loading dose [regimen 1], loading dose [2], front loading [3], and burst [4]) were in the range of the achieved fAUCs in critically ill patients from the population pharmacokinetic study of polymyxin B (7). Regimens 1 to 3 were administered across the 14-day HFIM study, while regimens 4 and 5 were administered as single-dose regimens given only on day 1. At steady state, the highest fAUC over 24 h achieved in critically ill patients was 60.4 mg · h/liter, which provided the rationale for simulating the polymyxin B burst regimen (regimen 4) that was administered as a single dose. Regimen 5, supraburst, was selected as a supratherapeutic proof-of-concept regimen to test the hypothesis that high-intensity regimens resulted in the amplification of resistance. The rationale for both of these regimens was to leverage the rapid, concentration-dependent, bactericidal activity of the polymyxin antibiotics at the beginning of therapy while decreasing potential exposure. Characterizing the pharmacodynamics of these new polymyxin regimens will be beneficial in defining how to optimally administer polymyxin B in combination with other antibiotics in the future. Polymyxin B concentrations were quantified using validated high-performance liquid chromatography-tandem mass spectrometry (LC-MS/MS) as previously described (21), with good reproducibility (coefficients of variation of ≤9.0%) and accuracy (observed concentrations were ≤10% from target concentrations). The limit of quantification was 0.1 mg/liter.
Cost-benefit PK/PD analyses.
To determine the pharmacokinetic/pharmacodynamic (PK/PD) relationship between exposure and bacterial killing and resistance, we utilized a cost-benefit approach. We defined the benefit as initial bacterial killing of the total population within the first 24 h and cost as the amplification of resistant subpopulations which included real-time PAP data over 336 h. An area-based integrated PK/PD measure was utilized as previously described (22). Using the linear trapezoid rule, the area under the CFU curve for the total population over 24 h (AUCFU0–24) was calculated to assess bacterial killing. The 24-h log ratio area for bacterial killing then was calculated as the logarithm of the AUCFU0–24 of the total population (AUCFUdrug total population) divided by the AUCFU0–24 of the total population for the growth control (AUCFUcontrol), as described in equation 1. The AUCFU of resistant subpopulations was also calculated over 336 h (AUCFUresistant subpopulation) and normalized by the AUCFU over 336 h of the total population (AUCFUtotal population) to generate the 336-h log ratio area, a measure of resistance amplification (equation 2). For each polymyxin B regimen, five resistant subpopulations were used in the resistance analysis that were obtained from bacterial counts on agar containing 3, 4, 6, 8, and 10 mg/liter of polymyxin B (the CLSI breakpoint for polymyxin resistance is >2 mg/liter).
| (1) |
| (2) |
| (3) |
A four-parameter Hill-type model (equation 3) was fit to the effect parameter using Systat (version 12; Systat Software Inc., San Jose, CA) (22). In this model, E (dependent variable) represents the log ratio area, E0 is the effect at a polymyxin B fAUC24 of 0, Emax is the maximum effect of the polymyxin B regimen, fAUC24 is the free polymyxin B area under the curve within the first 24 h, EC50 is the polymyxin B fAUC24 displaying 50% of the maximum effect, and H is the sigmoidicity constant.
RESULTS
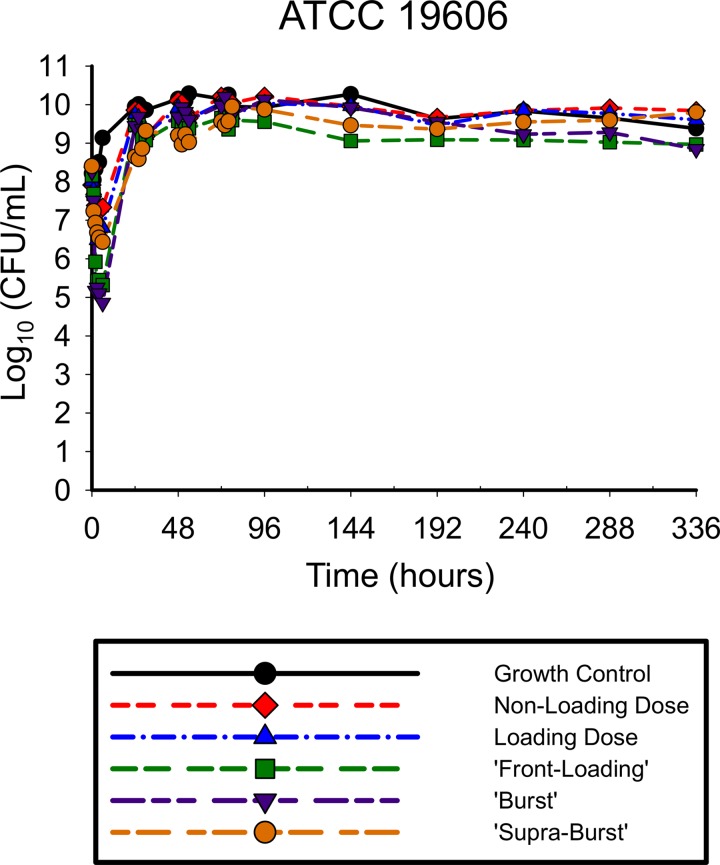
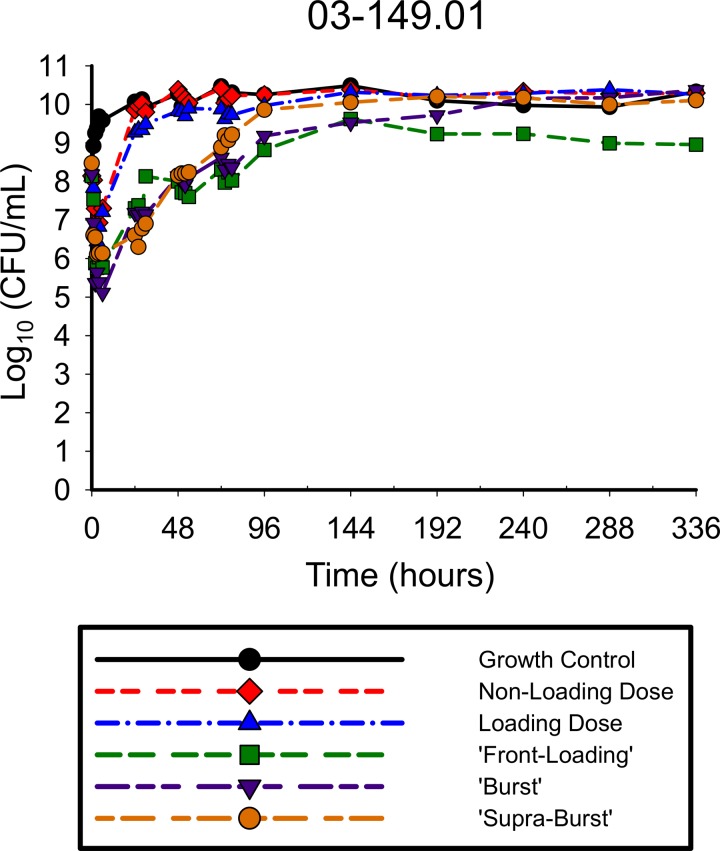
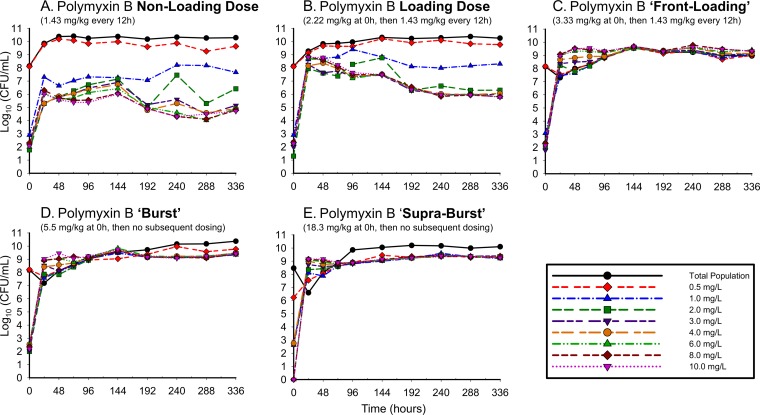
The antibiotic activities of the simulated polymyxin B regimens against A. baumannii ATCC 19606 (Fig. 2) and 03-149.01 (Fig. 3) were determined over 336 h. With all regimens against both isolates, there was a rapid initial decline in which the reductions in the total population occurred very early in therapy, within the first 2 to 6 h of polymyxin exposure. Greater polymyxin B exposure across the first day resulted in larger maximal log reductions in bacterial counts from the baseline for both ATCC 19606 for regimens 1, 2, 3, 4, and 5 (−1.17, −1.43, −2.84, −3.40, and −1.96, respectively) and the 03-149.01 isolate (−1.25, −1.30, −2.10, −2.82, and −2.54, respectively) within the first 6 h. The rapid initial bactericidal activity that was present in the first 6 h was followed by the regrowth of the total population by 24 h for both isolates, although the degree of regrowth varied between the two isolates. For ATCC 19606, regrowth occurred within 24 h for all polymyxin B regimens, after which counts were uniformly stable up to 336 h. For 03-149.01, regrowth occurred rapidly for lower-intensity regimens (non-loading dose and loading dose) and was delayed for high-intensity regimens (front-loading, burst, and supraburst).
FIG 2.
Total population of ATCC 19606 in response to polymyxin B regimens in the hollow-fiber infection model. The following regimens for polymyxin B were simulated: regimen 1, polymyxin B non-loading dose (1.43 mg/kg q12h, generating an fAUC0–24 of 28.9 mg/liter · h across the first day and an fAUCss of 35.9 mg · h/liter at steady state); regimen 2, polymyxin B with loading dose (2.22 mg/kg for 1 dose followed by 1.43 mg/kg q12h starting 12 h later, with an fAUC0–24 of 35.9 mg · h/liter across each day); regimen 3, polymyxin B front-loading dose (3.33 mg/kg for 1 dose followed by 1.43 mg/kg q12h starting 12 h later, with an fAUC0–24 of 48.2 mg · h/liter across the first day and an fAUCss of 35.9 mg · h/liter at steady state); regimen 4, polymyxin B burst (5.53 mg/kg for 1 dose followed by no subsequent doses, with an fAUC0–24 of 60.4 mg · h/liter); and regimen 5, polymyxin B supraburst (18.4 mg/kg for 1 dose followed by no subsequent doses, fAUC0–24 of 202.5 mg · h/liter).
FIG 3.
Total population of 03-149.01 in response to polymyxin B regimens in the hollow-fiber infection model. The following regimens for polymyxin B were simulated: regimen 1, polymyxin B non-loading dose (1.43 mg/kg q12h, generating an fAUC0–24 of 28.9 mg/liter · h across the first day and an fAUCss of 35.9 mg · h/liter at steady state); regimen 2, polymyxin B with loading dose (2.22 mg/kg for 1 dose followed by 1.43 mg/kg q12h starting 12 h later, with an fAUC0–24 of 35.9 mg · h/liter across each day); regimen 3, polymyxin B front-loading dose (3.33 mg/kg for 1 dose followed by 1.43 mg/kg q12h starting 12 h later, fAUC0–24 of 48.2 mg · h/liter across the first day and an fAUCss of 35.9 mg · h/liter at steady state); regimen 4, polymyxin B burst (5.53 mg/kg for 1 dose followed by no subsequent doses, fAUC0–24 of 60.4 mg · h/liter); and regimen 5, polymyxin B supraburst (18.4 mg/kg for 1 dose followed by no subsequent doses, fAUC0–24 of 202.5 mg · h/liter).
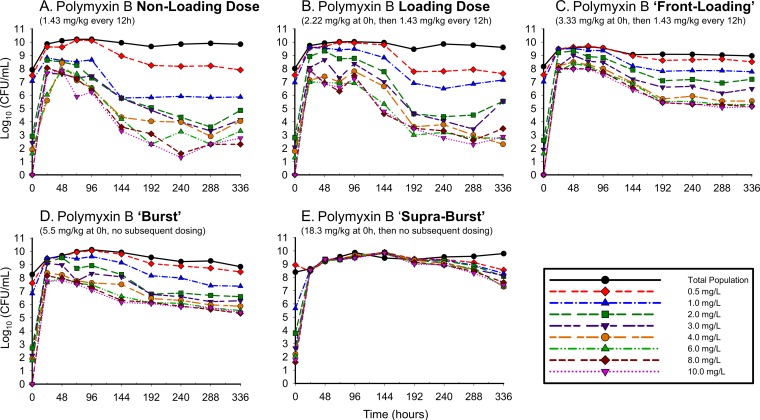
The polymyxin-resistant subpopulations detected over 336 h are shown in Fig. 4 for ATCC 19606 and Fig. 5 for 03-149.01. The non-loading dose regimens amplified resistant subpopulations at 24 h, resulting in resistant subpopulations that were major components of the overall population. The amplification observed within the first 24 h was driven by drug exposure, with higher-initial-exposure polymyxin regimens conferring higher levels of resistance. For resistant subpopulations, greater drug exposure also resulted in polymyxin-dependent growth: higher bacterial counts were noted on polymyxin-containing agar than on drug-free agar. This phenomenon was particularly evident when A. baumannii bacteria were exposed to high-intensity regimens (front-loading, burst, and supraburst) and was more pronounced in the clinical A. baumannii isolate 03-149.01 than in the ATCC isolate.
FIG 4.
Complete time course of subpopulations of ATCC 19606 plated on polymyxin B-containing agar in response to polymyxin B regimens in the hollow-fiber infection model. The following regimens for polymyxin B were simulated: polymyxin B non-loading dose (1.43 mg/kg q12h, generating an fAUC0–24 of 28.9 mg · h/liter across the first day and an fAUCss of 35.9 mg · h/liter at steady state) (A); polymyxin B with loading dose (2.22 mg/kg for 1 dose followed by 1.43 mg/kg q12h staring 12 h later, fAUC0–24 of 35.9 mg · h/liter across each day) (B); polymyxin B front-loading dose (3.33 mg/kg for 1 dose followed by 1.43 mg/kg q12h starting 12 h later, fAUC0–24 of 48.2 mg · h/liter across the first day and an fAUCss of 35.9 mg · h/liter at steady state) (C); polymyxin B burst (5.53 mg/kg for 1 dose followed by no subsequent doses, fAUC0–24 of 60.4 mg · h/liter) (D); polymyxin B supraburst (18.4 mg/kg for 1 dose followed by no subsequent doses, fAUC0–24 of 202.5 mg · h/liter) (E).
FIG 5.
Complete time course of subpopulations of 03-149.01 A. baumannii plated on polymyxin B-containing agar in response to polymyxin B regimens in the hollow-fiber infection model. The following regimens for polymyxin B were simulated: polymyxin B non-loading dose (1.43 mg/kg q12h, generating an fAUC0–24 of 28.9 mg · h/liter across the first day and an fAUCss of 35.9 mg · h/liter at steady state) (A); polymyxin B with a loading dose (2.22 mg/kg for 1 dose followed by 1.43 mg/kg q12h starting 12 h later, fAUC0–24 of 35.9 mg · h/liter across each day) (B); polymyxin B front-loading (3.33 mg/kg for 1 dose followed by 1.43 mg/kg starting 12 h later, fAUC0–24 of 48.2 mg · h/liter across the first day and an fAUCss of 35.9 mg · h/liter at steady state) (C); polymyxin B burst (5.53 mg/kg for 1 dose followed by no subsequent doses, fAUC0–24 of 60.4 mg · h/liter) (D); polymyxin B supraburst (18.4 mg/kg for 1 dose followed by no subsequent doses, fAUC0–24 of 202.5 mg · h/liter) (E).
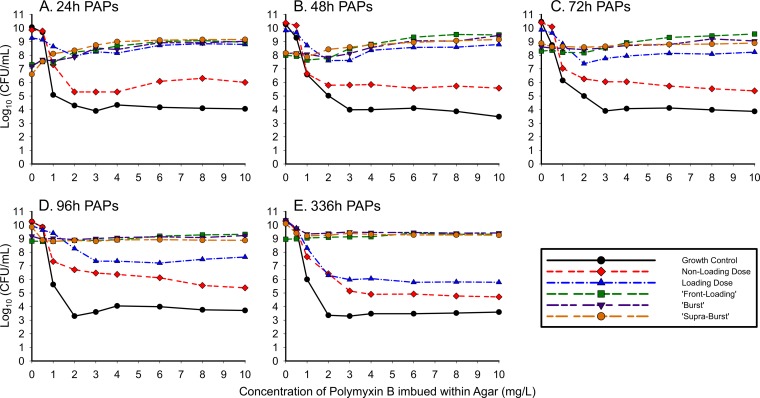
The population analysis profiles (PAPs) resulting from the simulated polymyxin B regimens are shown in Fig. 6 for A. baumannii 03-149-1. After 24 h of drug exposure in the HFIM, 03-149.01 demonstrated a polymyxin B-dependent profile, where more bacteria grew on agar containing polymyxin B than on drug-free plates. The polymyxin dependence was most evident when the high-exposure regimens (front-loading, burst, and supraburst) were plated on polymyxin B-containing agar at 24 h, at which point counts on agar plates containing 10 mg/liter polymyxin B exceeded the counts on plates which contained no polymyxin (0 mg/liter), as shown in Fig. 6A. The magnitude of dependence rose with increasing drug exposure. Front-loading, burst, and supraburst regimens displayed bacterial counts on drug-containing plates (polymyxin B drug plates of 10 mg/liter) that were 1.65, 1.84, and 2.55 log10 CFU/ml higher than those on drug-free agar, respectively. Although the polymyxin-dependent growth on the 48-h PAPs (Fig. 6B) was less substantial than that of the 24-h PAPs, polymyxin B-dependent growth was also observed, as the front-loading, burst, and supraburst regimens displayed 1.49, 1.32, and 1.00 log10 CFU/ml higher bacterial counts, respectively, on drug-containing plates (polymyxin B drug plates of 10 mg/liter) than on drug-free agar. The polymyxin dependence again was observed at 72 h (Fig. 6C); however, from 96 h to 336 h (Fig. 6D and E), bacterial counts on drug-free versus drug-containing agar were similar.
FIG 6.
Real-time population analysis profiles (PAPs) for 03-149.01 comparing different dosing regimens at 24 h (A), 48 h (B), 72 h (C), 96 h (D), and 336 h (E). Samples were quantified for total population by depositing appropriately diluted bacterial samples on MHA plates. Aliquots of the diluted sample were plated on CAMHA plates containing polymyxin B at 0.5, 1, 2, 3, 4, 6, 8, or 10 mg/liter for an in-depth analysis of the time course of resistant subpopulations at the times indicated in the panels (data for 144 h, 192 h, 240 h, and 288 h are not shown).
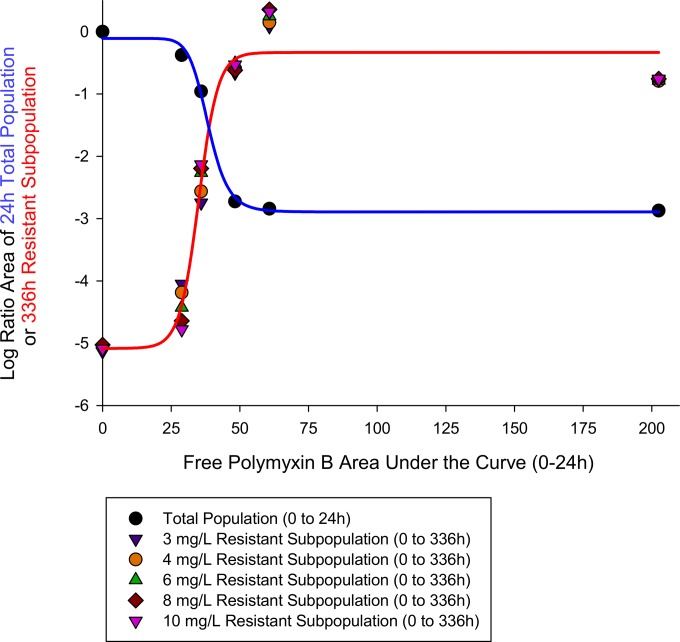
The PK/PD relationship based upon analyzing the benefit of killing and cost of resistance in the clinical isolate 03-149.01 as it relates to exposure (i.e., the regimens) is shown in Fig. 7. The log ratio area approach for 24-h bacterial killing of the total population and the 336-h resistant subpopulations growing on agar containing 3, 4, 6, 8, and 10 mg/liter of polymyxin B were well characterized by Hill-type mathematical models, with R2 values of 0.995 and 0.998, respectively. The respective parameter estimates for the log ratio area approach for 24-h bacterial killing of the total population and the 336-h resistant subpopulations were the following: Emax, 2.78 and −4.72; EC50, 38.5 and 34.9; and H, 10.6 and 10.2. At initial exposures (i.e., fAUC0–24) of <38.5 mg · h/liter, increasing the polymyxin B fAUCs resulted in increased bacterial killing while gradually amplifying the development of resistant subpopulations. At the intersection point of 38.5 mg · h/liter of polymyxin exposure, the amount of bacterial killing was equivalent to the amount of resistance that was amplified. At high exposures of >38.5 mg · h/liter, the benefit of increased bacterial killing was greatly exceeded by the cost of amplification of polymyxin resistance until both phenomena plateaued at ∼60 mg · h/liter.
FIG 7.
Cost-benefit PK/PD relationship for increasing polymyxin B exposure against 03-149.01. Benefit (blue line) was defined as the initial bacterial killing of the total population within the first 24 h. Cost (red line) was the amplification of resistant subpopulations, which was based upon real-time PAP data over 336 h that tracked A. baumannii growth on agar containing polymyxin B at 3, 4, 6, 8, and 10 mg/liter. The intersecting fAUC for the drug exposure at which the benefit of bacterial killing equaled the cost of resistance amplification was 38.5 mg · h/liter.
DISCUSSION
The polymyxin antibiotics have become a last line of defense against A. baumannii isolates that are resistant to traditional therapies, including carbapenems (23, 24). Colistin methanesulfonate (CMS) is an inactive and inefficient prodrug that is slowly and incompletely converted to the active form of colistin (16). Polymyxin B does not suffer from these limitations, as it is administered in its active form. Administering high-intensity polymyxin B regimens during the first several hours may be highly beneficial from a bacterial killing perspective. Therefore, in the current study we utilized the HFIM to evaluate the impact of increasing the initial dose of polymyxin B against a high bacterial density of A. baumannii. A number of observations emerged from the present investigation.
First, we were unable to identify a regimen of polymyxin B that eradicated A. baumannii at a high inoculum. It has been well established that both polymyxin B and colistin are concentration-dependent antibiotics, and the area under the curve/MIC ratio (AUC/MIC) best correlates with their efficacy (25, 26). However, the PK/PD relationship for polymyxin B as it relates to suppression of resistance is largely unknown. Specifically, it is unclear whether higher exposures of polymyxin B could overcome resistance. A number of antibiotics in the literature have demonstrated an inverted U phenomenon, whereby resistant subpopulations rose initially and then declined with increasing drug exposure until reaching a threshold that prevented resistance (27, 28). For polymyxin B, resistance amplification continued despite high fAUC exposures. At polymyxin exposures beyond an fAUC0–24 h of 38.5 mg · h/liter, increasing the dose intensity resulted in continual escalation of resistance amplification. Somewhat to our surprise, in our proof-of-concept HFIM arms, supratherapeutic exposures of polymyxin B resulted in initial rapid bacterial killing followed by the rapid development of resistance. Therefore, driving regimens toward complete eradication may be an important endpoint for resistance suppression, and this may be possible only for polymyxin B in combination with other antibiotics.
Second, there appears to be limited utility in using polymyxin B monotherapy against high-density A. baumannii infections (18). In a recent multicenter study, 94 of 105 (89.5%) patients who were treated with intravenous CMS were diagnosed with bacterial pneumonia (9). In these infections, the bacterial density of the total population is remarkably high and, as a consequence, results in a higher frequency of resistant mutants (19). Zaccard et al. determined that a significant proportion of patients (26.1%) with Gram-negative pneumonia have been shown to have a bacterial burden higher than ≥3 × 10⁷ in dilution-transformed colony counts of bronchoalveolar lavage fluid (17, 29). Based upon this, the bacterial inocula simulated in the HFIM were approximately 108 CFU/ml to mimic these clinical scenarios. Against these high bacterial densities, commonly administered clinical maintenance doses of polymyxin B resulted in stasis. Additionally, the rapid bacterial killing demonstrated on day 1 was no longer seen on days 2 to 14, where the total population was primarily comprised of cells that were completely resistant to polymyxin B. However, the development of polymyxin resistance driven by drug selective pressure may be even more difficult to observe in vivo. Nevertheless, 20 patients were identified with colistin-resistant A. baumannii which occurred almost exclusively in CMS-treated patients (13). Taken together, defining the impact of aggressive polymyxin regimens in patients with A. baumannii pneumonia is complex, as it also involves additional factors, such as virulence, granulocytes, and the production of chemokines and cytokines (30–32).
Third, in the present study we determined that higher drug exposures resulted in A. baumannii resistant subpopulations that demonstrated a dependence on polymyxin B for growth: the bacterial counts after 24 h of exposure to polymyxin B in the HFIM were significantly higher on drug-containing agar than on drug-free agar. Alterations of lipopolysaccharide in the development of resistance have been proposed as a mechanism of colistin resistance (33–36). Qureshi et al. recently determined that lipid A modification by the addition of phosphoethanolamine was a primary mechanism for colistin resistance in colistin-resistant A. baumannii isolates from patients with VAP (13). Moffatt et al. previously determined that the complete loss of LPS is another mechanism contributing to colistin resistance (35, 36). Recent metabolomic studies determined that the development of resistance in a lipopolysaccharide (LPS)-deficient, polymyxin-resistant strain (19606R) was due to perturbation in specific amino acid and carbohydrate metabolites, particularly pentose phosphate pathway and tricarboxylic acid cycle intermediates (36, 37). Metabolomic and structural analyses of a polymyxin-resistant isolate, which emerged from the original 03-149-1 isolate (from the current study), identified the modification of lipid A with phosphoethanolamine (37). Taken together with the potential for evolution of resistance during polymyxin therapy in patients (13), the dose intensity and extent of killing by the first dose of polymyxin B also may play a role in driving these genomic and metabolomic changes.
Finally, it is important to note the situations in which the paradoxical effect for polymyxin B may be relevant. The paradoxical effect for polymyxin B may occur only in the context of a high bacterial density under optimal growth conditions. At lower bacterial densities, high exposure of polymyxin B has been shown to result in rapid bacterial killing and complete suppression of resistance (23, 36). The pharmacodynamics of polymyxin B will also differ in patients with an intact immune system, owing to the distinct relationship between granulocyte-mediated killing and antibiotics (14). Nevertheless, the paradoxical effect for polymyxin B may also apply to other Gram-negative pathogens and other polymyxin antibiotics such as colistin when given as a standalone agent.
In conclusion, we observed a paradoxical effect whereby higher polymyxin B exposures resulted in the increased amplification of resistant, polymyxin B-dependent subpopulations. Therefore, the utility of administering polymyxin B in a high-intensity fashion may be restricted to aggressive combination regimens that combat resistance amplification. Although increasing the dose of polymyxin B in combination regimens significantly improves bacterial killing, the probability of nephrotoxicity increases as well (37–39). Now, the challenge is to define optimal pharmaco- and toxicodynamically driven regimens for polymyxin B combinations which result in the greatest bacterial killing and suppression of resistance and the least potential toxicity.
ACKNOWLEDGMENTS
Research reported in this publication was supported by the National Institute of Allergy and Infectious Diseases of the National Institutes of Health under award number R01AI111990. C.B.L. is an Australian National Health and Medical Research Council (NHMRC) Career Development Fellow.
The content is solely the responsibility of the authors and does not necessarily represent the official views of the National Institutes of Health.
REFERENCES
- 1.Boucher HW, Talbot GH, Bradley JS, Edwards JE, Gilbert D, Rice LB, Scheld M, Spellberg B, Bartlett J. 2009. Bad bugs, no drugs: no ESKAPE! An update from the Infectious Diseases Society of America. Clin Infect Dis 48:1–12. doi: 10.1086/595011. [DOI] [PubMed] [Google Scholar]
- 2.Lim LM, Ly N, Anderson D, Yang JC, Macander L, Jarkowski A III, Forrest A, Bulitta JB, Tsuji BT. 2010. Resurgence of colistin: a review of resistance, toxicity, pharmacodynamics, and dosing. Pharmacotherapy 30:1279–1291. doi: 10.1592/phco.30.12.1279. [DOI] [PMC free article] [PubMed] [Google Scholar]
- 3.Nation RL, Li J, Cars O, Couet W, Dudley MN, Kaye KS, Mouton JW, Paterson DL, Tam VH, Theuretzbacher U, Tsuji BT, Turnidge JD. 2015. Framework for optimisation of the clinical use of colistin and polymyxin B: the Prato polymyxin consensus. Lancet Infect Dis 15:225–234. doi: 10.1016/S1473-3099(14)70850-3. [DOI] [PubMed] [Google Scholar]
- 4.Walsh TR, Weeks J, Livermore DM, Toleman MA. 2011. Dissemination of NDM-1 positive bacteria in the New Delhi environment and its implications for human health: an environmental point prevalence study. Lancet Infect Dis 11:355–362. doi: 10.1016/S1473-3099(11)70059-7. [DOI] [PubMed] [Google Scholar]
- 5.Arroyo LA, Mateos I, Gonzalez V, Aznar J. 2009. In vitro activities of tigecycline, minocycline, and colistin-tigecycline combination against multi- and pandrug-resistant clinical isolates of Acinetobacter baumannii group. Antimicrob Agents Chemother 53:1295–1296. doi: 10.1128/AAC.01097-08. [DOI] [PMC free article] [PubMed] [Google Scholar]
- 6.Liu YY, Wang Y, Walsh TR, Yi LX, Zhang R, Spencer J, Doi Y, Tian G, Dong B, Huang X, Yu LF, Gu D, Ren H, Chen X, Lv L, He D, Zhou H, Liang Z, Liu JH, Shen J. 2016. Emergence of plasmid-mediated colistin resistance mechanism MCR-1 in animals and human beings in China: a microbiological and molecular biological study. Lancet Infect Dis 16:161–168. doi: 10.1016/S1473-3099(15)00424-7. [DOI] [PubMed] [Google Scholar]
- 7.Sandri AM, Landersdorfer CB, Jacob J, Boniatti MM, Dalarosa MG, Falci DR, Behle TF, Bordinhao RC, Wang J, Forrest A, Nation RL, Li J, Zavascki AP. 2013. Population pharmacokinetics of intravenous polymyxin B in critically ill patients: implications for selection of dosage regimens. Clin Infect Dis 57:524–531. doi: 10.1093/cid/cit334. [DOI] [PubMed] [Google Scholar]
- 8.Sandri AM, Landersdorfer CB, Jacob J, Boniatti MM, Dalarosa MG, Falci DR, Behle TF, Saitovitch D, Wang J, Forrest A, Nation RL, Zavascki AP, Li J. 2013. Pharmacokinetics of polymyxin B in patients on continuous venovenous haemodialysis. J Antimicrob Chemother 68:674–677. doi: 10.1093/jac/dks437. [DOI] [PubMed] [Google Scholar]
- 9.Garonzik SM, Li J, Thamlikitkul V, Paterson DL, Shoham S, Jacob J, Silveira FP, Forrest A, Nation RL. 2011. Population pharmacokinetics of colistin methanesulfonate and formed colistin in critically ill patients from a multicenter study provide dosing suggestions for various categories of patients. Antimicrob Agents Chemother 55:3284–3294. doi: 10.1128/AAC.01733-10. [DOI] [PMC free article] [PubMed] [Google Scholar]
- 10.Kwa AL, Abdelraouf K, Low JG, Tam VH. 2011. Pharmacokinetics of polymyxin B in a patient with renal insufficiency: a case report. Clin Infect Dis 52:1280–1281. doi: 10.1093/cid/cir137. [DOI] [PMC free article] [PubMed] [Google Scholar]
- 11.Li J, Rayner CR, Nation RL, Owen RJ, Spelman D, Tan KE, Liolios L. 2006. Heteroresistance to colistin in multidrug-resistant Acinetobacter baumannii. Antimicrob Agents Chemother 50:2946–2950. doi: 10.1128/AAC.00103-06. [DOI] [PMC free article] [PubMed] [Google Scholar]
- 12.Cai Y, Chai D, Wang R, Liang B, Bai N. 2012. Colistin resistance of Acinetobacter baumannii: clinical reports, mechanisms and antimicrobial strategies. J Antimicrob Chemother 67:1607–1615. doi: 10.1093/jac/dks084. [DOI] [PubMed] [Google Scholar]
- 13.Qureshi ZA, Hittle LE, O'Hara JA, Rivera JI, Syed A, Shields RK, Pasculle AW, Ernst RK, Doi Y. 2015. Colistin-resistant Acinetobacter baumannii: beyond carbapenem resistance. Clin Infect Dis 60:1295–1303. doi: 10.1093/cid/civ048. [DOI] [PMC free article] [PubMed] [Google Scholar]
- 14.Barin J, Martins AF, Heineck BL, Barth AL, Zavascki AP. 2013. Hetero- and adaptive resistance to polymyxin B in OXA-23-producing carbapenem-resistant Acinetobacter baumannii isolates. Ann Clin Microbiol Antimicrob 12:15. doi: 10.1186/1476-0711-12-15. [DOI] [PMC free article] [PubMed] [Google Scholar]
- 15.Rao GG, Ly NS, Haas CE, Garonzik S, Forrest A, Bulitta JB, Kelchlin PA, Holden PN, Nation RL, Li J, Tsuji BT. 2014. New dosing strategies for an old antibiotic: pharmacodynamics of front-loaded regimens of colistin at simulated pharmacokinetics in patients with kidney or liver disease. Antimicrob Agents Chemother 58:1381–1388. doi: 10.1128/AAC.00327-13. [DOI] [PMC free article] [PubMed] [Google Scholar]
- 16.Bulitta JB, Yang JC, Yohonn L, Ly NS, Brown SV, D'Hondt RE, Jusko WJ, Forrest A, Tsuji BT. 2010. Attenuation of colistin bactericidal activity by high inoculum of Pseudomonas aeruginosa characterized by a new mechanism-based population pharmacodynamic model. Antimicrob Agents Chemother 54:2051–2062. doi: 10.1128/AAC.00881-09. [DOI] [PMC free article] [PubMed] [Google Scholar]
- 17.Zaccard CR, Schell RF, Spiegel CA. 2009. Efficacy of bilateral bronchoalveolar lavage for diagnosis of ventilator-associated pneumonia. J Clin Microbiol 47:2918–2924. doi: 10.1128/JCM.00747-09. [DOI] [PMC free article] [PubMed] [Google Scholar]
- 18.American Thoracic Society, Infectious Diseases Society of America. 2005. Guidelines for the management of adults with hospital-acquired, ventilator-associated, and healthcare-associated pneumonia. Am J Respir Crit Care Med 171:388–416. doi: 10.1164/rccm.200405-644ST. [DOI] [PubMed] [Google Scholar]
- 19.Ly NS, Bulitta JB, Rao GG, Landersdorfer CB, Holden PN, Forrest A, Bergen PJ, Nation RL, Li J, Tsuji BT. 2015. Colistin and doripenem combinations against Pseudomonas aeruginosa: profiling the time course of synergistic killing and prevention of resistance. J Antimicrob Chemother 70:1434–1442. doi: 10.1093/jac/dku567. [DOI] [PMC free article] [PubMed] [Google Scholar]
- 20.Drusano GL, Bonomo RA, Bahniuk N, Bulitta JB, Vanscoy B, Defiglio H, Fikes S, Brown D, Drawz SM, Kulawy R, Louie A. 2012. Resistance emergence mechanism and mechanism of resistance suppression by tobramycin for cefepime for Pseudomonas aeruginosa. Antimicrob Agents Chemother 56:231–242. doi: 10.1128/AAC.05252-11. [DOI] [PMC free article] [PubMed] [Google Scholar]
- 21.Cheah SE, Bulitta JB, Li J, Nation RL. 2014. Development and validation of a liquid chromatography-mass spectrometry assay for polymyxin B in bacterial growth media. J Pharm Biomed Anal 92:177–182. doi: 10.1016/j.jpba.2014.01.015. [DOI] [PMC free article] [PubMed] [Google Scholar]
- 22.Tsuji BT, von Eiff C, Kelchlin PA, Forrest A, Smith PF. 2008. Attenuated vancomycin bactericidal activity against Staphylococcus aureus hemB mutants expressing the small-colony-variant phenotype. Antimicrob Agents Chemother 52:1533–1537. doi: 10.1128/AAC.01254-07. [DOI] [PMC free article] [PubMed] [Google Scholar]
- 23.Peleg AY, Seifert H, Paterson DL. 2008. Acinetobacter baumannii: emergence of a successful pathogen. Clin Microbiol Rev 21:538–582. doi: 10.1128/CMR.00058-07. [DOI] [PMC free article] [PubMed] [Google Scholar]
- 24.Lee HJ, Bergen PJ, Bulitta JB, Tsuji B, Forrest A, Nation RL, Li J. 2013. Synergistic activity of colistin and rifampin combination against multidrug-resistant Acinetobacter baumannii in an in vitro pharmacokinetic/pharmacodynamic model. Antimicrob Agents Chemother 57:3738–3745. doi: 10.1128/AAC.00703-13. [DOI] [PMC free article] [PubMed] [Google Scholar]
- 25.Tam VH, Schilling AN, Vo G, Kabbara S, Kwa AL, Wiederhold NP, Lewis RE. 2005. Pharmacodynamics of polymyxin B against Pseudomonas aeruginosa. Antimicrob Agents Chemother 49:3624–3630. doi: 10.1128/AAC.49.9.3624-3630.2005. [DOI] [PMC free article] [PubMed] [Google Scholar]
- 26.Dudhani RV, Turnidge JD, Nation RL, Li J. 2010. fAUC/MIC is the most predictive pharmacokinetic/pharmacodynamic index of colistin against Acinetobacter baumannii in murine thigh and lung infection models. J Antimicrob Chemother 65:1984–1990. doi: 10.1093/jac/dkq226. [DOI] [PMC free article] [PubMed] [Google Scholar]
- 27.Tam VH, Louie A, Deziel MR, Liu W, Drusano GL. 2007. The relationship between quinolone exposures and resistance amplification is characterized by an inverted U: a new paradigm for optimizing pharmacodynamics to counterselect resistance. Antimicrob Agents Chemother 51:744–747. doi: 10.1128/AAC.00334-06. [DOI] [PMC free article] [PubMed] [Google Scholar]
- 28.Vanscoy B, Mendes RE, Castanheira M, McCauley J, Bhavnani SM, Forrest A, Jones RN, Okusanya OO, Friedrich LV, Steenbergen J, Ambrose PG. 2013. Relationship between ceftolozane-tazobactam exposure and drug resistance amplification in a hollow-fiber infection model. Antimicrob Agents Chemother 57:4134–4138. doi: 10.1128/AAC.00461-13. [DOI] [PMC free article] [PubMed] [Google Scholar]
- 29.Drusano GL, Liu W, Fikes S, Cirz R, Robbins N, Kurhanewicz S, Rodriquez J, Brown D, Baluya D, Louie A. 2014. Interaction of drug- and granulocyte-mediated killing of Pseudomonas aeruginosa in a murine pneumonia model. J Infect Dis 210:1319–1324. doi: 10.1093/infdis/jiu237. [DOI] [PMC free article] [PubMed] [Google Scholar]
- 30.Breslow JM, Meissler JJ Jr, Hartzell RR, Spence PB, Truant A, Gaughan J, Eisenstein TK. 2011. Innate immune responses to systemic Acinetobacter baumannii infection in mice: neutrophils, but not interleukin-17, mediate host resistance. Infect Immun 79:3317–3327. doi: 10.1128/IAI.00069-11. [DOI] [PMC free article] [PubMed] [Google Scholar]
- 31.de Breij A, Eveillard M, Dijkshoorn L, van den Broek PJ, Nibbering PH, Joly-Guillou ML. 2012. Differences in Acinetobacter baumannii strains and host innate immune response determine morbidity and mortality in experimental pneumonia. PLoS One 7:e30673. doi: 10.1371/journal.pone.0030673. [DOI] [PMC free article] [PubMed] [Google Scholar]
- 32.Mortensen BL, Skaar EP. 2012. Host-microbe interactions that shape the pathogenesis of Acinetobacter baumannii infection. Cell Microbiol 14:1336–1344. doi: 10.1111/j.1462-5822.2012.01817.x. [DOI] [PMC free article] [PubMed] [Google Scholar]
- 33.Beceiro A, Moreno A, Fernandez N, Vallejo JA, Aranda J, Adler B, Harper M, Boyce JD, Bou G. 2014. Biological cost of different mechanisms of colistin resistance and their impact on virulence in Acinetobacter baumannii. Antimicrob Agents Chemother 58:518–526. doi: 10.1128/AAC.01597-13. [DOI] [PMC free article] [PubMed] [Google Scholar]
- 34.Henry R, Crane B, Powell D, Deveson Lucas D, Li Z, Aranda J, Harrison P, Nation RL, Adler B, Harper M, Boyce JD, Li J. 2015. The transcriptomic response of Acinetobacter baumannii to colistin and doripenem alone and in combination in an in vitro pharmacokinetics/pharmacodynamics model. J Antimicrob Chemother 70:1303–1313. doi: 10.1093/jac/dku536. [DOI] [PMC free article] [PubMed] [Google Scholar]
- 35.Henry R, Vithanage N, Harrison P, Seemann T, Coutts S, Moffatt JH, Nation RL, Li J, Harper M, Adler B, Boyce JD. 2012. Colistin-resistant, lipopolysaccharide-deficient Acinetobacter baumannii responds to lipopolysaccharide loss through increased expression of genes involved in the synthesis and transport of lipoproteins, phospholipids, and poly-beta-1,6-N-acetylglucosamine. Antimicrob Agents Chemother 56:59–69. doi: 10.1128/AAC.05191-11. [DOI] [PMC free article] [PubMed] [Google Scholar]
- 36.Moffatt JH, Harper M, Harrison P, Hale JD, Vinogradov E, Seemann T, Henry R, Crane B, St Michael F, Cox AD, Adler B, Nation RL, Li J, Boyce JD. 2010. Colistin resistance in Acinetobacter baumannii is mediated by complete loss of lipopolysaccharide production. Antimicrob Agents Chemother 54:4971–4977. doi: 10.1128/AAC.00834-10. [DOI] [PMC free article] [PubMed] [Google Scholar]
- 37.Pogue JM, Lee J, Marchaim D, Yee V, Zhao JJ, Chopra T, Lephart P, Kaye KS. 2011. Incidence of and risk factors for colistin-associated nephrotoxicity in a large academic health system. Clin Infect Dis 53:879–884. doi: 10.1093/cid/cir611. [DOI] [PubMed] [Google Scholar]
- 38.Abdelraouf K, Braggs KH, Yin T, Truong LD, Hu M, Tam VH. 2012. Characterization of polymyxin B-induced nephrotoxicity: implications for dosing regimen design. Antimicrob Agents Chemother 56:4625–4629. doi: 10.1128/AAC.00280-12. [DOI] [PMC free article] [PubMed] [Google Scholar]
- 39.Falagas ME, Kasiakou SK, Kofteridis DP, Roditakis G, Samonis G. 2006. Effectiveness and nephrotoxicity of intravenous colistin for treatment of patients with infections due to polymyxin-only-susceptible (POS) gram-negative bacteria. Eur J Clin Microbiol Infect Dis 25:596–599. doi: 10.1007/s10096-006-0191-2. [DOI] [PubMed] [Google Scholar]


