

Summary
The synchronized activity of six layers of cortical neurons is critical for sensory perception and the control of voluntary behavior, but little is known about the synaptic mechanisms of cortical synchrony across layers in behaving animals. We made single and dual whole-cell recordings from the primary somatosensory forepaw cortex in awake mice and show that L2/3 and L5 excitatory neurons have layer-specific intrinsic properties and membrane potential dynamics that shape laminar-specific firing rates and subthreshold synchrony. First, while sensory and movement-evoked synaptic input was tightly correlated across layers, spontaneous action potentials and slow spontaneous subthreshold fluctuations had laminar-specific timing; second, longer duration forepaw movement was associated with a decorrelation of subthreshold activity; third, spontaneous and sensory-evoked forepaw movements were signaled more strongly by L5 than L2/3 neurons. Together, our data suggest that the degree of translaminar synchrony is dependent upon the origin (sensory, spontaneous, and movement) of the synaptic input.
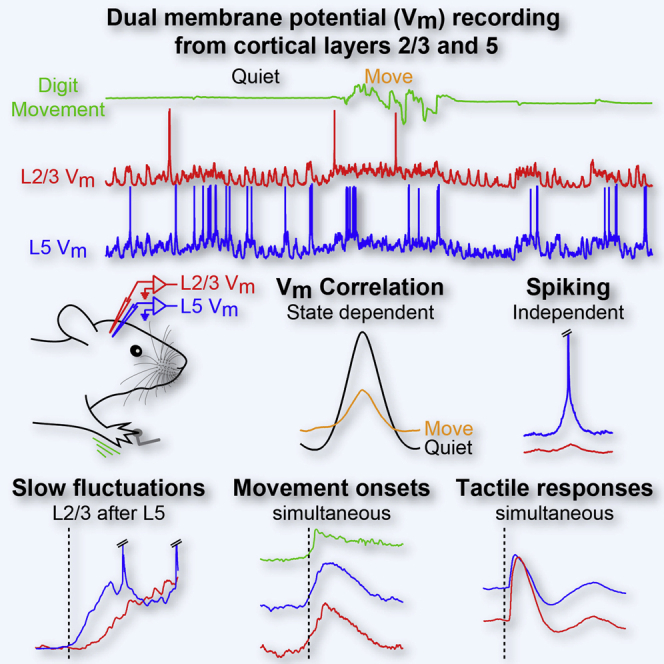
Graphical Abstract
Highlights
-
•
We made dual whole-cell recordings from L2/3 and L5 cortical neurons in behaving mice
-
•
Layer-specific membrane properties determine higher mean firing rates of L5 neurons
-
•
Synchrony of translaminar synaptic activity is determined by the origin of input
-
•
L5 neurons signal spontaneous and sensory-triggered movements
Zhao et al. use dual whole-cell recordings from primary somatosensory cortical excitatory neurons in layers 2/3 and 5 in awake mice to identify layer-specific cellular properties and firing rates, and they show that translaminar membrane potential synchrony is dependent both on behavioral state and the source of the synaptic input.
Introduction
Primary sensory cortex is composed of six layers of interconnected microcircuits. Gain- and loss-of-function experiments have shown laminar-specific effects on local cortical processing (Beltramo et al., 2013, Olsen et al., 2012), but how the layers work together remains unclear. The synchrony of action potential (AP) firing across cortical layers is thought to be a fundamental aspect of translaminar processing and is determined by the strength, sign and timing of the underlying synaptic input. Here, we investigate the synaptic mechanisms of cortical synchrony between excitatory neurons in layers 2/3 and 5 in behaving mice.
Measuring translaminar membrane potential (Vm) synchrony and linking it to sensory processing and behavior require simultaneous Vm recordings from different layers in awake animals. However, the vast majority of Vm recordings of cortical neurons in behaving animals have been made from superficial layers (Bennett et al., 2013, Crochet and Petersen, 2006, Gentet et al., 2010, Polack et al., 2013, Poulet and Petersen, 2008, Poulet et al., 2012, Reimer et al., 2014, Zhou et al., 2014). These studies have shown that internally generated, spontaneous network activity dominates the Vm of cortical neurons across cortical regions and is correlated with the behavioral and arousal state. Large-amplitude, slow fluctuations are highly correlated between neighboring layer 2/3 (L2/3) neurons in resting animals but are abolished during movement, resulting in a desynchronized or “active” cortical state (Harris and Thiele, 2011, Poulet and Petersen, 2008). The active state may result from arousal-related effects associated with movement and has been linked to a modulation in sensory responsiveness (Crochet and Petersen, 2006, Otazu et al., 2009, Pinto et al., 2013, Polack et al., 2013, Reimer et al., 2014, Schneider et al., 2014, Vinck et al., 2015, Zhou et al., 2014), adaptation (Castro-Alamancos, 2004), and even perception itself (Bennett et al., 2013, McGinley et al., 2015).
Few studies have examined the Vm activity of deeper layer cortical neurons in behaving animals (McGinley et al., 2015, Schiemann et al., 2015). Extracellular recordings, however, have shown higher spontaneous and sensory-evoked firing rates in deeper layer neurons (de Kock et al., 2007, O’Connor et al., 2010) and, intriguingly, that sensory-evoked and spontaneous spiking have different temporal structures across layers (Sakata and Harris, 2009).
The rodent forepaw somatosensory system is a relevant and accessible model system to investigate cortical sensory processing during behavior. The forepaw has five digits (Figure 1A) that can be used to grasp and manipulate objects as well as discriminate somatosensory stimuli (Milenkovic et al., 2014). We made whole-cell recordings from primary forepaw somatosensory cortex L2/3 and L5 excitatory neurons in awake mice to compare the synchrony and integration of external (sensory) and internal (movement-evoked and spontaneous) synaptic input. Our data highlight layer-specific membrane properties that underlie differences in AP firing and show that translaminar Vm synchrony is dependent both on the behavioral state and the source of synaptic input.
Figure 1.

Distinct Membrane Properties of L2/3 and L5 Cortical Pyramidal Neurons
(A) Image of the glabrous skin of the right forepaw showing five digits (D1–D5), three central pads (P1–P3), the thenar pad (TH), and the hypothenar pad (HT) (Waters et al., 1995). Scale bar, 1 mm.
(B) Cartoon schematic showing head-fixed awake mouse with recording electrodes in red (L2/3) and blue (L5), with forepaw digit movement (green) monitored by the sensing arm (gray) that was also used for tactile stimulation.
(C) Biocytin reconstructions of L2/3 (red) and L5 (blue) neurons, with axons in lighter color, next to a histogram showing the depths of all recorded L2/3 and L5 neurons (n = 17 L2/3 neurons and n = 28 L5 neurons) based on micromanipulator reading and biocytin staining.
(D) Three single trial responses of a L2/3 (red) and a L5 (blue) pyramidal neuron to intracellular current injection with different amplitudes (from top to bottom: +400 pA, +300 pA, and +200 pA). The L2/3 example corresponds to the reconstructed L2/3 neuron in (C). Horizontal lines indicate −60 mV for L2/3 and L5.
(E) Plotting the evoked spike rate as a function of current injection amplitude reveals that L5 neurons are more excitable than L2/3 neurons. Filled circles with error bars show mean ± SEM.
(F) L5 neurons have a significantly larger input resistance than L2/3 neurons during hyperpolarizing current injection. Open circles show individual cells.
(G) L5 neurons show a significantly larger amplitude hyperpolarization following positive current injection (afterhyperpolarization [AHP]) than L2/3 neurons at all current amplitudes tested.
For all panels, ∗p < 0.05, ∗∗p < 0.01, and ∗∗∗p < 0.001.
Results
Distinct Intrinsic Membrane Properties of L2/3 and L5 Primary Somatosensory Forepaw Cortical Excitatory Neurons
To investigate the intrinsic membrane properties of L2/3 and L5 excitatory neurons, we made blind whole-cell patch clamp recordings targeted to the digit 3 cortical representation in primary somatosensory forepaw cortex (S1) in awake mice. Mice were head-restrained and had their right forepaw tethered to the platform (Figure 1B). The tips of the digits 2 and 4 overhung the edge of the platform while the tip of digit 3 was positioned on a flat, circular head of a combined movement sensor and force-feedback tactile stimulating arm. The stimulating arm head was held in contact with the glabrous skin of digit 3 throughout all recordings. Whole-cell recordings from 17 L2/3 neurons were made at subpial depths between 121 and 384 μm (245.30 ± 17.91 μm) and from 28 L5 neurons between 538 and 823 μm (649.43 ± 14.28 μm) (Figure 1C). All neurons had evoked regular-spiking firing patterns during current injection, and a subset (L2/3 = 4/17 and L5 = 15/28 neurons) was confirmed by post hoc biocytin staining to be excitatory pyramidal neurons.
We first examined the intrinsic membrane properties soon after break-in during quiet wakefulness. L5 neurons generated more APs in response to equivalent current injection amplitudes than L2/3 neurons (Figures 1D and 1E). The increased excitability may be due to the higher resting Vm value of L5 neurons during quiet wakefulness (L2/3Mean = −56.92 ± 1.21 mV, n = 12 cells versus L5Mean = –50.70 ± 0.65 mV, n = 19 cells; p < 0.001) and their higher input resistance (Figure 1F; L2/3I/R = 33.46 ± 2.80 MΩ, n = 11 cells versus L5 = 51.66 ± 3.35 MΩ, n = 18 cells; p < 0.001). Interestingly, following the termination of a depolarizing current step, L5 neurons showed a larger-amplitude afterhyperpolarization than L2/3 neurons (Figure 1G; at 400 pA: L2/3AHP = 0.56 ± 0.12 mV, n = 10 cells versus L5AHP = 2.42 ± 0.17 mV, n = 22 cells; p < 0.001). Overall, our data show distinct intrinsic membrane properties of forepaw S1 L5 and L2/3 neurons.
Layer-Specific Vm Dynamics during Forepaw Behavior
We next compared the Vm properties and dynamics of L2/3 and L5 neurons during forepaw behavior. Spontaneous digit movements were monitored by the sensing arm and used to define periods of quiet wakefulness (Q) and digit movement (M) (see Experimental Procedures). Q was characterized by large-amplitude, low-frequency Vm fluctuations observed in all recordings from neurons in both layers (Figure 2A). Slow fluctuations had a similar mean duration across layers (L2/3 329.06 ± 27.55 ms, n = 13 cells versus L5 266.94 ± 11.15 ms, n = 23 cells) but lower frequency in L2/3 (L2/3 2.03 ± 0.08 Hz, n = 13 cells versus L5 2.29 ± 0.04 Hz, n = 23 cell; p = 0.005) (Figure S1). In both layers, M was accompanied by a reduction in the amplitude of low-frequency fluctuations, with fast Fourier transform analysis highlighting a reduction in the power in the 1 to 5 Hz range (Figures 2B and 2C), and a reduction in the SD of the Vm (Figure 2D). Mean AP firing rates were higher in L5 than L2/3 neurons during Q (Figure 2E; L2/3FR, Q = 0.32 ± 0.10 Hz, n = 12 cells versus L5FR, Q = 2.86 ± 0.60 Hz, n = 19 cells; p < 0.001). Moreover, a significant increase in mean firing rates during M was observed in L5 neurons (L5FR Q = 2.86 ± 0.60 Hz versus M = 6.14 ± 1.16 Hz, n = 19 cells, p = 0.005), but not L2/3 (L2/3FR Q = 0.32 ± 0.10 Hz versus M = 0.45 ± 0.18 Hz, n = 12 cells; p = 0.851). Inter-spike intervals (ISIs) showed a skewed distribution in both layers, with ∼22% of L2/3 APs and ∼30% of L5 APs having an ISI of <25 ms (Figure S2). We next analyzed AP bursting and observed similar burst durations across layers but overall more busts in L5 neurons. No differences were observed between Q and M periods (burst frequency L2/3BF, Q = 0.02 ± 0.004 Hz, M = 0.03 ± 0.01 Hz, n = 13 cells versus L5BF, Q = 0.14 ± 0.05 Hz, M = 0.25 ± 0.12 Hz, n = 23 cells, L2/3 versus L5 Q, p = 0.019; Figure S2).
Figure 2.

Laminar-Specific Vm Dynamics of L2/3 and L5 Neurons during Forepaw Behavior
(A) Example whole-cell recordings from a L2/3 neuron (red) and L5 neuron (blue) with the digit movement (green) measured by the stimulator/sensing arm in contact with the glabrous skin of forepaw digit 3.
(B) Population average fast Fourier transforms (FFTs) of the Vm of L2/3 and L5 neurons during quiet wakefulness (black) and digit movement (orange).
(C) Power of low-frequency activity (1–5 Hz) in the quiet (Q) and moving (M) state shows a significant reduction during digit movement in both L2/3 and L5 neurons. Filled circles with error bars show mean ± SEM, and lines represent individual neurons.
(D) SD of the Vm was significantly reduced during forepaw movement in both L2/3 and L5 neurons.
(E) L5 neurons showed an overall higher AP firing rate than L2/3 neurons in quiet and moving mice and a significant increase in AP firing rate during movement.
(F) AP threshold was not significantly different at rest and during movement in L2/3 and L5 neurons.
(G) Both L2/3 and L5 neurons depolarize during digit movement, but L2/3 neurons are more hyperpolarized than L5 neurons in both behavioral states.
(H) The mean firing rate (Q and M periods) of L2/3 and L5 neurons plotted as a function of the distance between AP threshold and the mean value of the maximum 10% of the Vm (Max Vm). Filled circles show the mean value for one cell.
For all panels, ∗p < 0.05, ∗∗p < 0.01, and ∗∗∗p < 0.001. See also Figures S1–S3.
To investigate what drove the laminar differences in mean AP rates, we next examined the AP threshold. AP threshold in L2/3 and L5 neurons varies dependent on the speed of pre-spike depolarization in Vm, with faster depolarizing ramps evoking APs at lower threshold (Figure S3). There was, however, no overall difference in AP threshold between L2/3 and L5 neurons in Q or M periods (Figure 2F). Measurement of the mean Vm showed a depolarization during M in both L2/3 (Figure 2G; L2/3Mean Q = −56.92 ± 1.21 mV versus M = −51.45 ± 1.73 mV, n = 12 cells; p < 0.001) and L5 neurons (L5Mean Q = −50.70 ± 0.65 mV versus M = −45.89 ± 0.80 mV, n = 19 cells; p < 0.001), with L5 neurons significantly more depolarized in both behavioral states (Q L2/3Mean versus L5Mean p < 0.001; M = L2/3Mean versus L5Mean p = 0.006). Notably, plotting the mean spontaneous AP rates as a function of the difference between AP threshold and the mean value of the top 10% of the Vm distribution (max Vm) revealed an exponential decay (Figure 2H). L5 neurons were distributed on the falling slope and L2/3 on the tail of the slope (Figure 2H), suggesting that the simplest explanation for higher firing rates in L5 neurons is their more depolarized Vm. Most likely, this works in combination with the higher input resistance of L5 neurons (Figure 1) to push excitatory postsynaptic potentials over AP threshold and trigger more APs in L5 than L2/3 neurons in behaving mice.
Vm Synchrony across Cortical Layers Is Regulated by Behavioral State
Synchrony of cortical activity across layers is thought to be an important feature of cortical coding. To examine translaminar subthreshold and spiking synchrony, we next inserted two pipettes through neighboring craniotomies to target recording sites in the same vertical axis and made nine simultaneous, dual whole-cell recordings from L2/3 and L5 neurons (Figure 3A). We went on to measure Vm synchrony at different timescales using cross-correlation, coherence analysis, and spike-triggered averaging.
Figure 3.

Vm Synchrony between L2/3 and L5 Neurons Is Dependent on Behavioral State
(A) Example dual whole-cell recording from a L2/3 (red) and a L5 (blue) cortical neuron during digit movement (green).
(B) Mean cross-correlation for the example recording shown in (A), taking L5 as the reference, shows a higher correlation during quiet (Q) than digit movement (M).
(C) Example mean coherence spectrum from the example recording shown in (A) from Q and M periods.
(D) Population mean cross-correlation (n = 9 pairs) during Q and M periods.
(E) Significant reduction in the peak cross-correlation value in M compared to Q periods. Filled circles with error bars show mean ± SEM, lines show data from individual pairs.
(F) The peak time of the cross-correlation shows a positive lag indicating that L5 neurons are active before L2/3 neurons in Q and M periods.
(G) Population mean average of coherence spectrum during Q and M periods (n = 8 pairs).
(H) A significant reduction in coherence from Q to M periods in frequency band 1–5 Hz.
(I) Population Vm average of L2/3 (red) and L5 neurons (blue) centered on APs in L2/3 neurons during quiet (left, n = 8 pairs) and moving (right, n = 4 pairs) periods. Bottom, corresponding population L5 spike-time PSTHs.
(J) Same as (I) but for L5 spike-triggered averages with L2/3 PSTH below (n = 8 pairs).
(K) Quantification of the Vm rise time in L2/3 and L5 neurons between −22 ms and −2 ms before a (left) L2/3 AP and (right) L5 AP in quiet and moving periods. Filled circles show population mean with error bars showing mean ± SEM. Gray lines show values from individual cells.
For all panels, ∗p < 0.05, ∗∗p < 0.01, and ∗∗∗p < 0.001.
Visual inspection of dual Vm recordings and cross-correlation analysis shows that large-amplitude slow fluctuations in resting mice are highly correlated across layers (Figures 3A–3E). As mice went from Q to M, however, the correlation of the Vm between L2/3 and L5 neurons was reduced in all pairs of cells (Figures 3D and 3E). Unexpectedly, the peak time of the cross-correlation showed a significant time lag, indicating that L5 subthreshold activity preceded that in L2/3 by 8.04 ± 1.40 ms in resting mice and by 4.35 ± 1.85 ms during M (Figure 3F). Coherence measurements suggested that the drop in correlation during M was due mostly to the reduction in low-frequency (1–5 Hz) coherence (Figures 3G and 3H). Thus, dual whole-cell recordings showed that subthreshold activity of cortical neurons in awake animals is under dynamic control, with cortical layers becoming more independent during active brain states.
To quantify AP synchrony from dual recordings, we made spike-triggered peri-stimulus time histograms (PSTHs) of spontaneous APs. The chance of observing an AP in a L5 neuron in a 10-ms window around a L2/3 AP is 6.1% during Q and 5.6% during M, and the chance of observing an AP in a L2/3 neuron around a L5 AP is 1.0% during Q and 0.4% during M. Thus, while the chance of observing an AP is dependent upon the firing rate, AP firing appears asynchronous at fast timescales across cortical L2/3 and L5 in awake mice. We next examined the synaptic input driving spontaneous APs. In both layers, APs were triggered by large-amplitude and cell-specific depolarizing synaptic input (Figures 3I–3K). At the time of the AP, a slow, small-amplitude depolarization was observed in the simultaneously recorded cell in resting mice, necessarily induced by the slow network fluctuations. A similar picture was present during movement: APs were triggered by large-amplitude, depolarizing inputs in the spiking cell that were absent in the simultaneously recorded neuron. These observations provide a synaptic basis for independent laminar spontaneous firing and suggest that spontaneous AP firing in L2/3 and L5 excitatory neurons is driven by sparsely connected excitatory networks.
L5 Neurons Show an Earlier Onset of Slow Spontaneous Fluctuations
The time lag of the cross-correlation analysis and independent synaptic input during spiking suggested that there might be laminar differences in the fine temporal structure of spontaneous subthreshold fluctuations. We therefore first compared the onset timing of the slow depolarizing fluctuations in resting mice from dual L2/3 and L5 recordings (Figures 4A and 4B). We defined a slow depolarizing event (SDE) as depolarizing epochs in Q periods whose average Vm level between onset and offset was >60% of the Vm range between the most hyperpolarized and depolarized values for at least 100 ms. Plotting the duration and Vm of isolated SDEs across seven dual recordings as a heatmap (Figures 4B and S4) revealed a range of durations with a mean of ∼300 ms (Figure S1B for single and dual recordings, L2/3 = 329.06 ± 27.55 ms, n = 13 cells, L5 = 266.94 ± 11.15 ms, n = 23 cells, p = 0.086). Normally a SDE in one neuron was accompanied by a SDE in the simultaneously recorded neuron, but a minority of small-amplitude, short-duration SDEs were observed in one layer only (Figure S5), likely accounting for the slightly shorter durations of SDEs in L5. In those SDEs with a measureable Vm onset in both layers, plotting the trial-by-trial onset times (Figure 4C; Supplemental Experimental Procedures), the population averaged Vm (Figure 4D) and population spiking rates (Figure 4E) revealed that L5 SDEs started earlier than those in L2/3 (Figure 4F; L5 leading L2/3 = 9.07 ± 2.19 ms, n = 7 pairs, p = 0.031). In contrast, the hyperpolarizing offset time was not significantly different across layers when SDEs were triggered on L2/3 onset (Figures 4A and 4F). SDEs thus have an earlier onset in higher-firing L5 neurons, supporting the proposal that L5 neurons are important drivers of supragranular slow network activity (Beltramo et al., 2013, Sanchez-Vives and McCormick, 2000).
Figure 4.

Slow Depolarizing Fluctuations during Quiet Wakefulness Have an Earlier Onset in L5 Neurons
(A) Example slow depolarizing events (SDEs) from a dual L2/3 (red) and L5 (blue) whole-cell recording in an awake, resting mouse. Vm traces are aligned to the onset (left) and offset (right) of the SDE in the L2/3 neuron, and bottom traces show Vm averages. Note that L5 leads at the onset, but not the offset, of the SDEs. Horizontal lines indicate Vm (mV) for L2/3 and L5 (trial 1 onset, −69.3/−63.1 mV and offset, −47.7/−44.7 mV; trial 2 onset, −59.3/−59.1 mV and offset, −40.0/−37.7 mV; trial 3 onset, −60.9/−57.0 mV and offset, −31.8/−31.7 mV; trial 4 onset, −59.7/−56.4 mV and offset, −42.0/−37.7 mV; and trial 5 onset, −58.3/−55.7 mV and offset, −40.0/−30.1 mV). Average onset, −60.0/−52.6 mV and offset, −41.9/−37.0 mV. APs have been truncated.
(B) Plots of selected SDEs from seven dual whole-cell recordings. SDEs were aligned at threshold crossing at the onset (left) and offset (right) of the SDE in the L2/3 neuron and arranged by duration. Top boxes show L2/3 data, and bottom boxes show L5 with colors corresponding to the normalized Vm from minimum (blue) to maximum (red) values.
(C) Population distribution (top) and trial-by-trial measurements (bottom) of the subthreshold onset (left) and offset (right) times in L5 neurons relative to the onset and offset times in L2/3, respectively (n = 7 dual recordings). Onset and offset times were estimated by the 5% level of a sigmoidal fit to the Vm at onset and offset (see Supplemental Experimental Procedures for details).
(D) Population average of the normalized Vm SDEs in L2/3 and L5 relative to the threshold-crossing at onset and offset of the L2/3 neuron.
(E) Population peri-SDE time histogram of AP times from the dataset used in (D).
(F) Population analysis of onset and offset times relative to the L2/3 SDE shows a significantly earlier onset in L5 but similar offset times. To calculate the onset/offset timing difference, we first measured the time of SDE onset/offset relative to the time of threshold crossing of the L2/3 SDE. Then, we subtracted the population mean L2/3 onset/offset time from all values. Filled circles with error bars show mean ± SEM, and lines show data from individual pairs.
For all panels, ∗p < 0.05, ∗∗p < 0.01, and ∗∗∗p < 0.001. See also Figures S4 and S5.
Movement Onset Triggers Synchronous Input across Layers
Is the laminar-specific synaptic input observed during AP firing (Figure 3) and spontaneous activity (Figure 4) a general feature of subthreshold processing in cortical neurons, or are there other sources of more synchronized synaptic input? Movement triggers an active, desynchronized cortical state, which can be driven by thalamic input (Poulet et al., 2012). To examine the fast dynamics of movement related synaptic input across layers, we next analyzed the Vm dynamics at M onset (detected by thresholding the first derivative of the digit movement signal; Supplemental Experimental Procedures). Averaging the Vm showed that M onset is accompanied by simultaneous depolarizing synaptic input to L2/3 and L5 neurons (Figures 5A and 5B). Close inspection of the log-scale digit movement trace indicated that the depolarization in both layers was tightly coupled to the tiny initial movements of the digits and did not appear before movement. To quantify the timing of the depolarization, we performed cross-correlation analysis between the averaged digit movement and the averaged Vm response at M onset. The peak of the cross-correlation showed no significant time lag (Figure 5B), suggesting an internal, non-sensory origin for synaptic input at movement onset.
Figure 5.

Movement Onset Synchronizes Synaptic Input across Layers and Results in an Increase in L5 AP Rate
(A) Population Vm average responses of L2/3 (red) and L5 (blue) neurons to onset of spontaneous digit movement (green shows the rectified first derivative of the digit movement (digitFD); n = 11 L2/3 cells and n = 19 L5 cells, from single and dual recording experiments). Movement onsets (dashed vertical line) were detected via thresholding of digitFD (see Experimental Procedures).
(B) Peak cross-correlation between the digitFD and the Vm shows no significant time lag between layers, indicating synchronous depolarization. Filled circles with error bars show mean ± SEM, and open circles show individual cells.
(C) Mean population AP rates over time with respect to movement onset from L2/3 and L5 neurons.
(D) L5 neurons show a significantly higher AP firing rate after movement onset (between 0 and 1 s) than L2/3 neurons.
(E) Population average of the variance of the Vm over time with respect to movement; gray sections and numbers show time points for analysis in (F).
(F) L2/3 and L5 neurons show a significant reduction in the Vm variance following movement onset; the two measurement time windows (1 and 2) are indicated in (E).
For all panels, ∗p < 0.05, ∗∗p < 0.01, and ∗∗∗p < 0.001.
Analysis of 2-s epochs of Vm activity showed an overall reduction in the SD of the Vm during extended M periods (Figure 2), but how fast this occurs was unclear. We therefore quantified the variance of the L2/3 and L5 subthreshold activity around all recorded M onsets, including short-duration movements (Figures 5E and 5F). In all cells across both layers, we observed a rapid and robust reduction in variance within the first 200 ms of movement onset. Thus, early movement-evoked input acts to reduce subthreshold variability simultaneously across cortical layers. The reduction in variance, however, does not result in synchronous AP firing. Instead, L5 neurons showed higher firing rates after movement onset than L2/3 neurons (Figures 5C and 5D). Thus, unlike the laminar-specific Vm dynamics during SDEs and spontaneous APs, movement onset triggers simultaneous Vm depolarization across layers, which results in an increase in firing only in L5 neurons.
Tactile Stimulation Evokes Correlated Synaptic Input across Layers
Another major source of synaptic input to S1 is sensory-evoked thalamic input. Thalamo-cortical axons are unequally distributed across the cortical layers, with some L5 neurons receiving direct thalamic input (Bureau et al., 2006, Constantinople and Bruno, 2013). We therefore next examined whether there is laminar specificity in sensory processing across layers in behaving animals. We delivered brief (2 ms), light (10 mN) tactile stimuli via the stimulating/sensing arm to digit 3 during single and dual whole-cell recordings. The sensing arm was in constant contact with the glabrous skin of digit 3. Tactile stimulation evoked a subthreshold response in all cells. While the first spike latency was similar for both behavioral conditions and layers (Figure S6B), the amplitude of the Vm response was strongly dependent on the behavioral state (Figures 6A–6D). In Q periods, stimuli evoked a large-amplitude depolarizing response in both layers, whereas the amplitude of the response was reduced during M (Figures 6C and 6E; L2/3Amp Q = 10.80 ± 0.65 mV, M = 4.84 ± 1.24 mV, n = 10 cells, p = 0.037; L5Amp Q = 6.19 ± 0.69 mV, M = 2.41 ± 0.60 mV, n = 20 cells, p = 0.001; Q L2/3Amp versus L5Amp p < 0.001, and M L2/3Amp versus L5Amp p = 0.005). Despite the difference in subthreshold response amplitude, tactile stimulation evoked few extra APs over the background rate in both layers in both behavioral conditions (Figures 6D, 6F, and S6A; L2/3AP Q = 1.59 ± 0.62 Hz, M = 1.95 ± 1.36 Hz, n = 10 cells, p = 0.375; L5AP Q = 2.44 ± 1.40 Hz, M = 1.55 ± 1.16 Hz, n = 20 cells, p = 0.370; Q L2/3AP versus L5AP p = 0.613, M L2/3AP versus L5AP p = 0.523).
Figure 6.

Tactile-Evoked Subthreshold Responses Are Highly Correlated across Cortical Layers and Modulated by Behavioral State
(A) Single-trial tactile-evoked responses from a dual L2/3 (red) and L5 (blue) whole-cell recording during quiet wakefulness (left) and movement (right).
(B) Top: mean Vm tactile-evoked response of example neurons in (A) during quiet wakefulness and movement shows reduction in amplitude during moving periods. Bottom: corresponding PSTH of AP firing.
(C) Population averaged subthreshold tactile-evoked response during quiet wakefulness and movement.
(D) Population PSTH from L2/3 and L5 to tactile stimulation during quiet wakefulness and movement.
(E) L2/3 and L5 neurons show a decrease in tactile-evoked subthreshold response amplitude as mice go from quiet (Q) to movement (M). Filled circles with error bars show mean ± SEM. Lines show individual cells.
(F) Population analysis of background-subtracted AP firing rates to tactile stimulation of the forepaw shows no difference between Q (left) and M (right) periods in both layers. AP rate measured as the difference between the 100 ms before and 100 ms after stimulus onset.
(G) The subthreshold tactile-evoked reversal potential shows no significant difference between layers or behavioral states.
(H) Absolute AP rate in the 100 ms after stimulus onset plotted as a function of the difference in Vm between AP threshold and the tactile stimulus-evoked response reversal potential. Filled circles show mean value of individual cells.
(I) Subthreshold tactile-evoked response latencies of L2/3 and L5 neurons are not significantly different.
(J) Amplitude of L2/3 subthreshold tactile-evoked responses plotted against the amplitude of L5 subthreshold responses from the example pair in (A) shows highly correlated response amplitudes during Q (black) and M (orange) periods.
(K) Population data of cross-correlation of mean subthreshold tactile-evoked responses (combining Q and M responses) between L2/3 and L5 neurons. Filled circles with error bars show mean ± SEM, and open circles show individual cells.
For all panels, ∗p < 0.05, ∗∗p < 0.01, and ∗∗∗p < 0.001. See also Figures S6 and S7.
To examine why L5 neurons do not fire more APs in response to tactile stimulation despite having a more depolarized Vm, we measured the tactile responses as a function of the Vm just prior to stimulus onset. As neurons became more depolarized, the sensory response reduced in amplitude until eventually showing a hyperpolarizing response (Figure S7). The Vm level for the tactile-evoked reversal potential was similar during Q and M periods and hyperpolarized relative to glutamate reversal potential (Figure 7G, L2/3Rev Q = −46.67 ± 1.60 mV, M = −47.09 ± 1.59 mV, n = 10 cells, p = 0.492; L5Rev Q = −46.17 ± 0.75 mV, M = −46.61 ± 0.86 mV, n = 20 cells, p = 0.412; Q L2/3Rev versus L5Rev p = 0.644, M L2/3Rev versus L5Rev p = 0.775). Notably, a minority of cells with higher mean firing rates showed a smaller difference between AP threshold and the sensory reversal potential (Figure 6H). These data provide an explanation for why the evoked rates are similar across layers and suggest that sensory-evoked GABA-ergic inhibition plays a critical role in defining the sensory reversal potential in both layers (Crochet et al., 2011, Moore and Nelson, 1998).
Figure 7.

Tactile-Evoked Forepaw Movements Are Signaled by L5 Neurons
(A) Mean Vm tactile-evoked responses with corresponding digit movement (green) and PSTHs from an L2/3 (red, top) and an L5 (blue, bottom) neuron in resting, quiet mice that showed no behavioral response (left, quiet-quiet [QQ]) or a short-latency digit movement following the stimulus (right, quiet-movement [QM]).
(B) Grand average tactile-evoked responses from all L2/3 and L5 neurons during QQ and QM trials.
(C) Population PSTHs of firing rates in L2/3 and L5 neurons following tactile stimulation in QQ and QM trials. Note that only L5 neurons show an evoked spiking response in the later phase (300–400 ms after stimulus onset).
(D) The amplitude of the Vm response to tactile stimulation is significantly larger for QM trials than in QQ trials in both L2/3 and L5 neurons. Filled circles with error bars show mean ± SEM. Lines show individual cells.
(E) The mean Vm in the 100 ms before stimulus onset is more hyperpolarized in QM trials than QQ trials in L5, but not in L2/3 neurons.
(F) The mean Vm in the late phase (300–400 ms following tactile stimulation) is significantly more depolarized after a QM trial than a QQ trial in both layers.
(G) Significant increase (background subtracted) in AP firing rates in QM trials as compared to QQ trials in the late phase (300–400 ms following tactile stimulation) in L5 neurons, but not in L2/3 neurons.
For all panels, ∗p < 0.05, ∗∗p < 0.01, and ∗∗∗p < 0.001.
We next examined correlations between the timing and amplitude of sensory-evoked synaptic responses across layers during dual recordings. While the onset latencies of the synaptic and spiking responses to tactile stimulation in L5 neurons were more broadly distributed than in L2/3, there was no significant difference across layers (Figure 6I, L2/3PSPLat = 11.07 ± 0.58 ms, n = 13 versus L5PSPLat = 11.34 ± 0.76 ms, n = 21, p = 0.972; Figure S6B, L2/31stAPLat, Q = 33.78 ± 4.73 ms, n = 8 cells, M = 44.67 ± 8.30 ms, n = 3 cells; L51stAPLat, Q = 39.52 ± 4.72 ms, n = 19 cells, M = 31.10 ± 5.90 ms, n = 9 cells). Moreover, trial-by-trial analysis of the tactile-evoked postsynaptic potential (PSP) showed that subthreshold response amplitudes were highly correlated between L2/3 and L5 neurons (Figures 6J and 6K). Together, these data indicate that, in contrast to SDEs and spontaneous APs, tactile stimulation, like movement onset, triggers synchronized subthreshold input across layers.
L5 Neurons Signal Tactile-Triggered Movements
Following 75.2% of stimuli delivered in Q periods, the mouse’s forepaw remained stationary (quiet-quiet [QQ] trials). However, 24.8% of stimuli in Q periods evoked short-latency (<100 ms) forepaw digit movements (Figure 7), termed quiet-move (QM) trials. We next compared sub- and supra-threshold responses in QQ with QM trials (Figures 7A–7C). Tactile stimulation evoked a short-latency, large-amplitude subthreshold response in QQ and QM trials in both layers (Figures 7A and 7B). Notably, the amplitude of the subthreshold response was larger in QM than QQ trials in both layers (Figure 7D; L2/3 QQ = 10.80 ± 0.65 mV versus QM = 11.83 ± 0.79 mV, n = 10 cells, p = 0.037; L5 QQ = 6.19 ± 0.69 mV versus QM = 8.16 ± 0.78 mV, n = 20 cells, p = 0.002; and QQ L2/3 versus L5 p < 0.001, QM L2/3 versus L5 p = 0.005). Moreover, we observed that the Vm prior to stimulus onset was significantly more hyperpolarized in QM trials than QQ trials in L5, but not in L2/3 neurons (Figures 7E; L2/3 QQ = −57.37 ± 1.36 mV, QM = −58.19 ± 1.58 mV, n = 10 cells, p = 0.232; L5 QQ = –52.53 ± 0.69 mV, QM = −54.24 ± 0.61 mV, n = 20 cells, p = 0.009; and QQ L2/3 versus L5 p = 0.006, QM L2/3 versus L5 p = 0.033). In QQ trials, the peak response was then followed by a brief hyperpolarization and subsequent depolarization peaking at ∼350 ms (Figure 7B). This secondary depolarization was significantly larger in both layers during QM than QQ trials (Figure 7F) and evoked APs in L5, but not L2/3, neurons (Figures 7C and 7G; L2/3 QQ = −0.18 ± 0.13 Hz, QM = −0.12 ± 0.34 Hz, n = 10 cells, p = 0.910; L5 QQ = −0.01 ± 0.24 Hz, QM = 2.66 ± 0.81 Hz, n = 20 cells, p = 0.003; QQ L2/3 versus L5 p = 0.613, QM L2/3 versus L5 p = 0.011). Thus, movements evoked by a tactile input are linked to a more hyperpolarized pre-stimulus Vm, a larger subthreshold early response, and a higher late increase in mean firing rate of L5 neurons.
Discussion
The coordinated activity of six layers of primary sensory cortical neurons underlies sensory perception. Using whole-cell recordings in awake mice, we investigated synaptic mechanisms of translaminar synchronous activity. We show that laminar-specific differences in membrane properties drive distinct firing rates, that translaminar synchrony is dependent both on the behavioral state and the source of synaptic input (spontaneous, sensory, and movement evoked), and that L5 neurons signal spontaneous and tactile-triggered movement.
Vm Determinants of Spontaneous AP Firing Rates
Prior work has observed low firing rates of L2/3 excitatory neurons during synchronized states in resting and anesthetized animals (Barth and Poulet, 2012, Jouhanneau et al., 2014) and no change (Crochet and Petersen, 2006, Polack et al., 2013, Poulet and Petersen, 2008, Zhou et al., 2014) or a reduction (Bennett et al., 2013, Sakata and Harris, 2012) of firing rates during activated cortical states. We observed that L5 neurons have a higher mean spontaneous rate of APs (2.86 ± 0.60 Hz) than L2/3 neurons (0.32 ± 0.09 Hz) in resting mice, supporting previous reports in anesthetized and awake animals (Brecht et al., 2003, Constantinople and Bruno, 2011, de Kock et al., 2007, de Kock and Sakmann, 2009, Manns et al., 2004, O’Connor et al., 2010, Sakata and Harris, 2009), and, in contrast to L2/3, a significant increase in mean firing rates during movement (Figure 2). Previous studies of deeper layers have observed both increases and decreases in firing rates of somatosensory (Curtis and Kleinfeld, 2009, de Kock and Sakmann, 2009) and motor (Carvell et al., 1996, Schiemann et al., 2015, Zagha et al., 2015) cortical neurons during movement.
What synaptic and cellular mechanisms could explain the higher firing rates in L5 neurons? Our whole-cell recordings indicate that higher L5 rates were not the result of an intrinsic difference in AP threshold. Moreover, AP triggered averaging showed that the depolarizing synaptic inputs driving APs had similar amplitudes and dynamics in L2/3 and L5 neurons (Figure 3). Instead, higher mean firing rates in L5 neurons appeared to result from a larger input resistance and a more depolarized Vm, as observed in subsets of L5 pyramidal neurons in vitro (Lefort et al., 2009, Mason and Larkman, 1990), which likely combine to push excitatory input over AP threshold more often than in L2/3 neurons. Because most excitatory connections to pyramidal neurons are small in amplitude (Jouhanneau et al., 2015, Lefort et al., 2009) and the rise time of the depolarization prior to an AP is negatively correlated with AP threshold (Figure S3) (Azouz and Gray, 2000, Poulet and Petersen, 2008), it is likely that coincident synaptic input is required to drive spontaneous AP firing in both layers.
Sensory-Evoked Firing Rates Are Determined by a Hyperpolarized Reversal Potential
In resting mice, the absolute tactile-evoked firing rate was higher in L5 (5.03 ± 1.74 Hz) than L2/3 (1.96 ± 0.75 Hz) neurons, but this was superimposed on different background firing rates. In fact, a brief tactile stimulus added similarly few additional APs to the background rate in both layers (evoked rate: L2/3 1.59 ± 0.62 Hz and L5 2.44 ± 1.40 Hz). Our observation of low evoked rates across layers is similar to prior studies of S1 in anesthetized animals (Barth and Poulet, 2012, Brecht et al., 2003, de Kock et al., 2007, Manns et al., 2004). Higher evoked rates have been observed in “thick tufted” L5 pyramidal neurons (de Kock et al., 2007, Sakata and Harris, 2009). We did not differentiate between subtypes of cortical excitatory L5 neurons, but we did observe a minority (3/20) of L5 neurons with sensory-evoked rates >10 Hz (Figure 6F). Future work targeting whole-cell recordings to within-layer excitatory neuron subtypes in sensory cortex will be of great importance.
Cortical sensory responses are modulated by behavioral state in different sensory systems (Bennett et al., 2013, Crochet and Petersen, 2006, Niell and Stryker, 2010, Otazu et al., 2009, Schneider et al., 2014, Zhou et al., 2014). We report a reduction in subthreshold response amplitude in L2/3 neurons to brief tactile stimuli during movement. We go on to show that L5 neurons also have a reduced subthreshold response during movement (Figure 6). Despite this, the numbers of evoked APs remained the same in both layers during quiet and moving periods. In both layers, subthreshold responses were reduced in amplitude as the baseline Vm values became more depolarized and exhibited a reversal potential more hyperpolarized than AP threshold. Interestingly, in the cells with higher sensory-evoked firing rates, the sensory reversal potential was closer to threshold. Together, this suggests that strong, local GABAergic inhibition plays a significant role in clamping the subthreshold sensory response below AP threshold and regulating AP firing during behavior in both L2/3 (Crochet et al., 2011) and L5 neurons.
Correlated Neural Activity across Cortical Layers
Synchronous activity in cortical networks is thought to be fundamental to sensory processing and perception. Prior work has shown that spontaneous Vm activity in L2/3 neurons during resting states is more correlated than in activated states in behaving or attentive animals (Okun et al., 2010, Poulet and Petersen, 2008). We observed a similar pattern across L2/3 and L5. Neurons showed large-amplitude, highly correlated fluctuations of the Vm during resting periods and an active state with low SD, as well as a reduction in slow fluctuation amplitude and translaminar Vm synchrony (Figures 2 and 3). However, close inspection of the fine timing of subthreshold inputs evoked at different time points revealed differences in the timing of synaptic input across layers. Spontaneous APs were driven by cell-specific, depolarizing inputs (Figure 3). In contrast, movement- (Figure 5) and sensory-driven (Figure 6) synaptic input had a similar timing across layers. Interestingly, slow subthreshold fluctuations in resting mice had an earlier onset in L5, reminiscent of the earlier timing of “UPstate” onsets in deeper layers observed in anesthetized and sleeping animals (Chauvette et al., 2010, Sakata and Harris, 2009), cortical slices (Sanchez-Vives and McCormick, 2000), and extracellular recordings in awake rats (Sakata and Harris, 2009). Thus, the type of input (spontaneous, sensory, or movement evoked) determines the timing of synaptic input across layers.
What mechanisms could explain synaptic timing differences? One possibility is that they result from differences in the wiring supporting spontaneous, sensory, and motor events. In support of this suggestion, a recent anatomical study showed laminar differences in local and long-range cortico-cortical inputs to S1 excitatory neurons (DeNardo et al., 2015). Long-range inputs show laminar matching. L2/3 neurons receive proportionally more input from distant L2/3 neurons than L5 neurons, which receive a greater proportion from distant L5 neurons. Moreover, locally, L2/3 neurons receive a greater proportion of inhibitory inputs than L5 neurons. Upstates in anesthetized animals (Han et al., 2008, Luczak et al., 2007) and slow fluctuations in awake resting animals (Ferezou et al., 2007) are thought to propagate as waves of activity across cortex supported by long-range cortico-cortical connections. Thus, a later onset in L2/3 neurons could result from a combination of lower firing rates, increased inhibitory input, and laminar-specific cortico-cortical wiring. In contrast, because sensory thalamic neurons are driven both by sensory stimulation and movement (Poulet et al., 2012), we suggest that punctate thalamic input drives the synchronized synaptic input following tactile stimuli or movement onset.
L5 Neurons Report Spontaneous and Tactile-Evoked Movement
Subthreshold sensory responses are correlated not only with the behavioral and cortical state but also with the behavioral outcome. Both L2/3 and L5 neurons showed a larger-amplitude subthreshold sensory response in trials that lead to short-latency forepaw movements (QM trials) compared to trials with no movement before or after the stimulus (QQ trials). In L5 neurons, a difference was also observed in the pre-stimulus Vm, with QM trials having a more hyperpolarized value than QQ trials. This suggests that the link between subthreshold response amplitude and behavioral output is due to the prestimulus cortical state rather than delivery of different amplitude stimuli. Our findings resemble recent Vm recordings in auditory cortex during an auditory discrimination go/no-go task, where neurons from L4 and L5 showed more hyperpolarized Vm value in hit trials than in false-positive trials in mice performing an auditory perception task (McGinley et al., 2015). Future experiments could address whether this is the result of a higher signal to noise ratio in a phase of low network activity resulting in an enhanced probability of signal transmission to downstream motor centers.
During evoked movement trials, neurons in both layers showed a prominent late depolarization (Figure 7), with L5 neurons also showing an increase in late spiking. Because forepaw movements necessarily occurred soon after tactile stimulation in QM trials, it was difficult to assess whether the late activity is causally related to the perception of the stimulus (Sachidhanandam et al., 2013), an intrinsic part of the transformation of sensory input to motor output and/or the start of the active cortical state associated with attention or arousal. Examining mice trained to delay sensory-triggered movements will help link late activity to perception and movement.
Functional Consequences
We observed higher background firing rates in L5 neurons but no difference in the numbers of additional, sensory-evoked spikes across layers, suggesting that L2/3 and L5 have distinct sensory coding strategies (Sakata and Harris, 2009). The fine timing differences of synaptic input may be important in the processing of dynamic sensory stimuli and for changes of synaptic strength under spike-time-dependent plasticity rules. Fast, laminar-specific manipulations of synchronized activity in trained mice are now required to define the causal role of translaminar synchrony in perception.
Experimental Procedures
All experiments were approved by the Berlin animal ethics committee and carried out in accordance with European animal welfare law. Head-restrained 6- to 9-week-old C57bl6J mice were paw-tethered, and digit movements were monitored by a force-feedback sensing and stimulating arm. The sensing arm ending was a 4.7-mm-diameter flat disk with one edge pressed up against the glabrous skin of digit 3. Then, 2-ms, 10-mN tactile stimuli were delivered at pseudo-randomized intervals. Blind whole-cell patch-clamp recordings were made from primary somatosensory forepaw cortex located by intrinsic optical imaging. Neurons were processed for biocytin staining using standard histological techniques. Data were analyzed with custom-written scripts in MATLAB and IgorPro. All data were statistically analyzed using non-parametric tests, paired data with a Wilcoxon signed rank test and unpaired data with a Wilcoxon rank sum test. Data are presented as the mean ± SEM unless otherwise stated. See Supplemental Experimental Procedures for further details.
Author Contributions
W.-J.Z. and J.F.A.P. designed the project. W.-J.Z. performed all experiments. J.K. and W.-J.Z. analyzed the data. J.F.A.P. wrote the manuscript, with comments from all coauthors.
Acknowledgments
We thank Janett König for technical help, Sven Blankenburg for help with coherence analysis, and Evgeny Bobrov, Jean-Sebastién Jouhanneau, and Birgit Voigt for comments on an earlier version of the manuscript. This work was funded by a European Research Council starting grant (ERC-2010-StG-260590, to J.F.A.P.), the Deutsche Forschungsgemeinschaft (DFG; Exc 257 NeuroCure, DFG-FOR-1341-BaCoFun and DFG-FOR-2143-Interneuron, to J.F.A.P.), the Fritz Thyssen Foundation, the European Union (3x3Dimaging 323945), and the Helmholtz Association. J.K. is funded by the Humboldt-Universität zu Berlin in the framework of the Excellence Initiative of the BMBF and DFG.
Published: June 2, 2016
Footnotes
Supplemental Information includes Supplemental Experimental Procedures and seven figures and can be found with this article online at http://dx.doi.org/10.1016/j.celrep.2016.05.026.
Supplemental Information
References
- Azouz R., Gray C.M. Dynamic spike threshold reveals a mechanism for synaptic coincidence detection in cortical neurons in vivo. Proc. Natl. Acad. Sci. USA. 2000;97:8110–8115. doi: 10.1073/pnas.130200797. [DOI] [PMC free article] [PubMed] [Google Scholar]
- Barth A.L., Poulet J.F.A. Experimental evidence for sparse firing in the neocortex. Trends Neurosci. 2012;35:345–355. doi: 10.1016/j.tins.2012.03.008. [DOI] [PubMed] [Google Scholar]
- Beltramo R., D’Urso G., Dal Maschio M., Farisello P., Bovetti S., Clovis Y., Lassi G., Tucci V., De Pietri Tonelli D., Fellin T. Layer-specific excitatory circuits differentially control recurrent network dynamics in the neocortex. Nat. Neurosci. 2013;16:227–234. doi: 10.1038/nn.3306. [DOI] [PubMed] [Google Scholar]
- Bennett C., Arroyo S., Hestrin S. Subthreshold mechanisms underlying state-dependent modulation of visual responses. Neuron. 2013;80:350–357. doi: 10.1016/j.neuron.2013.08.007. [DOI] [PMC free article] [PubMed] [Google Scholar]
- Brecht M., Roth A., Sakmann B. Dynamic receptive fields of reconstructed pyramidal cells in layers 3 and 2 of rat somatosensory barrel cortex. J. Physiol. 2003;553:243–265. doi: 10.1113/jphysiol.2003.044222. [DOI] [PMC free article] [PubMed] [Google Scholar]
- Bureau I., von Saint Paul F., Svoboda K. Interdigitated paralemniscal and lemniscal pathways in the mouse barrel cortex. PLoS Biol. 2006;4:e382. doi: 10.1371/journal.pbio.0040382. [DOI] [PMC free article] [PubMed] [Google Scholar]
- Carvell G.E., Miller S.A., Simons D.J. The relationship of vibrissal motor cortex unit activity to whisking in the awake rat. Somatosens. Mot. Res. 1996;13:115–127. doi: 10.3109/08990229609051399. [DOI] [PubMed] [Google Scholar]
- Castro-Alamancos M.A. Absence of rapid sensory adaptation in neocortex during information processing states. Neuron. 2004;41:455–464. doi: 10.1016/s0896-6273(03)00853-5. [DOI] [PubMed] [Google Scholar]
- Chauvette S., Volgushev M., Timofeev I. Origin of active states in local neocortical networks during slow sleep oscillation. Cereb. Cortex. 2010;20:2660–2674. doi: 10.1093/cercor/bhq009. [DOI] [PMC free article] [PubMed] [Google Scholar]
- Constantinople C.M., Bruno R.M. Effects and mechanisms of wakefulness on local cortical networks. Neuron. 2011;69:1061–1068. doi: 10.1016/j.neuron.2011.02.040. [DOI] [PMC free article] [PubMed] [Google Scholar]
- Constantinople C.M., Bruno R.M. Deep cortical layers are activated directly by thalamus. Science. 2013;340:1591–1594. doi: 10.1126/science.1236425. [DOI] [PMC free article] [PubMed] [Google Scholar]
- Crochet S., Petersen C.C.H. Correlating whisker behavior with membrane potential in barrel cortex of awake mice. Nat. Neurosci. 2006;9:608–610. doi: 10.1038/nn1690. [DOI] [PubMed] [Google Scholar]
- Crochet S., Poulet J.F.A., Kremer Y., Petersen C.C.H. Synaptic mechanisms underlying sparse coding of active touch. Neuron. 2011;69:1160–1175. doi: 10.1016/j.neuron.2011.02.022. [DOI] [PubMed] [Google Scholar]
- Curtis J.C., Kleinfeld D. Phase-to-rate transformations encode touch in cortical neurons of a scanning sensorimotor system. Nat. Neurosci. 2009;12:492–501. doi: 10.1038/nn.2283. [DOI] [PMC free article] [PubMed] [Google Scholar]
- de Kock C.P.J., Sakmann B. Spiking in primary somatosensory cortex during natural whisking in awake head-restrained rats is cell-type specific. Proc. Natl. Acad. Sci. USA. 2009;106:16446–16450. doi: 10.1073/pnas.0904143106. [DOI] [PMC free article] [PubMed] [Google Scholar]
- de Kock C.P.J., Bruno R.M., Spors H., Sakmann B. Layer- and cell-type-specific suprathreshold stimulus representation in rat primary somatosensory cortex. J. Physiol. 2007;581:139–154. doi: 10.1113/jphysiol.2006.124321. [DOI] [PMC free article] [PubMed] [Google Scholar]
- DeNardo L.A., Berns D.S., DeLoach K., Luo L. Connectivity of mouse somatosensory and prefrontal cortex examined with trans-synaptic tracing. Nat. Neurosci. 2015;18:1687–1697. doi: 10.1038/nn.4131. [DOI] [PMC free article] [PubMed] [Google Scholar]
- Ferezou I., Haiss F., Gentet L.J., Aronoff R., Weber B., Petersen C.C.H. Spatiotemporal dynamics of cortical sensorimotor integration in behaving mice. Neuron. 2007;56:907–923. doi: 10.1016/j.neuron.2007.10.007. [DOI] [PubMed] [Google Scholar]
- Gentet L.J., Avermann M., Matyas F., Staiger J.F., Petersen C.C.H. Membrane potential dynamics of GABAergic neurons in the barrel cortex of behaving mice. Neuron. 2010;65:422–435. doi: 10.1016/j.neuron.2010.01.006. [DOI] [PubMed] [Google Scholar]
- Han F., Caporale N., Dan Y. Reverberation of recent visual experience in spontaneous cortical waves. Neuron. 2008;60:321–327. doi: 10.1016/j.neuron.2008.08.026. [DOI] [PMC free article] [PubMed] [Google Scholar]
- Harris K.D., Thiele A. Cortical state and attention. Nat. Rev. Neurosci. 2011;12:509–523. doi: 10.1038/nrn3084. [DOI] [PMC free article] [PubMed] [Google Scholar]
- Jouhanneau J.-S., Ferrarese L., Estebanez L., Audette N.J., Brecht M., Barth A.L., Poulet J.F.A. Cortical fosGFP expression reveals broad receptive field excitatory neurons targeted by POm. Neuron. 2014;84:1065–1078. doi: 10.1016/j.neuron.2014.10.014. [DOI] [PubMed] [Google Scholar]
- Jouhanneau J.-S., Kremkow J., Dorrn A.L., Poulet J.F.A. In vivo monosynaptic excitatory transmission between layer 2 cortical pyramidal neurons. Cell Rep. 2015;13:2098–2106. doi: 10.1016/j.celrep.2015.11.011. [DOI] [PMC free article] [PubMed] [Google Scholar]
- Lefort S., Tomm C., Floyd Sarria J.-C., Petersen C.C.H. The excitatory neuronal network of the C2 barrel column in mouse primary somatosensory cortex. Neuron. 2009;61:301–316. doi: 10.1016/j.neuron.2008.12.020. [DOI] [PubMed] [Google Scholar]
- Luczak A., Barthó P., Marguet S.L., Buzsáki G., Harris K.D. Sequential structure of neocortical spontaneous activity in vivo. Proc. Natl. Acad. Sci. USA. 2007;104:347–352. doi: 10.1073/pnas.0605643104. [DOI] [PMC free article] [PubMed] [Google Scholar]
- Manns I.D., Sakmann B., Brecht M. Sub- and suprathreshold receptive field properties of pyramidal neurones in layers 5A and 5B of rat somatosensory barrel cortex. J. Physiol. 2004;556:601–622. doi: 10.1113/jphysiol.2003.053132. [DOI] [PMC free article] [PubMed] [Google Scholar]
- Mason A., Larkman A. Correlations between morphology and electrophysiology of pyramidal neurons in slices of rat visual cortex. II. Electrophysiology. J. Neurosci. 1990;10:1415–1428. doi: 10.1523/JNEUROSCI.10-05-01415.1990. [DOI] [PMC free article] [PubMed] [Google Scholar]
- McGinley M.J., David S.V., McCormick D.A. Cortical Membrane Potential Signature of Optimal States for Sensory Signal Detection. Neuron. 2015;87:179–192. doi: 10.1016/j.neuron.2015.05.038. [DOI] [PMC free article] [PubMed] [Google Scholar]
- Milenkovic N., Zhao W.-J., Walcher J., Albert T., Siemens J., Lewin G.R., Poulet J.F.A. A somatosensory circuit for cooling perception in mice. Nat. Neurosci. 2014;17:1560–1566. doi: 10.1038/nn.3828. [DOI] [PubMed] [Google Scholar]
- Moore C.I., Nelson S.B. Spatio-temporal subthreshold receptive fields in the vibrissa representation of rat primary somatosensory cortex. J. Neurophysiol. 1998;80:2882–2892. doi: 10.1152/jn.1998.80.6.2882. [DOI] [PubMed] [Google Scholar]
- Niell C.M., Stryker M.P. Modulation of visual responses by behavioral state in mouse visual cortex. Neuron. 2010;65:472–479. doi: 10.1016/j.neuron.2010.01.033. [DOI] [PMC free article] [PubMed] [Google Scholar]
- O’Connor D.H., Peron S.P., Huber D., Svoboda K. Neural activity in barrel cortex underlying vibrissa-based object localization in mice. Neuron. 2010;67:1048–1061. doi: 10.1016/j.neuron.2010.08.026. [DOI] [PubMed] [Google Scholar]
- Okun M., Naim A., Lampl I. The subthreshold relation between cortical local field potential and neuronal firing unveiled by intracellular recordings in awake rats. J. Neurosci. 2010;30:4440–4448. doi: 10.1523/JNEUROSCI.5062-09.2010. [DOI] [PMC free article] [PubMed] [Google Scholar]
- Olsen S.R., Bortone D.S., Adesnik H., Scanziani M. Gain control by layer six in cortical circuits of vision. Nature. 2012;483:47–52. doi: 10.1038/nature10835. [DOI] [PMC free article] [PubMed] [Google Scholar]
- Otazu G.H., Tai L.-H., Yang Y., Zador A.M. Engaging in an auditory task suppresses responses in auditory cortex. Nat. Neurosci. 2009;12:646–654. doi: 10.1038/nn.2306. [DOI] [PMC free article] [PubMed] [Google Scholar]
- Pinto L., Goard M.J., Estandian D., Xu M., Kwan A.C., Lee S.-H., Harrison T.C., Feng G., Dan Y. Fast modulation of visual perception by basal forebrain cholinergic neurons. Nat. Neurosci. 2013;16:1857–1863. doi: 10.1038/nn.3552. [DOI] [PMC free article] [PubMed] [Google Scholar]
- Polack P.-O., Friedman J., Golshani P. Cellular mechanisms of brain state-dependent gain modulation in visual cortex. Nat. Neurosci. 2013;16:1331–1339. doi: 10.1038/nn.3464. [DOI] [PMC free article] [PubMed] [Google Scholar]
- Poulet J.F.A., Petersen C.C.H. Internal brain state regulates membrane potential synchrony in barrel cortex of behaving mice. Nature. 2008;454:881–885. doi: 10.1038/nature07150. [DOI] [PubMed] [Google Scholar]
- Poulet J.F.A., Fernandez L.M.J., Crochet S., Petersen C.C.H. Thalamic control of cortical states. Nat. Neurosci. 2012;15:370–372. doi: 10.1038/nn.3035. [DOI] [PubMed] [Google Scholar]
- Reimer J., Froudarakis E., Cadwell C.R., Yatsenko D., Denfield G.H., Tolias A.S. Pupil fluctuations track fast switching of cortical states during quiet wakefulness. Neuron. 2014;84:355–362. doi: 10.1016/j.neuron.2014.09.033. [DOI] [PMC free article] [PubMed] [Google Scholar]
- Sachidhanandam S., Sreenivasan V., Kyriakatos A., Kremer Y., Petersen C.C.H. Membrane potential correlates of sensory perception in mouse barrel cortex. Nat. Neurosci. 2013;16:1671–1677. doi: 10.1038/nn.3532. [DOI] [PubMed] [Google Scholar]
- Sakata S., Harris K.D. Laminar structure of spontaneous and sensory-evoked population activity in auditory cortex. Neuron. 2009;64:404–418. doi: 10.1016/j.neuron.2009.09.020. [DOI] [PMC free article] [PubMed] [Google Scholar]
- Sakata S., Harris K.D. Laminar-dependent effects of cortical state on auditory cortical spontaneous activity. Front. Neural Circuits. 2012;6:109. doi: 10.3389/fncir.2012.00109. [DOI] [PMC free article] [PubMed] [Google Scholar]
- Sanchez-Vives M.V., McCormick D.A. Cellular and network mechanisms of rhythmic recurrent activity in neocortex. Nat. Neurosci. 2000;3:1027–1034. doi: 10.1038/79848. [DOI] [PubMed] [Google Scholar]
- Schiemann J., Puggioni P., Dacre J., Pelko M., Domanski A., van Rossum M.C.W., Duguid I. Cellular mechanisms underlying behavioral state-dependent bidirectional modulation of motor cortex output. Cell Rep. 2015;11:1319–1330. doi: 10.1016/j.celrep.2015.04.042. [DOI] [PMC free article] [PubMed] [Google Scholar]
- Schneider D.M., Nelson A., Mooney R. A synaptic and circuit basis for corollary discharge in the auditory cortex. Nature. 2014;513:189–194. doi: 10.1038/nature13724. [DOI] [PMC free article] [PubMed] [Google Scholar]
- Vinck M., Batista-Brito R., Knoblich U., Cardin J.A. Arousal and locomotion make distinct contributions to cortical activity patterns and visual encoding. Neuron. 2015;86:740–754. doi: 10.1016/j.neuron.2015.03.028. [DOI] [PMC free article] [PubMed] [Google Scholar]
- Waters R.S., Li C.X., McCandlish C.A. Relationship between the organization of the forepaw barrel subfield and the representation of the forepaw in layer IV of rat somatosensory cortex. Exp. Brain Res. 1995;103:183–197. doi: 10.1007/BF00231705. [DOI] [PubMed] [Google Scholar]
- Zagha E., Ge X., McCormick D.A. Competing neural ensembles in motor cortex gate goal-directed motor output. Neuron. 2015;88:565–577. doi: 10.1016/j.neuron.2015.09.044. [DOI] [PMC free article] [PubMed] [Google Scholar]
- Zhou M., Liang F., Xiong X.R., Li L., Li H., Xiao Z., Tao H.W., Zhang L.I. Scaling down of balanced excitation and inhibition by active behavioral states in auditory cortex. Nat. Neurosci. 2014;17:841–850. doi: 10.1038/nn.3701. [DOI] [PMC free article] [PubMed] [Google Scholar]
Associated Data
This section collects any data citations, data availability statements, or supplementary materials included in this article.