

Summary
Global demethylation is part of a conserved program of epigenetic reprogramming to naive pluripotency. The transition from primed hypermethylated embryonic stem cells (ESCs) to naive hypomethylated ones (serum-to-2i) is a valuable model system for epigenetic reprogramming. We present a mathematical model, which accurately predicts global DNA demethylation kinetics. Experimentally, we show that the main drivers of global demethylation are neither active mechanisms (Aicda, Tdg, and Tet1-3) nor the reduction of de novo methylation. UHRF1 protein, the essential targeting factor for DNMT1, is reduced upon transition to 2i, and so is recruitment of the maintenance methylation machinery to replication foci. Concurrently, there is global loss of H3K9me2, which is needed for chromatin binding of UHRF1. These mechanisms synergistically enforce global DNA hypomethylation in a replication-coupled fashion. Our observations establish the molecular mechanism for global demethylation in naive ESCs, which has key parallels with those operating in primordial germ cells and early embryos.
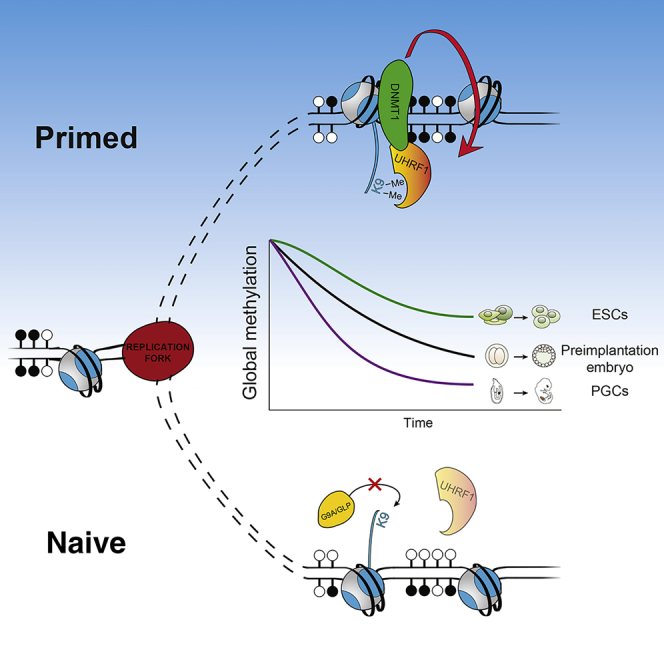
Graphical Abstract
Highlights
-
•
Impaired DNA methylation maintenance is the cause of global demethylation in naive ESCs
-
•
Loss of H3K9me2 and UHRF1 lead to impaired maintenance targeting to replication foci
-
•
TET enzymes are not required for global demethylation
-
•
Mathematical model accurately predicts global 5mC and 5hmC during epigenetic resetting
Global demethylation during epigenetic reprogramming in preimplantation embryos, primordial germ cells, and naive embryonic stem cells is a consequence of impaired DNA methylation maintenance and synergistically regulated by a decrease in UHRF1 and H3K9me2 levels, while locus specific methylation maintenance is guided by specific recruitment of UHRF1 to H3K9me2/3. TET enzymes are dispensable for global DNA methylation reprogramming.
Introduction
Pluripotency describes the transient embryonic potential to form all embryonic germ layers and the germline, excluding the extra-embryonic tissues (Smith, 2001). This state can be recapitulated in vitro in mouse embryonic stem cells (ESCs) derived from the inner cell mass (ICM), maintaining their pluripotent, self-renewing state and the ability to contribute to chimeric embryos (Martello and Smith, 2014). Dictated by the culture conditions, mouse ESCs can adopt two interconvertible states resembling two slightly different in vivo developmental stages. While originally mouse ESCs were grown in serum/leukemia inhibitory factor (LIF)-containing media (“serum ESCs”), recently, serum-free culture conditions have been established that favor derivation and propagation of mouse ESCs in the absence of serum (Ying et al., 2008). These conditions rely on specific inhibition of GSK3beta and Erk1/2 and downstream signaling by two small-molecule inhibitors (“2i ESCs”). 2i ESCs transcriptionally closely resemble cells from the ICM (Nichols and Smith, 2012), and serum ESCs tend to phenocopy cells from the early epiblast and show a greater heterogeneity and differential expression of pluripotency and differentiation factors, resulting in overt and spontaneous differentiation if not held back by LIF (Canham et al., 2010, Singh et al., 2007, Tang et al., 2010). Accordingly, the state of 2i ESCs has been designated the “ground- or naive-state” of pluripotency, and cells grown in 2i are believed to be a much better representation of the cells from the ICM, compared to “primed” serum ESCs (Marks et al., 2012, Martello and Smith, 2014).
In vivo, acquisition of pluripotency in both primordial germ cells (PGCs) and the early embryo coincides with genome-wide epigenetic reprogramming of histone modifications and DNA hypomethylation (Guo et al., 2014, Kobayashi et al., 2012, Kobayashi et al., 2013, Seisenberger et al., 2012, Smith et al., 2014). During the in vitro transition of ESCs from serum to 2i, the epigenome is also globally reprogrammed, with loss of H3K27me3 at repressed promoters, but only minor changes in H3K4me3 and H3K9me3 (Marks et al., 2012). Recently, we and others showed that the genome of 2i ESCs is globally hypomethylated and as such similar to the cells in the ICM, whereas serum ESCs are hypermethylated (Ficz et al., 2013, Habibi et al., 2013, Hackett et al., 2013a, Leitch et al., 2013). To date, the molecular mechanisms regulating this conserved (Guo et al., 2014, Takashima et al., 2014, Wang et al., 2014) genome-wide demethylation in the naive state are unclear.
In the current study, we have revisited this transition and embarked on a comprehensive, time-resolved experimental and mathematical approach to reveal and verify the kinetics and interplay between the different components of the DNA demethylation machinery and to unravel the mechanistic regulation of the main pathway responsible for genome-wide DNA demethylation.
Results
Demethylation Dynamics during Serum-to-2i Reprogramming
DNA demethylation dynamics can be attributed to three major pathways (Wu and Zhang, 2014): (1) maintenance DNA methylation or replication dependent passive dilution, (2) de novo DNA methylation, and (3) active DNA demethylation, primarily via DNA hydroxymethylation (Figure 1A). During the conversion from serum to 2i ESCs, the maintenance methylation components Dnmt1 and Uhrf1, the ten-eleven translocation (TET) enzymes (Tet1, Tet2, and, at low levels, Tet3), Aicda, and Tdg, which have all been implicated in active DNA demethylation, are expressed at similar transcriptional levels. In contrast, the de novo methylases Dnmt3a/b and their regulator Dnmt3l are suppressed in the 2i state (Figures 1B and S1A).
Figure 1.

Dynamic Regulation of 5mC and 5hmC during Serum-to-2i Conversion of Mouse ESCs
(A) Schematic representation of cytosine methylation/demethylation cycle. Different forms of modified CpG dyads and the corresponding processes are indicated.
(B) Expression levels of genes involved in the DNA methylation machinery during serum-to-2i transition. Error bars indicate mean ± SD from three biological replicates.
(C) Percentage of 5mC (top) and 5hmC (bottom) as measured by LC-MS in E14 during serum-to-2i conversion. Error bars indicate mean ± SD from three biological replicates.
(D) Percentage of 5mC methylation as measured by RRBS in E14 during serum-to-2i conversion. Horizontal bars represent the median values.
(E) Graphical representation of the mathematical modeling. The minimum mean square error (MMSE) is plotted against different values for de novo methylation (p1) and maintenance methylation (p2).
(F) Overlay of the mathematical model predictions (dotted line) with real measurements (red line) obtained from LC-MS in E14 during serum-to-2i conversion. The table summarizes the results of the mathematical modeling, showing the values estimated for p1, p2, and p3 in the serum steady state and in 2i. p1, proportion of unmethylated CpGs that become hemi-methylated per average cell division; p2, proportion of hemi-methylated CpGs that become fully methylated per average cell division; and p3, proportion of methylated CpGs that become hydroxymethylated per average cell division.
To further understand the kinetics of the transition from serum to 2i ESCs, we determined their DNA methylation state at several time points. First, we quantified global levels of 5-methylcytosine (5mC) and 5-hydroxymethylcytosine (5hmC) by liquid chromatography followed by mass spectrometry (LC-MS) (Figure 1C) as well as by reduced representation bisulfite sequencing (RRBS) (Figure 1D), whole-genome bisulfite sequencing (WGBS), and TET-assisted bisulfite sequencing (TAB-seq) (Figures S1B and S1C). In line with our previous studies (Ficz et al., 2013, Habibi et al., 2013), DNA demethylation rapidly ensued after medium replacement (∼32 hr; about two rounds of replication) and thereafter continued gradually, reaching a steady-state level after 14 days (Figure 1C). A moderate increase in 5hmC levels was observed up to 72 hr, suggesting the presence of TET activity.
Mathematical Modeling of DNA Demethylation Kinetics
To dissect the role and relative contribution of the three pathways and the various regulatory factors involved, we used mathematical modeling to predict DNA demethylation throughout the time course. Since the first population-epigenetic models for DNA methylation dynamics were published (Otto and Walbot, 1990, Pfeifer et al., 1990), several studies were undertaken to improve the predictions by using different approaches and incorporating new biological concepts into the models (Arand et al., 2012, Genereux et al., 2005, McGovern et al., 2012, Sontag et al., 2006). Due to the lack of adequate experimental data describing DNA methylation changes genome-wide, previous descriptive and predictive models could not be fuelled with accurate input values and precise estimates of the parameters. To overcome this obstacle and to obtain accurate input values, we performed genome-wide hairpin bisulfite sequencing (Zhao et al., 2014) and combined these with our other sequencing datasets. We calculated the percentages of fully methylated CpG dyads (mCpG/GpCm), hemi-methylated CpG dyads (mCpG/GpC), and unmethylated CpG dyads (CpG/GpC) (Figure S1D; Table S1) as well as the levels of hydroxymethylated CpGs from TAB-seq data and hairpin bisulfite sequencing. These input values along with the global 5mC values from LC-MS were used to estimate the following parameters, which are directly proportional to the enzyme abundance and/or activity and reflect the amount of substrate that is converted to the product: p1, a dynamic proportionality value for de novo methylation; p2, a proportionality constant for maintenance methylation; and p3, a proportionality constant for active demethylation (hydroxymethylation). Through several iterations of fitting the mathematical model to the 5mC data, we were able to estimate the values of the constants for the serum-to-2i transition in E14 ESCs with the lowest minimum mean square error (MMSE) (Figure 1E). The model also takes into account that the rate of de novo methylation (p1) changes gradually (Figure S1E). Using these values, the model recapitulates 5mC dynamics and predicts the dynamics of 5hmC in ESCs with excellent approximation (R2 = 0.99) (Figure 1F, blue panel, dotted line). p1, p2, and p3 reflect the individual activity and overall contribution of the three pathways to the DNA methylation dynamics observed and predicts that maintenance methylation is significantly impaired and a major driver of the DNA demethylation observed (Figure 1F).
Global Demethylation Kinetics in Mutants of the DNA Methylation Machinery
To validate and fully understand the contribution of the individual DNA methylation and demethylation enzymes in the genome-wide epigenetic reprogramming that characterizes the transition from serum to 2i ESCs, we examined the dynamics of this loss of methylation in mouse embryonic stem cells in which one or more of the components of the DNA methylation machinery had been deleted. To this end, we determined the DNA methylation state at several time points in serum and during the transition from serum to 2i ESCs (Figure 2A) with inducible deletion of Dnmt1 (Dnmt1fl/fl); Uhrf1 (Uhrf1fl/fl); Dnmt3a/b (Dnmt3afl/fl × Dnmt3bfl/fl) or constitutive deletion of Aicda (Aicda−/−); Tdg (Tdg−/−); Tet1/2 (Tet1−/− × Tet2−/−); Tet1/2/3 (Tet1−/− × Tet2−/− × Tet3−/−) and in corresponding wild-type control ESCs and compared these to the predictions of our model.
Figure 2.

Global Demethylation Kinetics in Mutants of the DNA Methylation Machinery
(A) Schematic representation of the experimental setup. Mutants for candidate genes related to global demethylation in the serum-to-2i conversion were initially grown in serum medium. At day 0, culture medium was switched to 2i. Cells were harvested after indicated times. DNA was extracted and analyzed for 5mC and 5hmC levels by LC-MS and/or RRBS.
(B) Levels of 5mC in Uhrf1 and Dnmt1 KO ESCs during the serum-to-2i transition, measured by mass spectrometry. The colored box shows the overlay between the mathematical model prediction (dotted line) with p2 = 0% and the normalized measured 5mC data. Error bars indicate mean ± SD from three biological replicates.
(C) Levels of 5mC in inducible Dnmt3a/b KO after induction of deletion in serum media measured by mass spectrometry. The colored box shows the overlay between the mathematical model prediction (dotted line) with p1 = 0% and the normalized measured 5mC data. p2 ≈ 90% since the cells were maintained in serum. Error bars indicate mean ± SD from three biological replicates.
(D) Levels of 5mC in inducible Dnmt3a/b KO during the serum-to-2i transition. The colored box shows the overlay between the mathematical model prediction (dotted line) with p1 = 0% and the normalized measured 5mC data. Error bars indicate mean ± SD from three biological replicates.
(E) Levels of 5mC in Tet1/2/3 KO and controls during the serum-to-2i transition measured by mass spectrometry. The colored box shows the overlay between the mathematical model prediction (dotted line) with p3 = 0% and the normalized measured 5mC data. Error bars indicate mean ± SD from three biological replicates.
(F) Levels of 5hmC in Tet1/2/3 KO and controls during the serum-to-2i transition measured by mass spectrometry. Error bars indicate mean ± SD from three biological replicates.
See also Figure S2.
All mutant ESCs tested displayed global loss of 5mC upon serum-to-2i conversion. We specifically compared the rate of demethylation in ESCs lacking either Dnmt1 or Uhrf1 with control ESCs and observed an increased rate of demethylation (Figure 2B), showing that loss of DNA methylation maintenance results in increased demethylation rates. This supports the prediction from the mathematical model (dotted lines in the colored boxes) and implicates a failure of DNA methylation maintenance in 2i ESCs, albeit not a complete loss. Next, we compared the demethylation kinetics in ESCs lacking Dnmt3a and Dnmt3b. Interestingly, deletion of Dnmt3a/b in serum grown ESCs results in only a marginal decrease in the genomic level of 5mC (Figure 2C), and the kinetics of DNA demethylation are unaltered in the serum-to-2i conversion (Figure 2D), showing that loss of de novo methylation is not responsible for global loss of DNA methylation. Finally, we assessed the contribution of enzymes involved in active demethylation pathways in the serum-to-2i conversion. As predicted by the model, ESCs lacking Tet1/2/3, Tdg, or Aicda showed strikingly similar demethylation dynamics to their wild-type control counterparts (Figures 2E, S2A, and S2B). Since TET-driven oxidation has been previously suggested as a potential driver of demethylation in the serum-to-2i conversion, we confirmed the loss of 5hmC in Tet1/2/3 knockout (KO) cells (Figure 2F). This shows that the TET enzymes are actively oxidizing 5mC during the serum-to-2i conversion but are neither sufficient nor necessary for global DNA demethylation.
Locus-Specific Involvement of TET-Dependent Demethylation
The increased levels of 5hmC during the serum-to-2i conversion as well as publications showing further TET-dependent hypomethylation in vitamin C (vitC)-treated 2i ESCs (Blaschke et al., 2013, Chung et al., 2010, Yin et al., 2013) raised the possibility that TET proteins could contribute to the observed demethylation dynamics. We determined the 5mC and 5hmC levels of ESCs at several time points during the serum-to-2i conversion in the presence or absence of vitC (Figure 3A) and observed a significant increase in 5hmC upon vitC treatment, which resulted in an accelerated rate of demethylation and further global hypomethylation. To confirm that this effect was TET dependent, we measured the levels of 5mC and 5hmC in Tet1/2 KO cells in the presence or absence of vitC (Figure 3B), showing that the increased rate of demethylation (and hydroxymethylation) is dependent on the activity of TET proteins. Using the values of p1 and p2 from E14 ESCs (Figure 1F), we estimated an ∼4-fold increase of active demethylation (p3) in the presence of vitC. Mathematical modeling of the dynamics of 5hmC accurately predicts the observed 5hmC levels during the serum-to-2i conversion in the presence of vitC (Figure S3A).
Figure 3.

TET-Dependent Demethylation Dynamics during Reprogramming of Serum-to-2i ESCs
(A) Percentage of 5mC (top) and 5hmC (bottom) as measured by LC-MS in E14 during serum-to-2i transition in the absence (blue line) or presence of vitC (red line). Error bars indicate mean ± SD from three biological replicates.
(B) Percentage of 5mC (top) and 5hmC (bottom) as measured by LC-MS in Tet1/2 KO during serum-to-2i transition in the absence (gray line) or presence of vitC (green line). Error bars indicate mean ± SD from three biological replicates.
(C) Distribution of 5mC (top) and 5hmC levels (bottom) during the first 32 hr of reprogramming from serum (gray) to 2i (green) or 2i+vitC (orange) measured by WGBS and TAB-seq over high-CpG promoters (HCP), intermediate-CpG promoters (ICP), low-CpG promoters (LCP) and enhancers. For each class of genomic element, only the subset having 5hmC enrichment in serum (T = 0 hr) was considered. The horizontal line within the box plots represents the median.
(D) Average methylation levels over 500-bp tiles in Tet1/2/3 KO cells and corresponding control cells (Tet WT). Tet-dependent regions were identified using k-means clustering.
Having established that exclusively in the presence of vitC TET proteins contribute to global loss of 5mC in the serum-to-2i conversion, we asked whether TET-dependent hydroxymethylation is essential for locus specific demethylation. We performed TAB-seq in parallel to WGBS on the same DNA during the early phase of the time course in the presence or absence of vitC (Figure S3B) as well as RRBS from Tet1/2/3 KO cells and corresponding wild-type control ESCs during different time points of the serum-to-2i conversion (Figure S3C). These datasets confirmed that TET-dependent hydroxymethylation does not significantly contribute to global demethylation, unless their activity was enhanced by vitC (∼3-fold increase in 5hmC in the first 32 hr). We analyzed the distribution of 5mC and 5hmC over functionally distinct genomic regions with 5hmC enrichment in serum (Figure 3C) and stratified promoters into high-, intermediate-, and low-CpG-density promoters (HCP, ICP, and LCP, respectively) (Weber et al., 2007). The majority of HCPs (n = 3,121) are very low methylated in serum, and only a small subgroup are intermediate (n = 143) or intermediate-low (n = 563) methylated, containing some germ cell-specific genes (e.g., Dazl, Prdm14, and Dppa3) (Figure S3D). In the absence of vitC, we observe only minor if any change in 5mC/5hmC levels over any of the three classes of promoters. In the presence of vitC, however, conversion of 5mC to 5hmC is already apparent as early as 4 hr, and the speed of 5mC loss correlates with CpG density and is different for each class. The kinetics of 5mC to 5hmC conversion and subsequent loss of 5hmC (73% loss) is fastest at HCPs, while ICPs show less dramatic changes (32% loss), with substantial loss of 5hmC being apparent only later. At LCPs, 5hmC slowly accumulates over the time period investigated. Enhancers, defined as elements overlapping H3K4me1, H3K27ac, and DNaseI hypersensitivity and excluding transcription start sites (TSS) (±2 kb) in E14 serum ESCs, show 10%–40% 5mC levels in serum ESCs, in line with previous studies showing that enhancers have low abundance of 5mC (Stadler et al., 2011) and follow kinetics similar to ICPs. The largest part of the genome behaves similar to LCPs; conversion to 5hmC and subsequent erasure is very slow (Figure 3C).
Finally, we analyzed the methylome in Tet1/2/3 KO cells. Using k-means clustering on average DNA methylation over 500-bp tiles across the genome, we found a cluster of tiles (n = 3,770) that maintains methylation in Tet1/2/3 KO cells, but not in the corresponding wild-type control cells (Figure 3D). These regions have higher 5mC levels in the Tet1/2/3 KO cells, but we could not identify any significant functional enrichment associated with them (Table S2).
UHRF1 Is Downregulated at the Protein Level during the Serum-to-2i Transition
The mathematical model had predicted that maintenance methylation is significantly impaired and a major driver of the DNA demethylation observed (Figure 1F). Subsequently, we confirmed the rapid demethylation upon deletion of Dnmt1 or Uhrf1 (Figure 2B) and also showed that loss of de novo methylation does not explain the demethylation dynamics observed (Figures 2C and 2D). In order to understand the mechanistic regulation of this impairment, we focused on the individual components of the maintenance methylation machinery, in particular on the role of Uhrf1.
In primordial germ cells, maintenance methylation was reported to be impaired in part by nuclear exclusion of UHRF1 (Seisenberger et al., 2012). We analyzed the subcellular localization of UHRF1 and DNMT1 in ESCs grown in serum and 2i (Figure 4A) and did not detect any nuclear exclusion of either UHRF1 or DNMT1 in ESCs. However, we observed a reduction in the signal intensity of UHRF1 protein in the 2i samples. Our initial transcriptomic analysis of the cells undergoing serum-to-2i transition (Figure 1B) did show that the expression of Dnmt3a and Dnmt3b, together with the catalytically inactive regulatory isoform Dnmt3l, was substantially reduced in 2i, while Uhrf1 mRNA levels were unchanged. In contrast, UHRF1 protein levels were significantly reduced (∼3-fold by western blot; 2-fold by quantitative mass spectrometry) in 2i ESCs (Figures 4B–4D), as were the levels of the de novo DNMTs (Figure S4A). We found heterogeneous expression of UHRF1 in serum and 2i ESCs (Figure 4C), which did not correlate with the expression of the pluripotency marker NANOG (Figure S4B) but can be attributed to the cell-cycle-dependent regulation of UHRF1 (Bonapace et al., 2002). To further confirm the observation that UHRF1 is regulated at the protein level, we generated an ESC line with constitutive overexpression of an UHRF1-GFP fusion protein. Similar to our observations on endogenous UHRF1, fluorescence-activated cell sorting (FACS) analysis of the UHRF1-GFP cell line showed that UHRF1-GFP was expressed in serum ESCs but was rapidly lost upon serum-to-2i conversion (Figures 4E and S4C), while mRNA levels of endogenous Uhrf1 and exogenous Uhrf1-Gfp remained stable (Figure S4D). Interestingly, we also observed a rapid increase of UHRF1-GFP protein levels upon transfer back to serum growth conditions (Figure S4E), suggesting that the changed signaling environment in 2i specifically affects UHRF1 protein stability.
Figure 4.

UHRF1 Is Regulated at the Protein Level in 2i
(A) Cellular localization of UHRF1 (green) and DNMT1 (red) in mouse PGCs (E11.5), serum ESCs, 24-hr 2i ESCs, and long-term (LT) 2i ESCs. DAPI (blue) labels the nucleus. The RGB profiles show the signal intensity for each pixel along the horizontal yellow line.
(B) Western blot analysis for UHRF1 protein in serum and LT 2i ESCs. Relative quantifications of the signal intensities of the bands on the western blot are shown in the bar chart.
(C) Immunofluorescence staining for UHRF1 (green), DNMT1 (red) and DAPI (blue) in serum and LT 2i ESCs. Scale bar represents 20 μm.
(D) Protein levels of UHRF1 detected by protein mass spectrometry (label-free quantification [LFQ]) at different time points during serum-to-2i conversion, relative to serum ESCs. Error bars indicate mean ± SD from two biological replicates.
(E) FACS analysis of UHRF1-GFP fusion protein in ESCs during serum-to-2i conversion. Histograms show the GFP signal intensity at different time points during the conversion. The black arrow depicts the threshold used to quantify the percentage of GFP+ cells, shown in the line graph. Error bars indicate mean ± SD from three biological replicates.
(F) Percentage of replication foci with co-localization of UHRF1 in serum, 24-hr 2i and LT 2i ESCs. Images from serum ESCs showing examples for the two quantified states; arrows indicate EdU+ replication foci.
See also Figure S4.
To confirm whether the regulation of UHRF1 at the protein level was also relevant in human ESCs, we assessed mRNA and protein levels in conventional and naive (Takashima et al., 2014) human ESCs by immunofluorescence (IF). Similar to our observations in mouse ESCs, UHRF1 and DNMT1 mRNA levels are not changed between the two states (Figure S4F), but UHRF1 protein levels were significantly reduced (∼2-fold reduced) in the naive cells (Figure S4G), pointing to a conserved regulation of UHRF1 in naive ESCs.
UHRF1 Recruitment to Replication Foci Is Impaired in 2i ESCs
The rapid, though not complete, loss of UHRF1 protein in 2i conditions prompted us to ask whether recruitment of the DNA maintenance methylation machinery to the replication forks was impaired. Previous IF experiments in cells lacking Uhrf1 proved that the presence of UHRF1 is absolutely required for recruitment of DNMT1 to replication foci (Sharif et al., 2007). We labeled replication foci by incubating serum or 2i ESCs for 8 min prior to fixation with 5-ethynyl-2′-deoxyuridine (EdU), which is incorporated into newly synthesized DNA. Co-staining for UHRF1 and EdU allowed us to count the number of cells with EdU-positive foci for co-localization of UHRF1 with replication foci. While UHRF1 co-localizes with EdU-positive replication foci in the majority of cells in serum conditions, this number is significantly reduced under 2i conditions (Figure 4F). The recruitment of UHRF1 to EdU-positive replication foci is further reduced with time in 2i. These results suggest that DNA demethylation in the serum-to-2i conversion is a consequence of impaired DNA methylation maintenance through impaired recruitment of DNMT1 by UHRF1 to the replication fork.
H3K9me2 Is Reduced in 2i ESCs
The drastic impairment of recruitment of UHRF1 to replication sites was surprising, as the levels of UHRF1 were reduced albeit still detectable in 2i conditions. The recruitment of UHRF1 depends on the recognition of both hemimethylated CpGs via its SRA domain and of methylated lysine 9 on histone 3 (H3K9) through its Tudor domain (Citterio et al., 2004, Karagianni et al., 2008, Rothbart et al., 2012). Loss of H3K9 methyltransferase G9a results in loss of global DNA methylation (Zhang et al., 2016), and similarly, it has been concluded that loss of H3K9 methylation, in particular H3K9me2, is an additional key step leading to genome-wide demethylation in PGCs (Kurimoto et al., 2015). H3K9me3 localization is relatively unchanged between serum and 2i ESCs and mainly enriched at repetitive elements (Marks et al., 2012), but the importance of loss of H3K9me2 is not clear (Walter et al., 2016). We found a significant reduction in the levels of H3K9me2 upon serum-to-2i conversion (∼2-fold reduction) (Figures 5A, 5B, and S5A). Interestingly, loss of H3K9me2 was rapid, and we detected a weak correlation by IF between the global levels of H3K9me2 and DNA methylation in serum ESCs (Figure 5C), in line with the notion that H3K9me2-dependent recruitment of UHRF1 plays a key role in DNA methylation maintenance in ESCs, possibly explaining the drastic impairment of recruitment of UHRF1 to the replication foci.
Figure 5.

H3K9me2 Is Rapidly Reduced in 2i ESCs
(A) Western blot analysis for H3K9me2 in serum and 2i ESCs.
(B) Immunofluorescence staining for H3K9me2 (green), 5mC (red) and DAPI (blue) in serum and LT 2i ESCs. Scale bar represents 20 μm.
(C) Correlation of the quantified signals of H3K9me2 and 5mC in immunofluorescence staining of serum, 24-hr 2i, and LT 2i ESCs. The dashed line represents the linear regression between H3K9me2 and 5mC signals in serum ESCs.
(D) 5mC levels in H3K9me2-bound DNA and corresponding input samples from serum and LT 2i ESCs, measured by H3K9me2-ChIP-BS-seq.
(E) 5mC levels in regions with high or low H3K9me enrichment in serum and LT 2i ESCs.
(F) Levels of 5mC, determined by RRBS at H3K9me2 enriched regions during the serum-2i transition in E14, Uhrf1 WT, and Uhrf1 KO ESCs.
(G) Relative protein levels of known H3K9 modifiers detected by protein mass spectrometry (label-free quantification [LFQ]) at different time points during serum-to-2i conversion. Levels are normalized to serum ESCs.
Student’s t test was performed for the indicated comparisons (∗∗∗p < 0.001).
See also Figure S5.
To understand any locus-specific effects of the loss of H3K9me2, we performed H3K9me2 chromatin immunoprecipitation sequencing (ChIP-seq) analysis. While the overall pattern of H3K9me2 enrichment did not change during the serum-to-2i conversion, regions with low H3K9me2 enrichment further flattened out (Figure S5B). To correlate the presence of H3K9me2 with the levels of 5mC, we performed H3K9me2 chromatin immunoprecipitation followed by bisulfite sequencing (ChIP-BS-seq) (Brinkman et al., 2012). The 5mC levels in serum ESCs as well as 2i ESCs were significantly increased in the H3K9me2-bound DNA when compared to corresponding input samples (Figure 5D). We then divided the genome into regions with high or low H3K9me2 enrichment and found a significant increase in the 5mC levels at H3K9me2-high regions (Figure 5E).
Next, we generated RRBS libraries of Uhrf1−/− and corresponding wild-type control ESCs during the serum-to-2i conversion (Figure S5C) to identify regions that are only maintained in the presence of UHRF1. Computational analyses of these and E14, Tet1/2/3 KO, and wild-type control lines identified a number of genomic regions resistant to DNA demethylation in wild-type cells, but not upon deletion of Uhrf1 (Figure S5D; blue cluster), indicating strong locus specific recruitment. These regions are enriched for H3K9me2 in 2i ESCs and for H3K9me3 in 2i and serum ESCs (Figures S5E and 5F). We next measured 5mC levels over H3K9me2- (Figure 5F) and H3K9me3-enriched (Figure S5G) regions (Marks et al., 2012) and found that these regions retain high levels of DNA methylation in 2i ESCs in an UHRF1-dependent manner.
Finally, we asked how H3K9me2 levels were regulated during the serum-to-2i conversion. We quantified mRNA levels of key H3K9 methylases and demethylases by RNA-seq (Figure S5H) and protein levels by mass spectrometry (Figure 5G). Interestingly, we found that several H3K9 demethylases, including KDM3A, KDM3B, and KDM4A, were upregulated specifically at the protein level in 2i conditions. Conversely, a number of H3K9 methylases, such as EHMT1 (GLP) and EHMT2 (G9A), were downregulated.
Discussion
Genome-wide DNA methylation erasure is a distinguishing epigenetic feature of preimplantation embryos (Guo et al., 2014, Smith et al., 2014, Wang et al., 2014), developing PGCs (Gkountela et al., 2015, Guo et al., 2015, Hackett et al., 2013b, Seisenberger et al., 2012, Tang et al., 2015), and naive ESCs (Ficz et al., 2013, Habibi et al., 2013, Leitch et al., 2013, Takashima et al., 2014). Here, we have developed a mathematical model that is able to accurately estimate 5mC levels and the individual activity of the three main pathways relevant to DNA methylation dynamics (p1, de novo; p2, maintenance; and p3, active demethylation) and predicts with great accuracy corresponding 5hmC kinetics in all instances of global epigenetic reprogramming. Validation of the model in different mutant ESC lines during serum-to-2i conversion demonstrates the power and the high prediction accuracy of the algorithm. Using methylation levels (5mC) from previously published datasets for migratory PGCs (E6.5–E11.5) (Seisenberger et al., 2012) and preimplantation embryos (two-cell stage to E4) (Okamoto et al., 2016, Wang et al., 2014), we have estimated the in vivo activity of the DNA methylation pathways and the dynamics of 5hmC levels during these phases of global DNA demethylation (Figures 6A and S6). All examples of global demethylation in the mouse can hence be accurately modeled and the predicted activities of the three pathways are mirrored by the levels and regulation of the enzymes and factors involved (where this is known). This leads to a unified view of genome-wide demethylation mechanisms.
Figure 6.

Dual Regulation of DNA Demethylation during Serum-2i Transition
(A) Mathematical modeling of serum-2i transition, preimplantation development, and migratory PGC demethylation. The model estimates the activity of the main pathways related to DNA methylation dynamics, i.e., de novo methylation (p1), maintenance methylation (p2), and active demethylation (p3). The first column shows measured (solid lines) and estimated (dotted lines) global levels 5mC (values have been scaled) during serum-2i transition, preimplantation development, and migratory PGC demethylation. The second column summarizes the estimated activities of the three pathways in each condition. The steady-state activities in serum ESCs are included as a comparison. The third column shows the predicted (dotted lines) global 5hmC values (scaled) and, if available, also measured (solid lines) 5hmC levels. ∗The mathematical modeling did not predict a peak of global 5hmC levels in eight-cell embryos (Okamoto et al., 2016). ∗∗Global 5mC dynamics in migratory PGCs can be can be explained by two solutions of the mathematical model. The first solution is shown here and the second solution is shown in Figure S6.
(B) Cartoon representation of the proposed model. In serum cells, UHRF1 is recruited to replication foci by binding to hemi-methylated DNA and H3K9me2 chromatin marks. Switching to 2i conditions results in passive loss of 5mC driven by a multilayer of regulation: downregulation of UHRF1 at the protein level, and loss of H3K9me2, which results in impaired recruitment to replication foci.
See also Figure S6.
In all instances of epigenetic reprogramming, global methylation is lost in a replication-dependent manner as a consequence of impaired maintenance methylation (p2). The individual maintenance activity dictates the rate of global demethylation, which is fastest in PGCs, where the rate of demethylation is almost as fast as that brought about by complete loss of maintenance methylation (Dnmt1 KO ESCs). This result agrees with the observations made in preimplantation embryos, where an oocyte-specific cytoplasmic DNMT1 isoform is predominantly expressed and the somatic DNMT1 isoform is only expressed at low levels, but shows some activity, in particular at imprinted regions (Cirio et al., 2008, Dean, 2008, Hirasawa et al., 2008). Similar to 2i ESCs, the model predicts a significant impairment of de novo methylation in preimplantation embryos and migratory PGCs (p1, ∼10- and 30-fold reduction in activity) when compared to the steady-state levels found in serum ESCs. This is in agreement with substantial downregulation of DNMT3A/B in PGCs (Hackett et al., 2013b, Seisenberger et al., 2012, Wu and Zhang, 2014) and naive ESCs (Ficz et al., 2013, Habibi et al., 2013) and suggests that de novo methylation is not active prior to E4 in early embryos and the expression of de novo DNMTs is only needed for remethylation in the epiblast (Guenatri et al., 2013, Hirasawa et al., 2008). Finally, the importance of active demethylation (p3) for global loss of DNA methylation is estimated to be very low in all instances of epigenetic reprogramming. The 5hmC predictions of the model recapitulate 5hmC dynamics in ESCs and in preimplantation embryos (with the exception of a reported peak at the eight-cell stage) and also predict 5hmC dynamics in PGCs (Figures 6A and S6). Noteworthy, the dynamics in migratory PGCs can be explained by two solutions, which both accurately mimic 5mC levels but predict different 5hmC dynamics. One solution predicts that both maintenance methylation and TET activity are strongly reduced (“impaired maintenance methylation”) (Figure 6A), while the second solution predicts that maintenance methylation is only ∼2-fold reduced and TET activity is high (“TET-dependent demethylation”) (Figure S6). In mouse PGCs, UHRF1 levels are significantly decreased and high levels of hemi-methylated CpG dyads were found (Seisenberger et al., 2012), both supporting a strong impairment of maintenance methylation. In addition, loss of H3K9me2 was reported in in vivo and in vitro PGCs (Kurimoto et al., 2015, Seki et al., 2005) and knockdown of Tet1 and 2 did not affect global DNA demethylation in vitro (Vincent et al., 2013). Thus, we reason that the “impaired maintenance methylation” model (Figure 6A) faithfully recapitulates the in vivo situation.
Mechanistically, we have dissected the different pathways relevant to DNA methylation dynamics in primed (serum) and naive (2i) ESCs (Wu and Zhang, 2014) and shown that global demethylation is, contrary to previous assumptions, a consequence of neither loss of de novo methylation nor active Tet-dependent demethylation but caused by impaired maintenance methylation. DNMT1 is recruited to the replication fork through UHRF1, which itself interacts with both hemimethylated CpG dyads and methylated H3K9 and loss of either interaction impairs recruitment (Liu et al., 2013). In naive mouse and human ESCs, protein levels of UHRF1 are reduced, limiting the recruitment of DNMT1. In addition, loss of H3K9me2 further reduces UHRF1 recruitment and in turn impairs DNA methylation maintenance by DNMT1 (Figure 6B). UHRF1 is regulated at the protein level in human and mouse ESCs, as well as in human and mouse PGCs (Gkountela et al., 2015, Pastor et al., 2016, Seisenberger et al., 2012, Tang et al., 2015). Interestingly, in mouse PGCs there is also transcriptional silencing of Uhrf1 (Kurimoto et al., 2015, Magnúsdóttir et al., 2013, Nakaki et al., 2013, Seisenberger et al., 2012), which may well underlie the considerably faster demethylation kinetics in mouse PGCs when compared to naive ESCs. Hence, several pathways have apparently evolved that modulate maintenance methylation by controlling UHRF1 activity at different levels. The additional level of transcriptional regulation in mouse PGCs suggests that the short time frame of epigenetic resetting in the mouse germline necessitated an additional regulatory layer, ensuring almost complete impairment of maintenance methylation and thus rapid demethylation (Figure 6A). This is in contrast to human PGCs, where demethylation occurs with slower, potentially intra-individual-specific kinetics (von Meyenn and Reik, 2015).
In addition to the reduction of UHRF1 protein levels, the signaling changes imposed by 2i in ESCs (MAPK and GSK3 signaling inhibition) elicit a decrease in the levels of H3K9me2, thereby synergistically driving genome-wide DNA demethylation, while allowing methylation maintenance of specific genomic loci. This regulation of H3K9me2 is also evident in PGCs, with apparent loss of H3K9me2 in mouse (Kurimoto et al., 2015, Seki et al., 2005) and human PGCs (Tang et al., 2015). We found that regions with high levels of H3K9me2 in naive ESCs are also characterized by higher level of DNA methylation (Figure 5F) and regions resistant to DNA demethylation in the presence of UHRF1 show significant enrichment of H3K9me2 (Figure S5E). We propose that in the face of global demethylation, locus-specific enrichment of H3K9me2/3 allows DNA methylation maintenance at specific regions via recruitment of UHRF1. Similarly, while TET enzymes were dispensable for global epigenetic reprogramming, TET-dependent demethylation was evident at a limited number of specific loci. WGBS and TAB-seq experiments revealed that active demethylation is restricted to a small proportion of the genome, predominantly including active promoters and enhancers.
Taken together, loss of DNA methylation in ESCs, PGCs, and preimplantation embryos is the result of the concerted regulation of two pathways, namely reduction of UHRF1 protein levels and global loss of H3K9me2, thereby impairing recruitment of DNMT1 to the replication fork. This elegant mechanism facilitates the maintenance of methylation at specific loci while the genome is simultaneously demethylated on a global scale.
Experimental Procedures
Cell Culture
Mouse ESCs were cultured in the presence of LIF in DMEM containing 15% fetal calf serum. A tamoxifen-inducible Cre recombinase was used to induce recombination of loxP sites in the floxed cell lines 48 hr prior to the experiment. For serum-to-2i transition, serum medium was replaced by serum-free N2B27 supplemented with LIF, mitogen-activated protein kinase kinase (MEK) inhibitor PD0325901 (1 μM), and GSK3 inhibitor CHIR99021 (3 μM).
Mass Spectrometry of Nucleosides
Mass spectrometry of nucleosides was performed as previously described (Ficz et al., 2013, Kroeze et al., 2014). Briefly, 150–1,000 ng genomic DNA was digested using DNA Degradase Plus (Zymo Research) according to the manufacturer’s instructions and analyzed by liquid chromatography-tandem mass spectrometry.
Next-Generation Sequencing
WGBS, RRBS, and TAB-seq were performed as described previously (Lister et al., 2008, Smallwood et al., 2011, Yu et al., 2012). Whole-genome hairpin bisulfite sequencing was performed as described previously (Zhao et al., 2014). Chromatin immunoprecipitation of serum and 2i ESCs was performed using anti-H3K9me2 antibodies (Abcam, ab1220). Eluted DNA was then used for ChIP-seq library preparation using the MicroPlex Library Preparation Kit v2 (Diagenode) or alternatively treated as WGBS samples as described above.
See also Supplemental Experimental Procedures.
Author Contributions
F.v.M., M.I., and E.H. performed the experiments, analyzed the data, and carried out bioinformatics analysis. F.S. performed immunofluorescence experiments and analysis. E.P. carried out bioinformatics analysis. N.Q.L. performed proteomic analysis. E.H. and A.S.Y. performed mathematical modeling. M.Y. and C.H. prepared WGBS and TAB-seq libraries. Z.X. and H.X. performed hairpin-bisulfite library preparation. I.M. generated Aicda−/− cells, and T.B.N. generated Dnmt[3afl/fl,3bfl/fl] cells. L.I.K. and J.H.J. performed 5mC/5hmC LC-MS analysis. F.v.M., M.I., E.H., H.G.S., and W.R. designed the experiments and wrote the manuscript. H.G.S. and W.R. provided supervision.
Acknowledgments
We thank members of the molecular biology department and the epigenetics ISP for discussions; Colin Logie, Arjen Brinkman, and Wendy Dean for critical reading of the manuscript; and the sequencing team and Kristina Tabbada for NGS. We thank David Oxley for mass spectrometry analysis of nucleosides, Felix Krueger and Simon Andrews for help with bioinformatics analysis, and Melanie Eckersley-Maslin for help with microscopy. The computational modeling analyses were carried out on the Dutch national e-infrastructure with the support of SURF Foundation. Haruhiko Koseki provided Dnmt1fl/fl, Uhrf1fl/fl cells, Gouliang Xu Tet[1−/−,2−/−,3−/−] cells, Meelad Dawlaty and Rudolf Jaenisch Tet[1−/−,2−/−] cells, Primo Schär Tdg−/− cells, and Austin Smith human naive H9 cells. HGS is supported by CEU-ERC Advanced Grant SysStemCell (No. 339431). C.H. is supported by National Institutes of Health (R01 HG006827). C.H. is an investigator of the Howard Hughes Medical Institute, and M.Y. is a Howard Hughes Medical Institute International Predoctoral Fellow. H.X. is supported by the VBI new faculty startup fund. W.R. is supported by the BBSRC (BB/K010867/1), the Wellcome Trust (095645/Z/11/Z), EU BLUEPRINT, and EpiGeneSys. M.I. is supported by the People Programme (Marie Curie Actions) of the European Union’s Seventh Framework Programme FP7. F.v.M. is a Postdoctoral Fellow of the Swiss National Science Foundation (SNF)/Novartis SNF. W.R. is a consultant and shareholder of Cambridge Epigenetix.
Published: May 26, 2016; corrected online: June 16, 2016
Footnotes
Supplemental Information includes Supplemental Experimental Procedures, six figures, and two tables and can be found with this article online at http://dx.doi.org/10.1016/j.molcel.2016.04.025.
Contributor Information
Wolf Reik, Email: wolf.reik@babraham.ac.uk.
Hendrik G. Stunnenberg, Email: h.stunnenberg@ncmls.ru.nl.
Accession Numbers
The accession numbers for the next-generation-sequencing data reported in this study are GEO: GSE70724 and GEO: GSE77420.
Supplemental Information
Reads were mapped to the mouse NCBIM37 genome build using Bismark and average CpG methylations were calculated over each 500-bp region in Seqmonk.
References
- Arand J., Spieler D., Karius T., Branco M.R., Meilinger D., Meissner A., Jenuwein T., Xu G., Leonhardt H., Wolf V., Walter J. In vivo control of CpG and non-CpG DNA methylation by DNA methyltransferases. PLoS Genet. 2012;8:e1002750. doi: 10.1371/journal.pgen.1002750. [DOI] [PMC free article] [PubMed] [Google Scholar]
- Blaschke K., Ebata K.T., Karimi M.M., Zepeda-Martínez J.A., Goyal P., Mahapatra S., Tam A., Laird D.J., Hirst M., Rao A. Vitamin C induces Tet-dependent DNA demethylation and a blastocyst-like state in ES cells. Nature. 2013;500:222–226. doi: 10.1038/nature12362. [DOI] [PMC free article] [PubMed] [Google Scholar]
- Bonapace I.M., Latella L., Papait R., Nicassio F., Sacco A., Muto M., Crescenzi M., Di Fiore P.P. Np95 is regulated by E1A during mitotic reactivation of terminally differentiated cells and is essential for S phase entry. J. Cell Biol. 2002;157:909–914. doi: 10.1083/jcb.200201025. [DOI] [PMC free article] [PubMed] [Google Scholar]
- Brinkman A.B., Gu H., Bartels S.J.J., Zhang Y., Matarese F., Simmer F., Marks H., Bock C., Gnirke A., Meissner A., Stunnenberg H.G. Sequential ChIP-bisulfite sequencing enables direct genome-scale investigation of chromatin and DNA methylation cross-talk. Genome Res. 2012;22:1128–1138. doi: 10.1101/gr.133728.111. [DOI] [PMC free article] [PubMed] [Google Scholar]
- Canham M.A., Sharov A.A., Ko M.S.H., Brickman J.M. Functional heterogeneity of embryonic stem cells revealed through translational amplification of an early endodermal transcript. PLoS Biol. 2010;8:e1000379. doi: 10.1371/journal.pbio.1000379. [DOI] [PMC free article] [PubMed] [Google Scholar]
- Chung T.-L., Brena R.M., Kolle G., Grimmond S.M., Berman B.P., Laird P.W., Pera M.F., Wolvetang E.J. Vitamin C promotes widespread yet specific DNA demethylation of the epigenome in human embryonic stem cells. Stem Cells. 2010;28:1848–1855. doi: 10.1002/stem.493. [DOI] [PubMed] [Google Scholar]
- Cirio M.C., Ratnam S., Ding F., Reinhart B., Navara C., Chaillet J.R. Preimplantation expression of the somatic form of Dnmt1 suggests a role in the inheritance of genomic imprints. BMC Dev. Biol. 2008;8:9. doi: 10.1186/1471-213X-8-9. [DOI] [PMC free article] [PubMed] [Google Scholar]
- Citterio E., Papait R., Nicassio F., Vecchi M., Gomiero P., Mantovani R., Di Fiore P.P., Bonapace I.M. Np95 is a histone-binding protein endowed with ubiquitin ligase activity. Mol. Cell. Biol. 2004;24:2526–2535. doi: 10.1128/MCB.24.6.2526-2535.2004. [DOI] [PMC free article] [PubMed] [Google Scholar]
- Dean W. The elusive Dnmt1 and its role during early development. Epigenetics. 2008;3:175–178. doi: 10.4161/epi.3.4.6572. [DOI] [PubMed] [Google Scholar]
- Ficz G., Hore T.A., Santos F., Lee H.J., Dean W., Arand J., Krueger F., Oxley D., Paul Y.-L., Walter J. FGF signaling inhibition in ESCs drives rapid genome-wide demethylation to the epigenetic ground state of pluripotency. Cell Stem Cell. 2013;13:351–359. doi: 10.1016/j.stem.2013.06.004. [DOI] [PMC free article] [PubMed] [Google Scholar]
- Genereux D.P., Miner B.E., Bergstrom C.T., Laird C.D. A population-epigenetic model to infer site-specific methylation rates from double-stranded DNA methylation patterns. Proc. Natl. Acad. Sci. USA. 2005;102:5802–5807. doi: 10.1073/pnas.0502036102. [DOI] [PMC free article] [PubMed] [Google Scholar]
- Gkountela S., Zhang K.X., Shafiq T.A., Liao W.-W., Hargan-Calvopiña J., Chen P.-Y., Clark A.T. DNA demethylation dynamics in the human prenatal germline. Cell. 2015;161:1425–1436. doi: 10.1016/j.cell.2015.05.012. [DOI] [PMC free article] [PubMed] [Google Scholar]
- Guenatri M., Duffié R., Iranzo J., Fauque P., Bourc’his D. Plasticity in Dnmt3L-dependent and -independent modes of de novo methylation in the developing mouse embryo. Development. 2013;140:562–572. doi: 10.1242/dev.089268. [DOI] [PubMed] [Google Scholar]
- Guo H., Zhu P., Yan L., Li R., Hu B., Lian Y., Yan J., Ren X., Lin S., Li J. The DNA methylation landscape of human early embryos. Nature. 2014;511:606–610. doi: 10.1038/nature13544. [DOI] [PubMed] [Google Scholar]
- Guo F., Yan L., Guo H., Li L., Hu B., Zhao Y., Yong J., Hu Y., Wang X., Wei Y. The transcriptome and DNA methylome landscapes of human primordial germ cells. Cell. 2015;161:1437–1452. doi: 10.1016/j.cell.2015.05.015. [DOI] [PubMed] [Google Scholar]
- Habibi E., Brinkman A.B., Arand J., Kroeze L.I., Kerstens H.H.D., Matarese F., Lepikhov K., Gut M., Brun-Heath I., Hubner N.C. Whole-genome bisulfite sequencing of two distinct interconvertible DNA methylomes of mouse embryonic stem cells. Cell Stem Cell. 2013;13:360–369. doi: 10.1016/j.stem.2013.06.002. [DOI] [PubMed] [Google Scholar]
- Hackett J.A., Dietmann S., Murakami K., Down T.A., Leitch H.G., Surani M.A. Synergistic mechanisms of DNA demethylation during transition to ground-state pluripotency. Stem Cell Reports. 2013;1:518–531. doi: 10.1016/j.stemcr.2013.11.010. [DOI] [PMC free article] [PubMed] [Google Scholar]
- Hackett J.A., Sengupta R., Zylicz J.J., Murakami K., Lee C., Down T.A., Surani M.A. Germline DNA demethylation dynamics and imprint erasure through 5-hydroxymethylcytosine. Science. 2013;339:448–452. doi: 10.1126/science.1229277. [DOI] [PMC free article] [PubMed] [Google Scholar]
- Hirasawa R., Chiba H., Kaneda M., Tajima S., Li E., Jaenisch R., Sasaki H. Maternal and zygotic Dnmt1 are necessary and sufficient for the maintenance of DNA methylation imprints during preimplantation development. Genes Dev. 2008;22:1607–1616. doi: 10.1101/gad.1667008. [DOI] [PMC free article] [PubMed] [Google Scholar]
- Karagianni P., Amazit L., Qin J., Wong J. ICBP90, a novel methyl K9 H3 binding protein linking protein ubiquitination with heterochromatin formation. Mol. Cell. Biol. 2008;28:705–717. doi: 10.1128/MCB.01598-07. [DOI] [PMC free article] [PubMed] [Google Scholar]
- Kobayashi H., Sakurai T., Imai M., Takahashi N., Fukuda A., Yayoi O., Sato S., Nakabayashi K., Hata K., Sotomaru Y. Contribution of intragenic DNA methylation in mouse gametic DNA methylomes to establish oocyte-specific heritable marks. PLoS Genet. 2012;8:e1002440. doi: 10.1371/journal.pgen.1002440. [DOI] [PMC free article] [PubMed] [Google Scholar]
- Kobayashi H., Sakurai T., Miura F., Imai M., Mochiduki K., Yanagisawa E., Sakashita A., Wakai T., Suzuki Y., Ito T. High-resolution DNA methylome analysis of primordial germ cells identifies gender-specific reprogramming in mice. Genome Res. 2013;23:616–627. doi: 10.1101/gr.148023.112. [DOI] [PMC free article] [PubMed] [Google Scholar]
- Kroeze L.I., Aslanyan M.G., van Rooij A., Koorenhof-Scheele T.N., Massop M., Carell T., Boezeman J.B., Marie J.-P., Halkes C.J.M., de Witte T., EORTC Leukemia Group and GIMEMA Characterization of acute myeloid leukemia based on levels of global hydroxymethylation. Blood. 2014;124:1110–1118. doi: 10.1182/blood-2013-08-518514. [DOI] [PubMed] [Google Scholar]
- Kurimoto K., Yabuta Y., Hayashi K., Ohta H., Kiyonari H., Mitani T., Moritoki Y., Kohri K., Kimura H., Yamamoto T. Quantitative dynamics of chromatin remodeling during germ cell specification from mouse embryonic stem cells. Cell Stem Cell. 2015;16:517–532. doi: 10.1016/j.stem.2015.03.002. [DOI] [PubMed] [Google Scholar]
- Leitch H.G., McEwen K.R., Turp A., Encheva V., Carroll T., Grabole N., Mansfield W., Nashun B., Knezovich J.G., Smith A. Naive pluripotency is associated with global DNA hypomethylation. Nat. Struct. Mol. Biol. 2013;20:311–316. doi: 10.1038/nsmb.2510. [DOI] [PMC free article] [PubMed] [Google Scholar]
- Lister R., O’Malley R.C., Tonti-Filippini J., Gregory B.D., Berry C.C., Millar A.H., Ecker J.R. Highly integrated single-base resolution maps of the epigenome in Arabidopsis. Cell. 2008;133:523–536. doi: 10.1016/j.cell.2008.03.029. [DOI] [PMC free article] [PubMed] [Google Scholar]
- Liu X., Gao Q., Li P., Zhao Q., Zhang J., Li J., Koseki H., Wong J. UHRF1 targets DNMT1 for DNA methylation through cooperative binding of hemi-methylated DNA and methylated H3K9. Nat. Commun. 2013;4:1563. doi: 10.1038/ncomms2562. [DOI] [PubMed] [Google Scholar]
- Magnúsdóttir E., Dietmann S., Murakami K., Günesdogan U., Tang F., Bao S., Diamanti E., Lao K., Gottgens B., Azim Surani M. A tripartite transcription factor network regulates primordial germ cell specification in mice. Nat. Cell Biol. 2013;15:905–915. doi: 10.1038/ncb2798. [DOI] [PMC free article] [PubMed] [Google Scholar]
- Marks H., Kalkan T., Menafra R., Denissov S., Jones K., Hofemeister H., Nichols J., Kranz A., Stewart A.F., Smith A., Stunnenberg H.G. The transcriptional and epigenomic foundations of ground state pluripotency. Cell. 2012;149:590–604. doi: 10.1016/j.cell.2012.03.026. [DOI] [PMC free article] [PubMed] [Google Scholar]
- Martello G., Smith A. The nature of embryonic stem cells. Annu. Rev. Cell Dev. Biol. 2014;30:647–675. doi: 10.1146/annurev-cellbio-100913-013116. [DOI] [PubMed] [Google Scholar]
- McGovern A.P., Powell B.E., Chevassut T.J.T. A dynamic multi-compartmental model of DNA methylation with demonstrable predictive value in hematological malignancies. J. Theor. Biol. 2012;310:14–20. doi: 10.1016/j.jtbi.2012.06.018. [DOI] [PubMed] [Google Scholar]
- Nakaki F., Hayashi K., Ohta H., Kurimoto K., Yabuta Y., Saitou M. Induction of mouse germ-cell fate by transcription factors in vitro. Nature. 2013;501:222–226. doi: 10.1038/nature12417. [DOI] [PubMed] [Google Scholar]
- Nichols J., Smith A. Pluripotency in the embryo and in culture. Cold Spring Harb. Perspect. Biol. 2012;4:a008128. doi: 10.1101/cshperspect.a008128. [DOI] [PMC free article] [PubMed] [Google Scholar]
- Okamoto Y., Yoshida N., Suzuki T., Shimozawa N., Asami M., Matsuda T., Kojima N., Perry A.C.F., Takada T. DNA methylation dynamics in mouse preimplantation embryos revealed by mass spectrometry. Sci. Rep. 2016;6:19134. doi: 10.1038/srep19134. [DOI] [PMC free article] [PubMed] [Google Scholar]
- Otto S.P., Walbot V. DNA methylation in eukaryotes: kinetics of demethylation and de novo methylation during the life cycle. Genetics. 1990;124:429–437. doi: 10.1093/genetics/124.2.429. [DOI] [PMC free article] [PubMed] [Google Scholar]
- Pastor W.A., Chen D., Liu W., Kim R., Sahakyan A., Lukianchikov A., Plath K., Jacobsen S.E., Clark A.T. Naive human pluripotent cells feature a methylation landscape devoid of blastocyst or germline memory. Cell Stem Cell. 2016;18:323–329. doi: 10.1016/j.stem.2016.01.019. [DOI] [PMC free article] [PubMed] [Google Scholar]
- Pfeifer G.P., Steigerwald S.D., Hansen R.S., Gartler S.M., Riggs A.D. Polymerase chain reaction-aided genomic sequencing of an X chromosome-linked CpG island: methylation patterns suggest clonal inheritance, CpG site autonomy, and an explanation of activity state stability. Proc. Natl. Acad. Sci. USA. 1990;87:8252–8256. doi: 10.1073/pnas.87.21.8252. [DOI] [PMC free article] [PubMed] [Google Scholar]
- Rothbart S.B., Krajewski K., Nady N., Tempel W., Xue S., Badeaux A.I., Barsyte-Lovejoy D., Martinez J.Y., Bedford M.T., Fuchs S.M. Association of UHRF1 with methylated H3K9 directs the maintenance of DNA methylation. Nat. Struct. Mol. Biol. 2012;19:1155–1160. doi: 10.1038/nsmb.2391. [DOI] [PMC free article] [PubMed] [Google Scholar]
- Seisenberger S., Andrews S., Krueger F., Arand J., Walter J., Santos F., Popp C., Thienpont B., Dean W., Reik W. The dynamics of genome-wide DNA methylation reprogramming in mouse primordial germ cells. Mol. Cell. 2012;48:849–862. doi: 10.1016/j.molcel.2012.11.001. [DOI] [PMC free article] [PubMed] [Google Scholar]
- Seki Y., Hayashi K., Itoh K., Mizugaki M., Saitou M., Matsui Y. Extensive and orderly reprogramming of genome-wide chromatin modifications associated with specification and early development of germ cells in mice. Dev. Biol. 2005;278:440–458. doi: 10.1016/j.ydbio.2004.11.025. [DOI] [PubMed] [Google Scholar]
- Sharif J., Muto M., Takebayashi S., Suetake I., Iwamatsu A., Endo T.A., Shinga J., Mizutani-Koseki Y., Toyoda T., Okamura K. The SRA protein Np95 mediates epigenetic inheritance by recruiting Dnmt1 to methylated DNA. Nature. 2007;450:908–912. doi: 10.1038/nature06397. [DOI] [PubMed] [Google Scholar]
- Singh A.M., Hamazaki T., Hankowski K.E., Terada N. A heterogeneous expression pattern for Nanog in embryonic stem cells. Stem Cells. 2007;25:2534–2542. doi: 10.1634/stemcells.2007-0126. [DOI] [PubMed] [Google Scholar]
- Smallwood S.A., Tomizawa S., Krueger F., Ruf N., Carli N., Segonds-Pichon A., Sato S., Hata K., Andrews S.R., Kelsey G. Dynamic CpG island methylation landscape in oocytes and preimplantation embryos. Nat. Genet. 2011;43:811–814. doi: 10.1038/ng.864. [DOI] [PMC free article] [PubMed] [Google Scholar]
- Smith A.G. Embryo-derived stem cells: of mice and men. Annu. Rev. Cell Dev. Biol. 2001;17:435–462. doi: 10.1146/annurev.cellbio.17.1.435. [DOI] [PubMed] [Google Scholar]
- Smith Z.D., Chan M.M., Humm K.C., Karnik R., Mekhoubad S., Regev A., Eggan K., Meissner A. DNA methylation dynamics of the human preimplantation embryo. Nature. 2014;511:611–615. doi: 10.1038/nature13581. [DOI] [PMC free article] [PubMed] [Google Scholar]
- Sontag L.B., Lorincz M.C., Georg Luebeck E. Dynamics, stability and inheritance of somatic DNA methylation imprints. J. Theor. Biol. 2006;242:890–899. doi: 10.1016/j.jtbi.2006.05.012. [DOI] [PubMed] [Google Scholar]
- Stadler M.B., Murr R., Burger L., Ivanek R., Lienert F., Schöler A., van Nimwegen E., Wirbelauer C., Oakeley E.J., Gaidatzis D. DNA-binding factors shape the mouse methylome at distal regulatory regions. Nature. 2011;480:490–495. doi: 10.1038/nature10716. [DOI] [PubMed] [Google Scholar]
- Takashima Y., Guo G., Loos R., Nichols J., Ficz G., Krueger F., Oxley D., Santos F., Clarke J., Mansfield W. Resetting transcription factor control circuitry toward ground-state pluripotency in human. Cell. 2014;158:1254–1269. doi: 10.1016/j.cell.2014.08.029. [DOI] [PMC free article] [PubMed] [Google Scholar]
- Tang F., Barbacioru C., Bao S., Lee C., Nordman E., Wang X., Lao K., Surani M.A. Tracing the derivation of embryonic stem cells from the inner cell mass by single-cell RNA-Seq analysis. Cell Stem Cell. 2010;6:468–478. doi: 10.1016/j.stem.2010.03.015. [DOI] [PMC free article] [PubMed] [Google Scholar]
- Tang W.W.C., Dietmann S., Irie N., Leitch H.G., Floros V.I., Bradshaw C.R., Hackett J.A., Chinnery P.F., Surani M.A. A Unique Gene Regulatory Network Resets the Human Germline Epigenome for Development. Cell. 2015;161:1453–1467. doi: 10.1016/j.cell.2015.04.053. [DOI] [PMC free article] [PubMed] [Google Scholar]
- Vincent J.J., Huang Y., Chen P.-Y., Feng S., Calvopiña J.H., Nee K., Lee S.A., Le T., Yoon A.J., Faull K. Stage-specific roles for tet1 and tet2 in DNA demethylation in primordial germ cells. Cell Stem Cell. 2013;12:470–478. doi: 10.1016/j.stem.2013.01.016. [DOI] [PMC free article] [PubMed] [Google Scholar]
- von Meyenn F., Reik W. Forget the parents: epigenetic reprogramming in human germ cells. Cell. 2015;161:1248–1251. doi: 10.1016/j.cell.2015.05.039. [DOI] [PubMed] [Google Scholar]
- Walter M., Teissandier A., Pérez-Palacios R., Bourc'his D. An epigenetic switch ensures transposon repression upon dynamic loss of DNA methylation in embryonic stem cells. Elife. 2016;5 doi: 10.7554/eLife.11418. [DOI] [PMC free article] [PubMed] [Google Scholar]
- Wang L., Zhang J., Duan J., Gao X., Zhu W., Lu X., Yang L., Zhang J., Li G., Ci W. Programming and inheritance of parental DNA methylomes in mammals. Cell. 2014;157:979–991. doi: 10.1016/j.cell.2014.04.017. [DOI] [PMC free article] [PubMed] [Google Scholar]
- Weber M., Hellmann I., Stadler M.B., Ramos L., Pääbo S., Rebhan M., Schübeler D. Distribution, silencing potential and evolutionary impact of promoter DNA methylation in the human genome. Nat. Genet. 2007;39:457–466. doi: 10.1038/ng1990. [DOI] [PubMed] [Google Scholar]
- Wu H., Zhang Y. Reversing DNA methylation: mechanisms, genomics, and biological functions. Cell. 2014;156:45–68. doi: 10.1016/j.cell.2013.12.019. [DOI] [PMC free article] [PubMed] [Google Scholar]
- Yin R., Mao S.-Q., Zhao B., Chong Z., Yang Y., Zhao C., Zhang D., Huang H., Gao J., Li Z. Ascorbic acid enhances Tet-mediated 5-methylcytosine oxidation and promotes DNA demethylation in mammals. J. Am. Chem. Soc. 2013;135:10396–10403. doi: 10.1021/ja4028346. [DOI] [PubMed] [Google Scholar]
- Ying Q.-L., Wray J., Nichols J., Batlle-Morera L., Doble B., Woodgett J., Cohen P., Smith A. The ground state of embryonic stem cell self-renewal. Nature. 2008;453:519–523. doi: 10.1038/nature06968. [DOI] [PMC free article] [PubMed] [Google Scholar]
- Yu M., Hon G.C., Szulwach K.E., Song C.-X., Zhang L., Kim A., Li X., Dai Q., Shen Y., Park B. Base-resolution analysis of 5-hydroxymethylcytosine in the mammalian genome. Cell. 2012;149:1368–1380. doi: 10.1016/j.cell.2012.04.027. [DOI] [PMC free article] [PubMed] [Google Scholar]
- Zhang T., Termanis A., Özkan B., Bao X.X., Culley J., de Lima Alves F., Rappsilber J., Ramsahoye B., Stancheva I. G9a/GLP complex maintains imprinted DNA methylation in embryonic stem cells. Cell Rep. 2016;15:77–85. doi: 10.1016/j.celrep.2016.03.007. [DOI] [PMC free article] [PubMed] [Google Scholar]
- Zhao L., Sun M.-A., Li Z., Bai X., Yu M., Wang M., Liang L., Shao X., Arnovitz S., Wang Q. The dynamics of DNA methylation fidelity during mouse embryonic stem cell self-renewal and differentiation. Genome Res. 2014;24:1296–1307. doi: 10.1101/gr.163147.113. [DOI] [PMC free article] [PubMed] [Google Scholar]
Associated Data
This section collects any data citations, data availability statements, or supplementary materials included in this article.
Supplementary Materials
Reads were mapped to the mouse NCBIM37 genome build using Bismark and average CpG methylations were calculated over each 500-bp region in Seqmonk.