

Abstract
Background
Integrative analysis of multi-omics data is becoming increasingly important to unravel functional mechanisms of complex diseases. However, the currently available multi-omics datasets inevitably suffer from missing values due to technical limitations and various constrains in experiments. These missing values severely hinder integrative analysis of multi-omics data. Current imputation methods mainly focus on using single omics data while ignoring biological interconnections and information imbedded in multi-omics data sets.
Results
In this study, a novel multi-omics imputation method was proposed to integrate multiple correlated omics datasets for improving the imputation accuracy. Our method was designed to: 1) combine the estimates of missing value from individual omics data itself as well as from other omics, and 2) simultaneously impute multiple missing omics datasets by an iterative algorithm. We compared our method with five imputation methods using single omics data at different noise levels, sample sizes and data missing rates. The results demonstrated the advantage and efficiency of our method, consistently in terms of the imputation error and the recovery of mRNA-miRNA network structure.
Conclusions
We concluded that our proposed imputation method can utilize more biological information to minimize the imputation error and thus can improve the performance of downstream analysis such as genetic regulatory network construction.
Electronic supplementary material
The online version of this article (doi:10.1186/s12859-016-1122-6) contains supplementary material, which is available to authorized users.
Keywords: Multi-omics data, Imputation, Integrative analysis, Ensemble learning
Background
Recent advances in high-throughput technologies prompt the production of a variety of ‘omics’ data such as transcriptomics, proteomics and metabolomics from the same set of subject tissues/cells, facilitating the discovery of various levels of risk genetic factors for the analysis of human complex diseases. However, due to technical limitations of these high throughput technologies and experimental designs, the presence of missing values remains an inevitable and prevalent problem in large-scale profiling experiments [1]. For example, proteomics data suffers significantly from missing values due to the imperfect identification of coding sequences within a genome and the limited sensitivity of current peptide detection technologies [2–4]. Current technologies allow the detection of only one-third to one-half of all coded proteins and thus leave a significant number of proteins experimentally undetected [5–7]. In miRNA array, it is often observed that a large portion of miRNAs are expressed below the detection limit, resulting in missing data in the output [8, 9]. In general, there are three types of missing mechanisms [10, 11]: the first one is data missing completely at random (MCAR), where data missing is due to some factors unrelated to the experimental questions. The causes of missing are usually unobserved in the experiment. The second mechanism is data missing at random (MAR), where missing depends on some variables, which can be measured in the experiment such as different slides, media or experimental conditions for assaying expression data. The last one is missing not at random (MNAR) where data missing is caused by some unobserved variables; they may be highly related to the experiment, for instance, low-abundance expression may remain undetected due to the detection bias of instruments.
A number of studies have indicated that missing values in large-scale omics data can drastically hinder downstream analyses, such as unsupervised clustering of genes [12], detection of differentially expressed genes [13], supervised classification of clinical samples [14], construction of gene regulatory networks [15], genome wide association studies [16] and detection of differentially methylated regions [17]. Missing values in multi-omics data can also obstruct integrative analysis of multi-omics data, leading to difficulty in the interpretation of complex diseases. Therefore, it is highly demanded to impute the missing values before performing integrative analysis of multi-omics data.
However, most current imputation methods mainly focus on single omics data as reviewed in [18], including global methods such as Bayesian principle component analysis (BPCA) [19], and singular value decomposition imputation (SVDimpute) [20], local methods such as k nearest neighbor imputation (KNNimpute) [20], local least square imputation (LLS) [21] and iterative local least square imputation (iLLS) [22], and hybrid methods which combine both global and local methods such Lincmb [23]. The main limitation of these imputation methods is that they only focused on utilizing the information from single omics data. Thus there is an increasing interest in incorporating additional information for the imputation, e.g., biological databases or other omics data [24]. For transcriptomics datasets, a priori information about the functional similarities in term of GO (Gene Ontology) was used for missing value imputation, based on the idea that functionally related genes tend to express in a modular fashion [25]. Experimental results indicated that the imputation accuracy can be enhanced by incorporating GO information, even when the missing rate was large [26, 27]. Other knowledge based impute methods such as integrative missing value estimation method (iMISS) employed the information from multiple external references data to find consistent and reliable neighboring genes of a target missing gene for better estimation [28]. Meta-data imputation method combined multiple available microarray datasets of a species to select top closest columns to impute missing column in target missing matrix [29]. These knowledge-based imputation methods usually require the features (e.g., genes) correspond with each other across diverse datasets and they still focus on one type of omics data. There are some endeavors to incorporate the relationships between diverse omics data into the imputation. Nie et al. proposed a Zero-inflated Poisson regression model to use the correlation between transcriptomics and proteomics datasets for imputing the missing proteomics data [30]. Torres-Garcia et al. published a stochastic Gradient Boosted Trees (GBT) approach to uncover possible nonlinear relationships between transcriptomics and proteomics data. GBT was used to predict those protein abundance not experimentally detected based on the predictors such as mRNA abundance, cellular role, molecular weight, sequence length, protein length, GC content and triplet codon counts [4, 31]. Histone acetylation information was combined into KNNimpute and LLS to improve the missing value estimation of gene expression data [32]. Artificial neural network approach was also applied to impute the missing values of the proteins using the relations between transcriptomics and proteomics data in the study [33].
By extending these methods to incorporate informative features from other types of omics data for the imputation, we developed an ensemble learning based algorithm to deal with missing values. Our multi-omics imputation method takes advantage of the correlation across different omics data with the assumption that the missing feature from one type of omics data can be explained by its neighboring features from the same omics data as well as the features from other omics data. Some prior biological knowledge about interactions among different levels of omics data (e.g., GO, protein-protein interaction database) can also be incorporated. In addition, to account for the situation that there are multiple omics data having missing values, we extended our multi-omics imputation method to simultaneously impute multiple missing omics data. We compared our method with five single omics data imputation methods with respect to different noise levels, sample sizes and missing rates. Moreover, we further evaluated the impact of different imputation methods on downstream analysis, e.g., mRNA-miRNA network reconstruction. The results consistently confirmed the advantage and efficiency of our multi-omics imputation method in terms of the imputation error and the recovery of mRNA-miRNA network.
Methods
In this study, we take three kinds of omics data (e.g., mRNA, microRNA and DNA methylation) as an example to elaborate our method. For each omics data, it is represented by a matrix , where i indicates the type of omics data, pi is the number of rows of each matrix corresponding to different types of features (e.g., gene expression) and n is the number of columns corresponding to different subjects. The missing point at the m-th feature on the l-th subject is denoted by Gm,li, m = 1, 2, …, pi, l = 1, 2, …, n. In the following, we first introduce diverse single omics imputation methods, and then propose multi-omics data imputation and its extension to more general case.
Single omics imputation
For each single omics data matrix, global methods (e.g., BPCA and SVDimpute) and local methods (e.g., KNNimpute, LLS and iLLS) were developed to explore neighboring global or local features to impute missing features, please refer to Additional file 1 A for details. Without the loss of generality, we assume that the target gene gt ∈ Rn in contains missing values located in the first s subjects. Hence,
| 1 |
where gmisst ∈ R1 × s is the missing vector in the target gene and gct ∈ R1 × (n − s) is complete vector containing non-missing values. To estimate the missing vector gmisst, firstly, we compute the distance (Euclidean distance) dt, j between the target gene t and other gene j (or eigengene j [20]); secondly, top k close genes (or eigengenes), denoted by Gk = [Gkmiss, Gkc] ∈ Rk × n are used for imputation. Specifically, KNNimpute estimates gmisst by averaging the weighted values of neighboring genes or eigengenes while the other methods tend to use linear regression as in (2)
| 2 |
where Gkmiss ∈ Rk × s is the submatrix of Gk corresponding to the missing location in the target gene; and β is the coefficient vector to weight the contribution of neighboring genes/eigengenes, which can be estimated by the following least square minimization:
| 3 |
Therefore, the missing values can be approximated by β = (Gkc)†gct, where (Gkc)† is the pseudo inverse of Gkc.
Multi-omics data imputation
Instead of imputing each omics data separately, we proposed to combine multiple information from various omics data such as microRNA (G1), mRNA (G2) and DNA methylation (G3), which have been identified to be correlated with each other in their elements or components [34, 35]. As shown in Fig. 1, we built an integrative model based on ensemble learning [36, 37], which generally consisted of three steps: the first step was ensemble learning which generated a set of basic models; the second was the ensemble pruning, where models were pruned to remove some models with little contributions; the final step was the integration of multiple models into a new prediction model. In this study, we built a predictive model on a set of basic models for missing value estimation, as shown in Fig. 1. Multiple constraints were imposed on each basic model (e.g., non-negativity constraint) to reduce the overfitting as well as the influence of those basic models with little contribution.
Fig. 1.
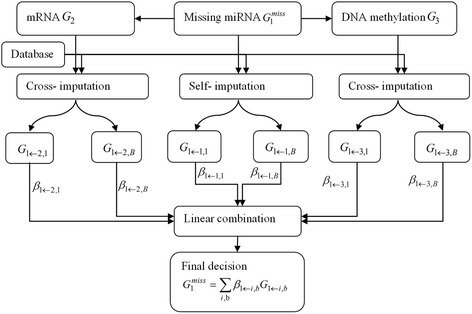
Schematic representation of multi-omics imputation method
The basic models were generated based on three types of imputations, i.e., self-imputation and cross imputation by G2 and G3 respectively. The self-imputation was to impute G1 by itself using single-omics imputation method as mentioned in the section of “Single omics imputation”. The cross-imputation was to impute G1 by other omics data, i.e., G2. Because of the scale difference among different types of omics data, we intended to impute each missing feature in G1 individually by exploiting the correlated information from G2. For each target gene gt = [gmisst, gct] in G1, it was combined with correlated features in G2 to be a new missing matrix H. Matrix H was then imputed by self-imputation methods to estimate gmisst. Eventually, we obtained three imputation outputs for all missing values in G1 by different omics data, denoted by G1 ← 1, G1 ← 2 and G1 ← 3 respectively. Moreover, prior knowledge from accessible databases can also provide extra information (e.g. protein-protein interactions (PPI), co-expressed genes) to improve the imputation accuracy. In this study, we took advantage of information from PPI to partially avoid the overfitting for LLS and iLLS in G2. For example, to impute the expression data of target gene gt by other genes in G2, we collected those genes that had STRING scores > 0.9 [38, 39] with gt in STRING database and had significant correlation (p < 0.05) in G2. We keep these genes in the prediction model for LLS and iLLS during the feature selection procedure. This partially decreased the selection of genes which had random correlations with target gene in G2. To further improve the accuracy of prediction, we considered the generation of heterogeneous learning algorithms that can ensure a level of diversity among the basic models. Diverse models can provide different predictions, which can be combined for better performance. We subsampled features in omics data and re-run the imputation B times to get multiple imputed matrices, {G1 ← 1,b, G1 ← 2,b, G1 ← 3,b}, b = 1, 2, …, B.
To integrate multiple imputation models, we used a least square regression model to combine the outputs from diverse models as
| 4 |
where β1 ← i,b, i = 1, 2, …, m, b = 1, 2, …, B are the weights for different basic imputation models, and j indicates missing location in target gene. Since all these models aim to impute the same missing values, their outputs are highly correlated. Instead of using ridge regression, we imposed non-negative regularization on the coefficients to handle the high multi-colinearity among variables in the model, which has been found to be more reliable and consistent [37]. To avoid the over-fitting issue, we adopted bootstrapping to randomly generate faking missing values at the locations which were not overlapped with true missing locations. The weights were estimated by (4) based on the imputed and true values on the faking missing points (Additional file 1 B). The averaged value of each weight on T times bootstrapping was used for prediction. We set T to be 30 in the following experiments.
Extension of multi-omics data imputation
For integrative analysis of multi-omics data, there are usually missing values on each individual omics data. To handle this situation, we extended our multi-omics imputation method by incorporating an iterative method to simultaneously impute each omics data. The iterative procedure is shown in Table 1. There are two parts in our iterative multi-omics imputation algorithm. The first one is updating each omics data sequentially within the iteration and second one is an iterative procedure. Within each iteration, we impute each missing omics data separately but following a specific order of the number of missing genes from smallest to the largest (i.e. miRNA to mRNA), similar to sequential KNN [40] or sequential LLS impute [41] methods. This is expected to control the propagation of imputation errors from smallest to largest. After one omics data is imputed, the new completed matrix can be used for other omics data imputation to reduce the error. When all of omics data are imputed once, they can be reused to refine the prediction of missing values, as suggested in iterative LLS, iterative KNN [42] and iterative biclustering imputation methods [43].
Table 1.
Algorithm for iterative multi-omics imputation
| A: Initialize with replacing all missing values in all matrices G i, i = 1, 2, 3 by self-imputation methods to obtain complete matrices {G (0)i}. |
| B: for each iteration h, |
| (1). |
| a. Self-impute G 1 based on G (h − 1)1; Cross-impute G 1 by G (h − 1)2, G h − 13 using multi-omics imputation method to obtain G (h)1. |
| b. Self-impute G 2 based on G (h − 1)2; Cross-impute G 2 by G (h)1, using multi-omics imputation method to obtain G (h)2. |
| c. Self-impute G 3 based on G (h − 1)3; Cross-impute G 3 by G (h)1, G (h)2 using multi-omics imputation method to obtain G (h)3. |
| (2). Determine the sum of square of difference on the missing locations j between {G (h − 1)i} and {G (h)i}: |
| C. If δ h ≤ τ, the iteration is stopped and output {G (h)i}; otherwise go to Step 2 to continue the iteration until the convergence criteria τ is reached. |
In the simple case that only one omics data contains missing values, there is only one step in the iteration. In the case of missing values in multiple omics data, compared with performing single omics imputation separately, the advantage of our extended multi-omics imputation is its ability of reusing data in both self-imputation and cross-imputation processes. In current single-omics imputation methods, most of them use row average to impute missing value initially for deriving the neighboring gene/eigengene only once, which can cause biases in the final imputation. Instead of using one-time row average initialization, in each iteration, the self-imputation (e.g., G(h)1 ← 2) is implemented based on the completed matrix from the previous iteration G(h − 1)1 ← 2, which is updated iteratively to reduce the bias. In addition, information from other omics data will be incorporated by the cross-imputation, which can further improve the imputation accuracy, especially when large missing data exist in G(h)1 ← 2.
Evaluation metric
We compared the performance of our proposed multi-omics-based imputation with single-omics-based imputation methods. The performance was evaluated by the normalized root mean squared error (NRMSE) as follows:
| 5 |
where Gji and Ĝji are the true and imputed value of the j-th missing point in the i-th omics data respectively; and N is the number of missing points in all datasets. In addition, we performed a paired t-test for each factor exploration, measuring the significance of NRMSE difference between the methods along with each simulation.
Results
Simulation scheme
We performed simulation analysis to evaluate the performance of our proposed methods based on the MCAR missing mechanism. Simulation data were derived from the cancer genomic atlas (TCGA; http://cancergenome.nih.gov/) database on Glioma cancer study containing 50 subjects with 5939 mRNAs, 104 microRNAs and 5013 DNA methylation sites. We have removed missing values in all of these data, yielding complete data matrices. Based on these observation matrices, a certain percent of entries (e.g., 1, 5 %) was randomly set to have missing values. To evaluate the effect of sample size (e.g., 10, 20 subjects), a specific number of samples was first selected randomly and then missing matrices were generated. Similarly, for different noise levels, a random noise from normal distribution N(0, σ2e) with different standard deviations was added to the observed matrices for missing matrices generation. Each type of missing matrix generation was repeated 50 times, and then several imputation methods were applied for comparison.
First, we compared the single-omics based method with multi-omics based imputation method when only one type of omics data (e.g., miRNA) contained missing values and the other datasets (e.g., mRNA and DNA methylation) were complete. Then, to consider more realistic situation when more than one type of omics data contained missing values, we simulated both mRNA and miRNA datasets with missing values. For simplicity, we set the same missing rate on both datasets. Single-omics-based method was applied to each type of missing matrix, while our iterative multi-omics method was directly used for imputing both datasets simultaneously. Finally, the imputation accuracy was evaluated on both simulations.
Parameters setting
For KNNimpute method, we set the neighboring size to be 15 as suggested in [20, 28]. Both BPCA and SVDimpute depend on the number of principal axes (eigenvectors). The number of eigenvectors selected in SVD imputation was set to be 20 % of the number of samples as tested in [20]; but the number of PCs used in BPCA could be set more loosely as suggested in the earlier study [19] which suggested a safety number of PCs to be k = D-1,where D was the number of samples. The automatic relevance determination prior applied in Bayesian estimation can reduce the redundant dimension automatically. For local regression based methods, LLS impute [21] and iLLS impute [22], a procedure of estimating the optimal number k was applied. Prior to imputation, missing values were initially estimated by row average and some faking missing values were generated with true values known. The methods searched optimal k (LLS) or ratio (iLLS) value from a given range (e.g., k between 2 and D-1 or ratio between 0 and 1) with the lowest estimation error.
Comparison on single missing omics data
We simulated one omics data (e.g., miRNA) with missing values while keeping the other omics datasets (e.g., mRNA and DNA methylation) to be complete. Five popular imputation methods were applied to single missing omics data, which were then compared with our proposed multi-omics imputation method. Three simulations were performed to study the effects of three factors on imputation accuracy: missing rate, sample size and noise level.
Effect of missing rate
We randomly generated missing values in miRNA matrix with different percent of missing rate (e.g., 1, 5, 10, 15 and 20 %) for comparison. Figure 2 shows the performance of five imputation methods applied to single missing omics data and compared to our method using multiple omics data with different missing rates. The results show significant decrease of NRMSE with our multi-omics based method over five prevalent methods for single-omics. This improvement is demonstrated consistently across all different missing rates, showing the efficiency of our method in utilizing complementary information from mRNA and DNA methylation dataset. With the increase of missing rate, the performance of all methods is degraded with increasing NRMSE. Especially for global algorithms, i.e., BPCA and SVDimpute, the decrease of NRMSE is more significant than using local algorithms, indicating the larger effect of missing data rate on using global features (e.g., principle components of data matrix) than that on local feature selection. However, this decrease is reduced by using extra information from other datasets in our multi-omics imputation, indicating the advantage of using multi-omics data in our method over single-omics method.
Fig. 2.
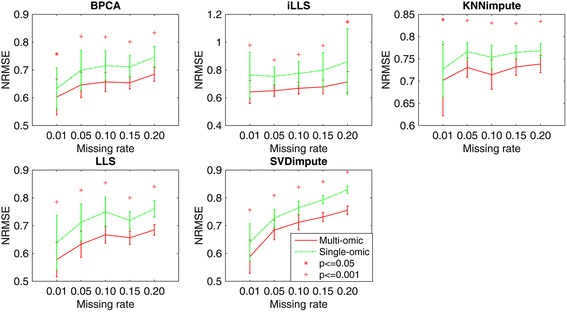
Average NRMSE by five imputation algorithms (BPCA, iLLS, KNNimpute, LLS and SVDimpute) on single omics data v.s. multiple omics datasets with different missing rates (e.g., 1, 5, 10, 15 and 20 %)
Effect of sample size
Imputation accuracy may be influenced by the number of samples in the missing data. Too few samples can lead to large variances of the imputed values. For local algorithms, mostly based on regression models, few sample size will lead to the increases of the variance of estimated coefficients; for global algorithms, the matrix tends to be ill-conditioned if the sample size is limited. To evaluate the effect of sample size on the performance of our imputation method, we simulated five datasets with sample size from 10 to 50, and randomly set 5 % missing values in each dataset. Figure 3 shows the influence of sample size on both single-omics and multi-omics imputation methods. It can be seen that our multi-omics method consistently outperforms single-omics method with respect to all sample sizes, indicating the benefit of incorporating extra information, especially when the sample size is small. In most algorithms, both the imputation error and variance are generally decreasing with the increase of sample size, showing the importance of sample size for reducing imputation errors. For iLLS and LLS, the gain of multi-omics method over single omics method is relatively stable regardless of sample size. However, for KNNimpute and SVDimpute algorithms, the influence of sample size is significant, in that NRMSE decreases rapidly by increasing sample size. In particular, when sample size is small (<30), the NRMSE of single-omics method increases significantly while our multi-omics method shows less increase, demonstrating the advantage of multi-omics method.
Fig. 3.
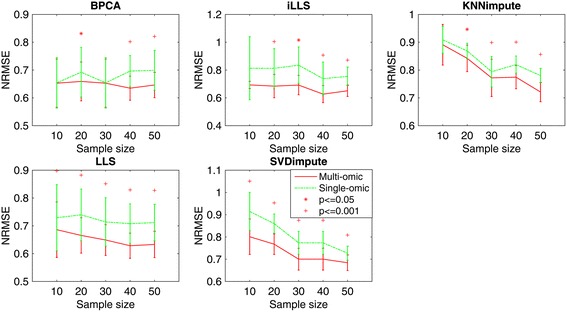
Average NRMSE by five imputation algorithms (BPCA, iLLS, KNNimpute, LLS and SVDimpute) on single omics data v.s. multiple omics datasets with different sample size (10, 20, 30, 40 and 50)
Effect of noise level
Due to technical limitations, there are a variety of noises introduced in the collected data, which may cause difficulty in imputation. To test the robustness of diverse imputation methods to noise, we simulated five datasets by adding different levels of Gaussian noise with varying standard deviations (std) from 0.1 to 1. The sample size was set to be 50 and missing rate was 5 % in all datasets.
Figure 4 shows the comparison of single-omics and multi-omics imputation methods by varying noise level from 0.1 to 1.0. For all five algorithms, significant increase of NRMSE can be seen with the increasing level of noise. Our multi-omics method consistently outperforms single-omics method among all algorithms, showing the importance of using complementary information (mRNA and DNA methylation) to suppress noise in miRNA. In addition, with the increase of noise level (e.g., std > 0.5), the performance gain of multi-omics method over single omics method also increases, indicating its better robustness to noise.
Fig. 4.
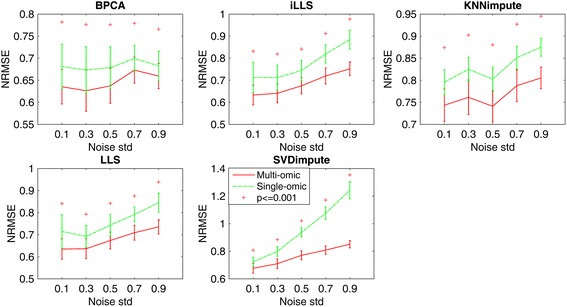
Average NRMSE by five imputation algorithms (BPCA, iLLS, KNNimpute, LLS and SVDimpute) on single omics data only v.s. multiple omics datasets with noise of different standard deviations (std) from 0.1 to 1
Comparisons on multiple missing omics data
To further evaluate the imputation methods when there are missing values in multiple omics data, we simulated mRNA and miRNA datasets with different missing rates of 1, 5 and 10 % respectively. Five single-omics methods were used to impute each missing data separately and then compared with our iterative multi-omics imputation method, which can impute both missing matrices simultaneously.
Figure 5 shows the comparison of NRMSE between our iterative multi-omics imputation method and other single-omics methods on imputing both mRNA (Fig. 5a) and miRNA (Fig. 5b) missing matrices. Similar to the results in Fig. 4, our multi-omics method can significantly decrease the NRMSE of miRNA matrix imputation than all five single-omics methods. This improvement is not consistently found in mRNA imputation, as shown in Fig. 5(a). Local imputation methods such as LLS and iLLS show no change of NRMSE between our method and single-omics method; however, they deliver much lower NRMSE value than the other three methods. This may be because local mRNA expressions were highly correlated and local features can provide enough information for imputation. Moreover, although correlation exists between miRNA and mRNA, because of the small number of miRNA probes, they are not expected to provide much extra information for mRNA imputation.
Fig. 5.
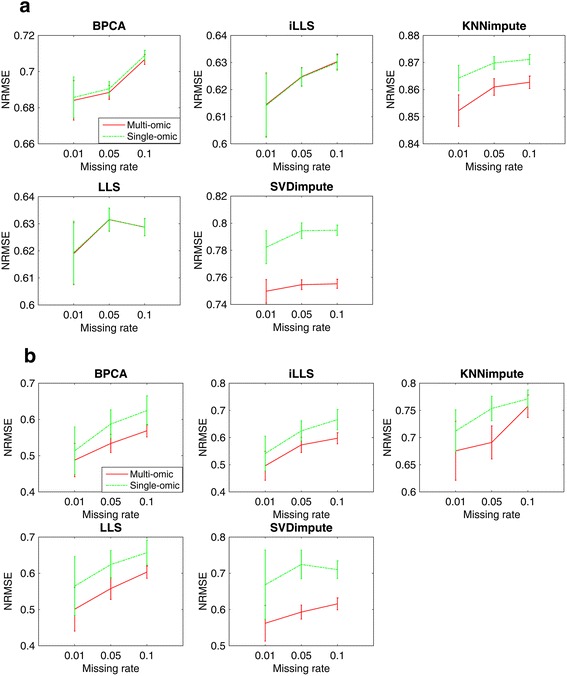
The NRMSE of iterative multi-omics imputation and five single-omics imputation methods on both a mRNA and b miRNA missing matrices
Comparisons for network analysis
Besides the comparison of imputation accuracy between different methods, we further evaluated the influence of different imputation methods on downstream analysis, e.g., reconstruction of regulatory network between mRNA and miRNA, which is significant for exploring the interactions between different omics. There are a variety of methods proposed for reconstructing genetic regulatory networks. We applied a web tool, miRNA and genes integrated analysis (MAGIA) [44], to reconstruct fundamental post-transcriptional regulatory networks between miRNAs and mRNAs for Glioma cancer. The Pearson correlation was used as the measure of interactions between each pair of miRNA and mRNA expressions on the matched design. Then the combination of two target prediction algorithms (PicTar and PITA) was applied to predict the target of miRNA and thus the mRNA-miRNA regulatory network was built based on significant test on each interaction.
We evaluated network reconstruction as a binary classification task (prediction of absence or presence of mRNA-miRNA interaction). The original network was constructed by using completed matrices. Then for each network built on the imputed matrices, a receiver operating characteristics (ROC) curve was derived by varying correlation threshold. The area under curve (AUC) was calculated to evaluate the influence of different imputation methods on regulatory network. Higher AUC indicates better capability of preserving significant interactions while lower AUC means worse effect of imputation methods on network structure reconstruction.
Missing matrices of mRNA and miRNA were imputed and regulatory network was reconstructed by MAGIA using the correlation based algorithm. The original network structure was built based on complete matrices and their interactions (p < 1 × 10⁻⁴) were selected to be significant. There are 655 mRNA-miRNA interactions selected corresponding to the correlation value less than −0.55. For each pair of imputed mRNA and miRNA matrices by different methods, their interactions were reconstructed and compared with significant interaction set to obtain false positive rate (FPR) and true positive rate (TPR). Figure 6 shows the ROC plots, which compared the performance of iterative multi-omics imputation and single-omics imputation (i.e., KNNimpute) algorithms on recovering true mRNA-miRNA interactions. The curves were plotted by choosing different correlation thresholds. When missing rate is small, e.g., 1 %, both imputation methods give similar network structures with relatively better performance of multi-omics method for the two higher missing rates. The difference between two ROCs increases as the missing rate increases, showing the advantage of our iterative method for preserving significant mRNA-miRNA interactions
Fig. 6.
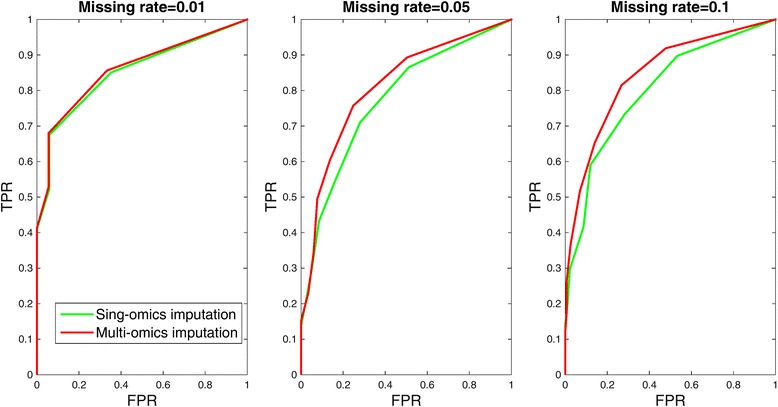
The ROC plots of identifying mRNA-miRNA interaction based on data imputed by iterative multi-omics imputation method and single-omics imputation (KNNimpute) method respectively. Missing rate changes from 0.01 to 0.1
We further used AUC as a metric to compare their performances. The results shown in Fig. 7 were averaged on 15 replications. It can be seen that the missing value rate affects the network structure severely. High missing rate leads to reduced power of miRNA-mRNA identification (i.e., decrease of AUC) by applying single-omics imputation. However, our iterative imputation can compensate for this decrease by improving the imputation accuracy and utilizing correlations among omics data. This improvement was demonstrated consistently across all five algorithms, especially in local algorithms (e.g., KNNimpute, LLS, iLLS).
Fig. 7.
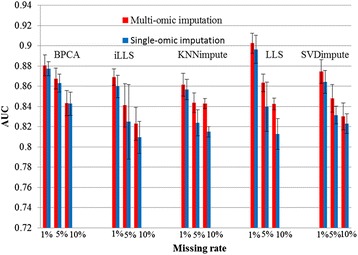
The AUC comparison between iterative multi-omics imputation and single-omics imputation methods by changing missing rate from 0.01 to 0.1
Discussion
In this work, our multi-omics imputation method is able to combine the estimations from various basic models linearly to estimate missing values, e.g., self-imputation and cross-imputation. Multi-omics imputation method aims to employ information from different sources (e.g., diverse omics data). Each source is expected to contribute partially to the estimation. Similar to the contribution measure in [23], source contribution can be reflected in the coefficient weight in the final linear combination model as shown in (4). We evaluated the coefficient value of each source in the simulation of varying missing rate (data not shown). The weights of sources in most methods (except KNNimpute) are stable with the change of missing rate. miRNA shows higher weights than the other omics, indicating that self-information is still most important for imputation in this simulation. The other omics data also contain useful information and contribute to the improvement of imputation with appropriate weights. In addition to building basic model by different omics data, there are some other basic models such as multiple single-omics imputation algorithms that can also be incorporated as basic models and combined with cross-imputation estimation. Similar to the results discussed in [23], other types of single-omics imputation algorithms may also provide complementary information to improve imputation accuracy.
The cross-imputation part of the proposed multi-omics imputation method is based on regression model which requires the subjects cross omics data to be matched, while this case may not always hold in real data analysis. For the case that some subjects are shared across multiple omics data while some are omics data specific, we suggest the following imputation strategy: if those missing points are located on the subjects having only one type of omics data, only self-imputation part can be used in the proposed method, which degrades to single-omics imputation; for other missing points happened on subjects assayed with more than one types of omics data, both self-imputation and cross-imputation can be applied and combined in our method.
Since most of single-omics imputation methods were evaluated by simulations based on MCAR missing mechanism, we applied the same simulation strategy in this study for evaluation of multi-omics imputation performance. However, this assumption may not always hold in reality. Two other missing mechanisms (MAR and MNAR) may also be possible in expression data, as mentioned in Introduction. We further evaluated the performance of imputation methods with MAR missing mechanism by assuming data missing in some specific genes or proteins (e.g., existing on neighboring genes or probes). This missing may be due to the contamination of slides in the experiment, which can be documented for users. Additional file 1: Figure S1 shows the results of comparisons. There is no significant difference between two simulation schemes when missing rate is low (<0.2), indicating the insensitivity of the imputation methods to the way of how missing values are generated. When missing rate is high (i.e., 0.2), NRMSE in MAR imputation is much higher than that with MCAR missing, because of more information loss of these neighboring genes in MAR simulation (they all contain missing values). More importantly, the multi-omic method still shows significant improvement over single-omics methods since extra information can be provided by other omics data. For more complicated MNAR missing mechanisms, the loss of valuable information causing the missingness may make the most of imputation methods to be suboptimal and the estimation of missing patterns to be infeasible [1, 11]. Although this case is not discussed in this study, it is still expected that imputation method incorporating informative features from different types of omics data will outperform single-omics imputation methods, given the advantage of integrating more information from multiple omics data.
Conclusions
We proposed a novel multi-omics imputation framework, which can take advantage of information from multiple omics data for improving the imputation accuracy. With the production of vast multi-omics data, there is increasing knowledge about complex biological relationship among multiple levels of omics (e.g., co-expression or co-regulation among gene expression, miRNA expression and transcriptional factors). We proposed multi-omics imputation method to exploit the underlying cross-omics relationship for missing value imputation. Experimental results confirmed the advantage of our multi-omics based method over five single-omics imputation methods (KNNimpute, BPCA, SVDimpute, LLS and iLLS) consistently in all three different scenarios in terms of lower value of NRMSE. To handle multiple omics data with missing values, we extended the imputation method, so it can utilize the relationship among multi-omics data iteratively to impute multiple missing omics data simultaneously. Compared with conventional single-omics methods for imputing each omics data separately, our iterative method is able to improve the imputation accuracy significantly in each missing omics data, especially for lower dimensional omics datasets, e.g., miRNA. In addition, the evaluation of mRNA-miRNA regulatory network demonstrated that our iterative method outperforms all five single-omics methods in uncovering the relationship across omics data, which is therefore significant for the study of biological regulatory mechanisms.
Abbreviations
AUC, the area under curve; BPCA, Bayesian principle component analysis; FPR, false positive rate; GBT, Gradient Boosted Trees; GO, Gene Ontology; iLLS, iterative local least square; iMISS, integrative missing value estimation method; KNNimpute, k nearest neighboring impute; LLS, local least square; MAGIA, miRNA and genes integrated analysis; MAR, missing at random; MCAR, missing completely at random; MNAR, missing not at random; NRMSE, normalized root mean squared error; PPI, protein-protein interactions; ROC, the receiver operating characteristics curve; SVDimpute, singular value decomposition impute; TCGA, the cancer genomic atlas; TPR, true positive rate
Acknowledgements
This work was supported by NIH [R01 GM109068, R01 MH 107354 and R01 MH104680] and NSF (#1539067).
Funding
This work was supported by NIH [R01 GM109068, R01 MH 107354 and R01 MH104680] and NSF (#1539067). Non-financial competing interests are included.
Availability of data and materials
The Glioma cancer data is available at the cancer genomic atlas (TCGA; http://cancergenome.nih.gov/).
Authors’ contributions
DL and JZ designed the experiments and methods. JY and CX implemented the comparisons with other algorithms. HD and YW participated in the design and coordination of study and drafted the manuscript. All authors read and approved the final manuscript.
Competing interests
The authors declare that they have no competing interests.
Consent for publication
Not applicable.
Ethics approval and consent to participate
Not applicable.
Additional file
The document contains the brief introduction of various single-omics imputation methods, the algorithm of proposed multi-omics imputation method and the comparison of different imputation methods on simulation using MAR mechanism. (DOCX 122 kb)
Contributor Information
Dongdong Lin, Email: dlin5@tulane.edu.
Jigang Zhang, Email: jzhang9@tulane.edu.
Jingyao Li, Email: jli12@tulane.edu.
Chao Xu, Email: cxu2@tulane.edu.
Hong-Wen Deng, Email: hdeng2@tulane.edu.
Yu-Ping Wang, Email: wyp@tulane.edu.
References
- 1.Aittokallio T. Dealing with missing values in large-scale studies: microarray data imputation and beyond. Brief Bioinform. 2010;11(2):253–264. doi: 10.1093/bib/bbp059. [DOI] [PubMed] [Google Scholar]
- 2.Albrecht D, Kniemeyer O, Brakhage AA, Guthke R. Missing values in gel-based proteomics. Proteomics. 2010;10(6):1202–1211. doi: 10.1002/pmic.200800576. [DOI] [PubMed] [Google Scholar]
- 3.Pedreschi R, Hertog ML, Carpentier SC, Lammertyn J, Robben J, Noben JP, Panis B, Swennen R, Nicolai BM. Treatment of missing values for multivariate statistical analysis of gel-based proteomics data. Proteomics. 2008;8(7):1371–1383. doi: 10.1002/pmic.200700975. [DOI] [PubMed] [Google Scholar]
- 4.Torres-Garcia W, Zhang W, Runger GC, Johnson RH, Meldrum DR. Integrative analysis of transcriptomic and proteomic data of Desulfovibrio vulgaris: a non-linear model to predict abundance of undetected proteins. Bioinformatics. 2009;25(15):1905–1914. doi: 10.1093/bioinformatics/btp325. [DOI] [PMC free article] [PubMed] [Google Scholar]
- 5.Zhang W, Gritsenko MA, Moore RJ, Culley DE, Nie L, Petritis K, Strittmatter EF, Camp DG, 2nd, Smith RD, Brockman FJ. A proteomic view of Desulfovibrio vulgaris metabolism as determined by liquid chromatography coupled with tandem mass spectrometry. Proteomics. 2006;6(15):4286–4299. doi: 10.1002/pmic.200500930. [DOI] [PubMed] [Google Scholar]
- 6.Scherl A, Francois P, Charbonnier Y, Deshusses JM, Koessler T, Huyghe A, Bento M, Stahl-Zeng J, Fischer A, Masselot A, et al. Exploring glycopeptide-resistance in Staphylococcus aureus: a combined proteomics and transcriptomics approach for the identification of resistance-related markers. BMC Genomics. 2006;7:296. doi: 10.1186/1471-2164-7-296. [DOI] [PMC free article] [PubMed] [Google Scholar]
- 7.Webb-Robertson BJ, Matzke MM, Metz TO, McDermott JE, Walker H, Rodland KD, Pounds JG, Waters KM. Sequential projection pursuit principal component analysis--dealing with missing data associated with new -omics technologies. Biotechniques. 2013;54(3):165–168. doi: 10.2144/000113978. [DOI] [PMC free article] [PubMed] [Google Scholar]
- 8.Schetter AJ, Leung SY, Sohn JJ, Zanetti KA, Bowman ED, Yanaihara N, Yuen ST, Chan TL, Kwong DL, Au GK, et al. MicroRNA expression profiles associated with prognosis and therapeutic outcome in colon adenocarcinoma. JAMA. 2008;299(4):425–436. doi: 10.1001/jama.299.4.425. [DOI] [PMC free article] [PubMed] [Google Scholar]
- 9.Kang J, Xu EY. An integrated hierarchical Bayesian approach to normalizing left-censored microRNA microarray data. BMC Genomics. 2013;14:507. doi: 10.1186/1471-2164-14-507. [DOI] [PMC free article] [PubMed] [Google Scholar]
- 10.Graham JW. Missing data: Analysis and design. New York City: headquarter. Springer Science & Business Media; 2012.
- 11.Little RJ, Rubin DB. Statistical analysis with missing data. Hoboken, New Jersey: John Wiley & Sons; 2014.
- 12.Ouyang M, Welsh WJ, Georgopoulos P. Gaussian mixture clustering and imputation of microarray data. Bioinformatics. 2004;20(6):917–923. doi: 10.1093/bioinformatics/bth007. [DOI] [PubMed] [Google Scholar]
- 13.Jornsten R, Wang HY, Welsh WJ, Ouyang M. DNA microarray data imputation and significance analysis of differential expression. Bioinformatics. 2005;21(22):4155–4161. doi: 10.1093/bioinformatics/bti638. [DOI] [PubMed] [Google Scholar]
- 14.Wang D, Lv Y, Guo Z, Li X, Li Y, Zhu J, Yang D, Xu J, Wang C, Rao S, et al. Effects of replacing the unreliable cDNA microarray measurements on the disease classification based on gene expression profiles and functional modules. Bioinformatics. 2006;22(23):2883–2889. doi: 10.1093/bioinformatics/btl339. [DOI] [PubMed] [Google Scholar]
- 15.Chai LE, Law CK, Mohamad MS, Chong CK, Choon YW, Deris S, Illias RM. Investigating the effects of imputation methods for modelling gene networks using a dynamic bayesian network from gene expression data. Malays J Med Sci. 2014;21(2):20–27. [PMC free article] [PubMed] [Google Scholar]
- 16.Pei YF, Zhang L, Li J, Deng HW. Analyses and comparison of imputation-based association methods. PLoS One. 2010;5(5):e10827. doi: 10.1371/journal.pone.0010827. [DOI] [PMC free article] [PubMed] [Google Scholar]
- 17.Zhang W, Spector TD, Deloukas P, Bell JT, Engelhardt BE. Predicting genome-wide DNA methylation using methylation marks, genomic position, and DNA regulatory elements. Genome Biol. 2015;16:14. doi: 10.1186/s13059-015-0581-9. [DOI] [PMC free article] [PubMed] [Google Scholar]
- 18.Liew AW-C, Law N-F, Yan H. Missing value imputation for gene expression data: computational techniques to recover missing data from available information. Brief Bioinform. 2011;12(5):498–513. doi: 10.1093/bib/bbq080. [DOI] [PubMed] [Google Scholar]
- 19.Oba S, Sato M-A, Takemasa I, Monden M, Matsubara K-I, Ishii S. A Bayesian missing value estimation method for gene expression profile data. Bioinformatics. 2003;19(16):2088–2096. doi: 10.1093/bioinformatics/btg287. [DOI] [PubMed] [Google Scholar]
- 20.Troyanskaya O, Cantor M, Sherlock G, Brown P, Hastie T, Tibshirani R, Botstein D, Altman RB. Missing value estimation methods for DNA microarrays. Bioinformatics. 2001;17(6):520–525. doi: 10.1093/bioinformatics/17.6.520. [DOI] [PubMed] [Google Scholar]
- 21.Kim H, Golub GH, Park H. Missing value estimation for DNA microarray gene expression data: local least squares imputation. Bioinformatics. 2005;21(2):187–198. doi: 10.1093/bioinformatics/bth499. [DOI] [PubMed] [Google Scholar]
- 22.Cai Z, Heydari M, Lin G. Iterated local least squares microarray missing value imputation. J Bioinform Comput Biol. 2006;4(05):935–957. doi: 10.1142/S0219720006002302. [DOI] [PubMed] [Google Scholar]
- 23.Jörnsten R, Wang H-Y, Welsh WJ, Ouyang M. DNA microarray data imputation and significance analysis of differential expression. Bioinformatics. 2005;21(22):4155–4161. doi: 10.1093/bioinformatics/bti638. [DOI] [PubMed] [Google Scholar]
- 24.Haider S, Pal R. Integrated analysis of transcriptomic and proteomic data. Curr Genomics. 2013;14(2):91–110. doi: 10.2174/1389202911314020003. [DOI] [PMC free article] [PubMed] [Google Scholar]
- 25.Hartwell LH, Hopfield JJ, Leibler S, Murray AW. From molecular to modular cell biology. Nature. 1999;402(6761 Suppl):C47–C52. doi: 10.1038/35011540. [DOI] [PubMed] [Google Scholar]
- 26.Gan X, Liew AW, Yan H. Microarray missing data imputation based on a set theoretic framework and biological knowledge. Nucleic Acids Res. 2006;34(5):1608–1619. doi: 10.1093/nar/gkl047. [DOI] [PMC free article] [PubMed] [Google Scholar]
- 27.Tuikkala J, Elo L, Nevalainen OS, Aittokallio T. Improving missing value estimation in microarray data with gene ontology. Bioinformatics. 2006;22(5):566–572. doi: 10.1093/bioinformatics/btk019. [DOI] [PubMed] [Google Scholar]
- 28.Hu J, Li H, Waterman MS, Zhou X. Integrative missing value estimation for microarray data. BMC Bioinformatics. 2006;7(1):1. doi: 10.1186/1471-2105-7-1. [DOI] [PMC free article] [PubMed] [Google Scholar]
- 29.Jörnsten R, Ouyang M, Wang H-Y. A meta-data based method for DNA microarray imputation. BMC Bioinformatics. 2007;8(1):109. doi: 10.1186/1471-2105-8-109. [DOI] [PMC free article] [PubMed] [Google Scholar]
- 30.Nie L, Wu G, Brockman FJ, Zhang W. Integrated analysis of transcriptomic and proteomic data of Desulfovibrio vulgaris: zero-inflated Poisson regression models to predict abundance of undetected proteins. Bioinformatics. 2006;22(13):1641–1647. doi: 10.1093/bioinformatics/btl134. [DOI] [PubMed] [Google Scholar]
- 31.Torres-Garcia W, Brown SD, Johnson RH, Zhang W, Runger GC, Meldrum DR. Integrative analysis of transcriptomic and proteomic data of Shewanella oneidensis: missing value imputation using temporal datasets. Mol Biosyst. 2011;7(4):1093–1104. doi: 10.1039/c0mb00260g. [DOI] [PubMed] [Google Scholar]
- 32.Xiang Q, Dai X, Deng Y, He C, Wang J, Feng J, Dai Z. Missing value imputation for microarray gene expression data using histone acetylation information. BMC Bioinformatics. 2008;9:252. doi: 10.1186/1471-2105-9-252. [DOI] [PMC free article] [PubMed] [Google Scholar]
- 33.Li F, Nie L, Wu G, Qiao J, Zhang W. Prediction and characterization of missing proteomic data in desulfovibrio vulgaris. Comp Funct Genomics. 2011;2011:780973. doi: 10.1155/2011/780973. [DOI] [PMC free article] [PubMed] [Google Scholar]
- 34.Nie L, Wu G, Culley DE, Scholten JC, Zhang W. Integrative analysis of transcriptomic and proteomic data: challenges, solutions and applications. Crit Rev Biotechnol. 2007;27(2):63–75. doi: 10.1080/07388550701334212. [DOI] [PubMed] [Google Scholar]
- 35.Maier T, Guell M, Serrano L. Correlation of mRNA and protein in complex biological samples. FEBS Lett. 2009;583(24):3966–3973. doi: 10.1016/j.febslet.2009.10.036. [DOI] [PubMed] [Google Scholar]
- 36.Dietterich TG. Ensemble methods in machine learning. In: Heidelberg: Springer Berlin Heidelberg. Multiple classifier systems. Springer; 2000. p. 1–15.
- 37.Breiman L. Stacked regressions. Mach Learn. 1996;24(1):49–64. [Google Scholar]
- 38.Cirillo D, Botta-Orfila T, Tartaglia GG. By the company they keep: interaction networks define the binding ability of transcription factors. Nucleic Acids Res. 2015;43(19):e125. doi: 10.1093/nar/gkv607. [DOI] [PMC free article] [PubMed] [Google Scholar]
- 39.Szklarczyk D, Franceschini A, Wyder S, Forslund K, Heller D, Huerta-Cepas J, Simonovic M, Roth A, Santos A, Tsafou KP. STRING v10: protein–protein interaction networks, integrated over the tree of life. Nucleic Acids Res. 2015;43:D447–D452. doi: 10.1093/nar/gku1003. [DOI] [PMC free article] [PubMed] [Google Scholar]
- 40.Kim K-Y, Kim B-J, Yi G-S. Reuse of imputed data in microarray analysis increases imputation efficiency. BMC Bioinformatics. 2004;5(1):1. doi: 10.1186/1471-2105-5-160. [DOI] [PMC free article] [PubMed] [Google Scholar]
- 41.Zhang X, Song X, Wang H, Zhang H. Sequential local least squares imputation estimating missing value of microarray data. Comput Biol Med. 2008;38(10):1112–1120. doi: 10.1016/j.compbiomed.2008.08.006. [DOI] [PubMed] [Google Scholar]
- 42.Brás LP, Menezes JC. Improving cluster-based missing value estimation of DNA microarray data. Biomol Eng. 2007;24(2):273–282. doi: 10.1016/j.bioeng.2007.04.003. [DOI] [PubMed] [Google Scholar]
- 43.Cheng K-O, Law N-F, Siu W-C. Iterative bicluster-based least square framework for estimation of missing values in microarray gene expression data. Pattern Recogn. 2012;45(4):1281–1289. doi: 10.1016/j.patcog.2011.10.012. [DOI] [Google Scholar]
- 44.Sales G, Coppe A, Bisognin A, Biasiolo M, Bortoluzzi S, Romualdi C. MAGIA, a web-based tool for miRNA and Genes Integrated Analysis. Nucleic Acids Res. 2010;38:W352–W359. doi: 10.1093/nar/gkq423. [DOI] [PMC free article] [PubMed] [Google Scholar]
Associated Data
This section collects any data citations, data availability statements, or supplementary materials included in this article.
Data Availability Statement
The Glioma cancer data is available at the cancer genomic atlas (TCGA; http://cancergenome.nih.gov/).