

Summary
Muscarinic M1–M5 acetylcholine receptors are G protein-coupled receptors (GPCRs) that regulate many vital functions of the central and peripheral nervous systems. In particular, the M1 and M4 receptor subtypes have emerged as attractive drug targets for treatments of neurological disorders, such as Alzheimer's disease and schizophrenia, but the high conservation of the acetylcholine-binding pocket has spurred current research into targeting allosteric sites on these receptors. Here, we report the first crystal structures of the M1 and M4 muscarinic receptors bound to the inverse agonist, tiotropium. Comparison of these structures to each other, as well as the previously reported M2 and M3 receptor structures, reveals differences in the orthosteric and allosteric binding sites that contribute to a role in drug selectivity at this important receptor family. We also report identification of a cluster of residues that form a network linking the orthosteric and allosteric sites of the M4 receptor, which provides new insight into how allosteric modulation may be transmitted between the two spatially distinct domains.
The M1 – M5 muscarinic acetylcholine receptors constitute an important family of Class A GPCRs activated by the neurotransmitter, acetylcholine1. Both the M1 and M4 receptors have been associated with learning, memory, and cognition2,3 and have emerged as attractive targets for the treatment of various central nervous system disorders, including Alzheimer's disease, schizophrenia and drug addiction4-6. However, the orthosteric acetylcholine-binding site is highly conserved, and the clinical translation of compounds targeting these receptor subtypes has remained largely unsuccessful due to adverse side effects from off-target activity at peripheral M2 and M3 receptor subtypes7-9. Encouragingly, muscarinic receptors possess spatially distinct allosteric binding sites that offer greater potential for selective receptor targeting10-12, and the M1 and M4 receptors are prime examples where highly selective positive allosteric modulators (PAMs) with central nervous system activity and preclinical efficacy have been identified4,13-17.
To date, however, the structural basis of drug action at these receptor types has been largely restricted to mutational analyses18-21, with the only reported muscarinic receptor crystal structures being of the M2 and M3 subtypes22,23. Thus, to better understand the molecular basis for orthosteric and allosteric drug interactions with the M1 and M4 receptors, we sought to obtain high-resolution x-ray crystal structures of both subtypes. To gain additional insight into potential mechanisms of allosteric modulation, we complemented our findings with active-state homology modelling to rationalize the effects of targeted mutations on the interaction between a well-characterized PAM and acetylcholine at the M4 receptor.
Crystallization of the M1 and M4 receptors
To determine the structures of the M1 and M4 muscarinic receptors, we utilized protein engineering and lipidic cubic phase methodology24,25. Both receptors were crystallized in the presence of the high affinity and clinically utilized inverse agonist, tiotropium (Spiriva®), to stabilize the inactive-state. Intracellular loop 3 (ICL3) of the M1 receptor was replaced with a T4 lysozyme fusion protein, and in the case of the M4 receptor a minimal T4 lysozyme (mT4L)26 fusion was utilized to aid crystallization (Extended Data Fig. 1). It was also necessary to remove the first 21 residues of the N-terminus from the M4 receptor to improve diffraction. The M1 receptor was also crystallized with the N2Q and N12Q mutations to remove glycosylation sites, and, unintentionally, an N110Q3.37 mutation. Importantly, the binding affinities of [3H]QNB (M1 receptor), [3H]NMS (M4 receptor), acetylcholine or tiotropium were not significantly different at either fusion construct when compared to the wild-type receptor, suggesting that the alterations did not perturb the orthosteric site; the M1 N110Q3.37 mutation also had no significant effect on receptor functionality in the absence of T4 lysozyme (Supplementary Table 1). The M1 and M4 structures were subsequently determined to a resolution of 2.7 Å and 2.6 Å, respectively (Extended Data Table 1).
Comparison of muscarinic receptor structures
Overall, the structures of the M1 and M4 receptor are similar to the previously solved inactive M2 and M3 receptors22,23, with similar positioning of the seven-transmembrane (TM1–7) bundle and root mean squared deviations of 0.6 – 0.9 Å (Fig. 1a). Subtle differences between the receptors are observed on the extracellular and intracellular sides (Fig. 1b,c) corresponding to regions that are least conserved across the muscarinic subtypes (Extended Data Fig. 2). For example, the M2 receptor differs from the other receptors in the tilt and position of TM1 and TM7 (Fig. 1a,b). Notably, the M1 receptor was co-crystallized with a FLAG peptide co-bound on the intracellular side, which makes extensive contacts with TM6 and ICL3 (Extended Data Fig. 3a,b), and likely contributes to observed differences in TM5, TM6, and a variable linkage between TM7–helix8 (Extended Data Fig. 3c). The M1-N110Q3.37 mutation has little effect on the M1 structure other than creating a slight bulge in TM4 due to the loss of a hydrogen bond with S4.53 (Extended Data Fig. 3d). More interestingly, the M4 receptor was crystallized with an intact ionic lock (Extended Data Fig. 3e) a feature uncommonly seen in other GPCRs and not present in the other muscarinic structures. It is important to note that the observed differences in the intra- and extracellular sides of the receptor occur in regions that are solvent accessible or are involved in crystal packing interactions, which could contribute to the observed perturbations between subtypes; however, none of the crystal packing interactions grossly affect the structure or the core of the receptor.
Figure 1. Structural comparison of the M1–M4 receptors.
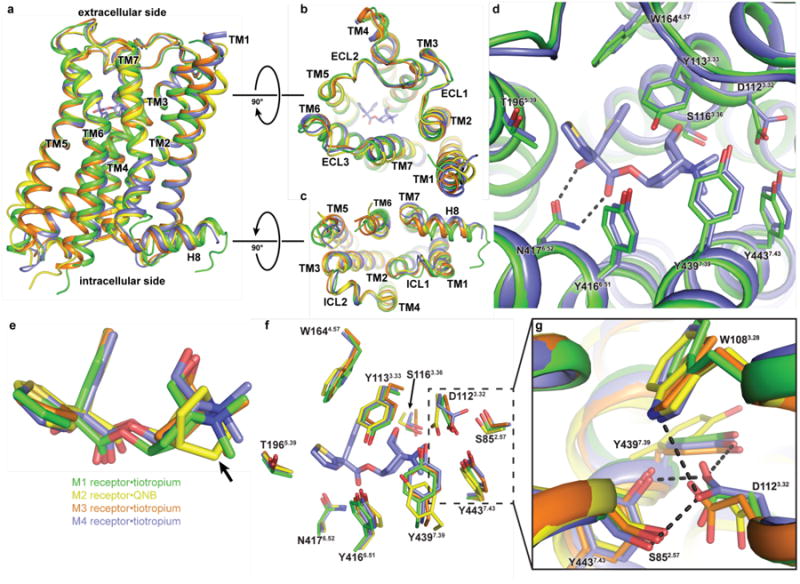
a, The overall view of the muscarinic structures is shown as cartoons aligned to the M3 receptor, with the M1 coloured in green, M2 in yellow (PDB: 3UON), M3 (PDB: 4U15, chain A) in orange and M4 (chain A) in blue. Root mean squared deviations for the alignment (excluding T4L fusions) of M1, M2 and M4 versus the M3 receptor are 0.86 Å, 0.81 Å, and 0.62 Å, respectively. The ligand, tiotropium, for the M4 receptor is shown as sticks and coloured according to element: carbon, light blue; oxygen, red; nitrogen, dark blue; sulphur, yellow. b,c Comparison of the views from (b) the extracellular side and (c) the intracellular side d, M1 and M4 residues involved in tiotropium binding are shown as sticks (several residues are omitted for clarity). The black dashed line indicates a bidentate hydrogen bond between N6.52 and tiotropium. e, Superposition of tiotropium from the M1, M3 and M4 structures and QNB from the M2 structure. The arrow indicates the main structural difference between tiotropium and QNB. f, Comparison of the orthosteric binding site of the M1–M4 receptors with orthosteric site residues shown as sticks. g, The rotameric change of D1123.32 is stabilized by a network of hydrogen bonds.
Like the inactive M3 receptor, the M1 and M4 receptors were crystallized in complex with the inverse agonist, tiotropium, and this binding site is buried deep within the transmembrane core (Fig. 1d). The binding pose of tiotropium and surrounding residues between these three structures is nearly identical (Fig. 1d-f), which is not surprising given the near absolute conservation of residues lining the orthosteric site in the muscarinic family (Extended Data Fig. 2). However, this high degree of sequence conservation does not preclude the possibility of differences in tertiary structure with respect to the orthosteric site. Indeed, one surprising difference is a change in the rotamer of D1123.32 of the M4 receptor (Fig. 1 f,g); a residue that is conserved throughout the biogenic amine GPCRs and serves as the counter ion for positively charged neurotransmitters27. This rotameric change points D1123.32 away from tiotropium and is accompanied by slight movements of Y4397.39 and Y4437.43, allowing them to form a network of hydrogen bond interactions between D1123.32 and S852.57, W1083.28, Y4397.39 and Y4437.43, which is distinct from the M1, M2 and M3 muscarinic receptor structures (Fig. 1g).
Further comparison of the M1, M3 and M4 tiotropium bound structures with the M2 receptor, which was crystallized with the structurally similar inverse agonist, QNB, also reveal considerable differences around residues D3.32, Y7.39 and Y7.43. These three residues surround the amine group, which is slightly more bulky for QNB than tiotropium (Fig. 1e-g). Indeed, previous mutagenesis studies28 on the M1 receptor revealed ligand specific changes in binding affinities of NMS and QNB upon mutation of Y7.39 and Y7.43 to alanine. For the ligand NMS, which has a structurally similar tropane ring to tiotropium, a 25- and 48-fold loss of binding affinity was observed for the Y7.39 and Y7.43 mutations, respectively, whereas little effect was observed for QNB. This suggests a potential role for these two residues in stabilizing different inactive-state conformations with QNB potentially making compensatory interactions unavailable to NMS. The fact that the orthosteric site of the M4 receptor is in some ways closer to the M1 than the M2 subtypes may also allow some rationalization of the relative subtype selectivity for canonical orthosteric antagonists such as pirenzepine, which has long been known to have a rank order potency of M1>M4>M3>M229. We performed induced fit docking (IFD) experiments of the antagonist into the inactive-state structures of the M1–M4 receptors. The overall poses for pirenzepine were very similar, with slight variability in the positioning of the methylpiperazine moiety (Extended Data Fig. 4a). However, there were still distinct differences in the orientation of residues D3.32 and Y7.39 between the M1, M3 and M4 subtypes versus the M2 receptor, with D3.32 oriented towards and Y7.39 away from the methylpiperazine group in the M2 IFD (Extended Data Fig. 4b). These differences should be interpreted with caution, as it is possible they reflect a restricted sampling in the IFD protocol, and may not be reflective of a genuine M2 specific preference. Nevertheless, these results suggest that the differences in positions of D3.32 and Y7.39, which surround the methylpiperazine group, could contribute to the marked difference in potency for pirenzepine between the M1 and M2 subtypes29.
Allosteric binding and cooperativity
A comparison of all four solved muscarinic receptor structures illustrates the strikingly high degree of conservation of the residues comprising the orthosteric site (Fig. 2, green), thus providing a structural basis for the difficulty in achieving subtype selectivity when targeting this region. In contrast, muscarinic receptors possess a large extracellular vestibule that contains residues contributing to an allosteric site. As shown in Fig. 2 (blue), comparison of these residues reveals a striking divergence between subtypes, due to differences in amino acid composition (Extended Data Fig. 2) and likely additional tertiary structure changes that arise as a consequence of the dynamic nature of the extracellular loop regions. Also shown in Fig. 2 (yellow) are residues that have been previously suggested to form the “roof” of the orthosteric site and “floor” of the allosteric site20,30. These “shared” residues show an intermediate degree of tertiary structure divergence between subtypes when compared to the orthosteric and allosteric site residues, and are conserved among all five subtypes with the exception of the M2 receptor where L in ECL2 is replaced by F.
Figure 2. Comparison of orthosteric and allosteric binding site residues across the M1–M4 receptors.

a,b The M1 – M4 receptors are aligned to the M3 muscarinic receptor (PDB: 4U15, chain A) and are shown as grey coloured cartoons with views from the (a) membrane and (b) extracellular side. Residues in ECL2 are numbered relative to the position of the disulphide-bonded cysteine. Carbon atoms are coloured by site with the orthosteric residues in green, dark blue for allosteric conserved residues, light blue for allosteric nonconserved residues, and yellow for residues that contribute to both sites. Oxygen atoms are coloured red, nitrogen blue, and sulphur yellow. Non-conserved residues are labelled according to either the most common residue or by the residue at the M4 receptor. Residues K6.62 (M1), D6.63 (M1) and S6.63 (M3) are shown as alanine due to a lack of electron density on the side chains.
Comparison of the electrostatic surface potential of each receptor (Fig. 3) also reveals distinct differences in both the shape and charge distribution of the allosteric site and can explain why some of the best-studied muscarinic receptor allosteric modulators are cationic compounds31. For example gallamine32, a prototypical negative allosteric modulator of muscarinic receptors, has a binding potency order of M2 > M1,M4 > M3,M533. The acidic EDGE sequence (Fig. 3b) of the M2 receptor has been shown to be important for gallamine affinity and cooperativity, and indeed, replacement of M1 residues LAGQ with the EDGE (Fig. 3b) significantly improved gallamine affinity at the M1 receptor33.
Figure 3. Electrostatic and surface properties of the different muscarinic receptor structures.

a, Electrostatic potentials (+ 5 kT/e in blue and − 5 kT/e in red) mapped on the surfaces of the M1 – M4 receptor structures calculated at pH 7.0 using the programs PDB2PQR43,44 and APBS45. b, Residues in ECL2 that make up the EDGE sequence at the M2 receptor and the corresponding regions at the other subtypes are shown as sticks. Negatively charged residues in the sequence alignment are coloured red.
Interestingly, inspection of our M4 receptor data also revealed that the precipitant, polyethylene glycol 300 (PEG 300), is able to occupy the allosteric binding site of the inactive-state receptor (Extended Data Fig. 5), a finding consistent with the recent structure of the M3-mT4L receptor26. Surrounding the PEG 300 molecule are residues that form the allosteric site from the top regions of TM2, TM3 and TMs 5–7 (Extended Data Fig. 5b). Furthermore, PEG 300 sits immediately above the aromatic cage composed of Y1133.33, Y4166.51, Y4397.39 and Y4437.43 (Extended Data Fig. 5a). These residues have been implicated in regulating the dissociation of antagonists from the orthosteric binding site34, and we confirmed the ability of PEG 300 to act as an allosteric modulator in its own right through its ability to retard the dissociation of [3H]NMS in a concentration-dependent manner with a calculated apparent affinity of approximately 10 mM for the [3H]NMS-occupied M4 receptor (Extended Data Fig. 5c,d).
Our finding above illustrates an inherent difficulty in obtaining inactive-state structures with prototypical negative allosteric modulators bound in the open muscarinic extracellular vestibule, as PEG 300 is a required precipitant and is present at concentrations of over 1.0 M. However, a recent breakthrough was the solution of the active-state structure of the related M2 muscarinic receptor bound to a high efficacy agonist, iperoxo, in the absence or presence of the PAM, LY2119620, which preferentially bound in a more tightly closed vestibule that arises in the active-state35. Because the M4 receptor is most closely related to the M2 subtype, and M4 receptor PAMs are highly pursued as novel therapeutic agents4,36, we undertook a combined mutagenesis and molecular modelling study to complement our structural work and gain additional insights into mechanisms governing positive allosteric modulation at this muscarinic receptor subtype.
We investigated the interaction between the well-characterized PAM, LY203329813-15,20,21, and the cognate agonist, acetylcholine. Based on the recent structure of the active M2 receptor bound to the LY2033298 congener, LY211962035,37,38, it is likely that such PAMs bind to an essentially pre-formed closed state of the extracellular vestibule. As such, residues whose mutation might alter the cooperativity between acetylcholine and LY2033298 fall into three general categories: (i) those that make tighter contacts with the ligands in the closed state than the open state, (ii) those that are immobilized by the binding of either ligand, such that the entropic cost is paid by the first binding event, (iii) non ligand-contact residues that alter the free energy of activation of the receptor and thus the open to closed transition. We chose to focus on residues within and between the extracellular vestibule and orthosteric sites, which are likely to reflect the first two categories; mutagenesis of non-contact residues that govern the free energy of receptor transitions are beyond the scope of the current work.
Because prior mutagenesis studies suggested a role for aromatic residues in receptor interaction with LY2033298, we generated alanine mutations of selected aromatic residues near the top of the receptor and applied an allosteric ternary complex model to the data (Methods) to determine the effect of each mutation on the affinity of acetylcholine (KA) or LY2033298 (KB) for the free receptor and the magnitude of positive cooperativity (α) between the two ligands. We also chose to investigate selected (non-aromatic) residues that line the proximal and distal ends of ECL2, given the important role this region plays in the binding of modulators to the extracellular vestibule18,39-41. The results of these experiments are summarized in Supplementary Tables 2-4 and include prior mutagenesis results from our laboratory for the same set of ligands. To rationalize our findings, we used the recent active state M2 receptor structure as a template to generate a homology model of the M4 receptor bound to acetylcholine and LY2033298, and compared this to our inactive state crystal structure (Fig. 4, Extended Data Fig. 6).
Figure 4. Model of an active M4 receptor bound to acetylcholine and LY2033298.
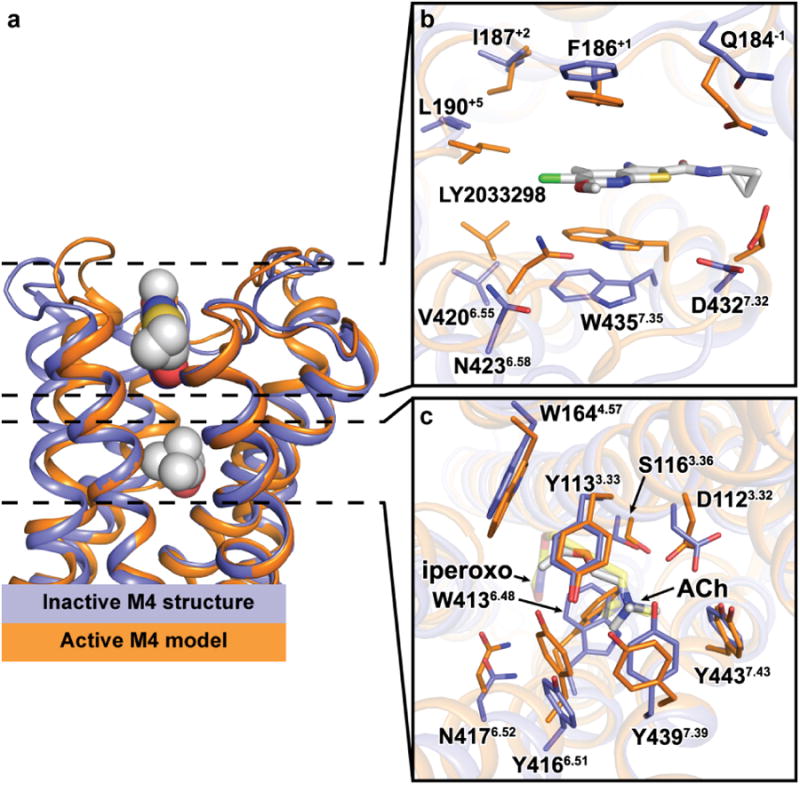
a, Comparison of the M4•tiotropium receptor structure (blue) versus an active-state model (orange) bound to acetylcholine and LY2033298 based on the active M2•iperoxo•LY2119620 structure (PDB: 4MQT) as viewed from the membrane. The active M4 model was aligned to the M4•tiotropium structure (chain A, excluding T4L) with a root mean squared deviation of 0.9 Å. b,c Cross-sectional views of the (b) allosteric site and (c) orthosteric site as viewed from the extracellular side with a 90° rotation relative to the membrane from (a). Residues surrounding each site are shown as sticks (several removed for clarity). Acetylcholine and LY2033298 are shown as (a) spheres or (b,c) sticks and coloured according to element: carbon, cyan; oxygen, red; nitrogen, blue; sulphur, yellow; chlorine, green. Acetylcholine is in the trans conformation and aligns in a similar pose to iperoxo (c, transparent yellow sticks).
The most dramatic effect on the affinity of the PAM was noted upon mutation of W4357.35 at the top of TM7, with a complete loss in LY2033298 binding, similar to our previous observations21 upon alanine substitution of F186ECL2 (Fig. 5, Extended Data Fig. 7, and Supplementary Tables 3-4). Alanine mutations of residues Y1133.33, Y4166.51 and Y4397.39, which form the roof of the orthosteric site led to significant decreases in cooperativity. A slight increase in modulator affinity and significant decrease in cooperativity was also noted with mutation of Y892.61, together with our prior identification of residues W1083.28 and L1093.29 as likely contributors to the PAM binding pocket20. Comparison of our inactive state structure to the active state model now provides a mechanistic rationale for our findings, specifically a contraction of the extracellular vestibule that results predominantly in an inward movement of N4236.58, F186ECL2 and W4357.35 allowing π-stacking interactions to occur with the modulator in the active state (Fig. 4b). With regards to the acetylcholine-binding pocket, there is a contraction of the pocket mediated by an inward movement of the top of TM6 to accommodate the large difference in size between acetylcholine and tiotropium resulting in significant movement of residues Y4166.51, N4176.52, W4136.48 and Y4397.39 (Fig. 4c). Additionally, D1123.32 is reoriented to interact with the choline head-group of acetylcholine, and is no longer stabilized by the same hydrogen bond network that is seen in the inactive state (Fig. 1g).
Figure 5. A cooperativity network at the M4 receptor.
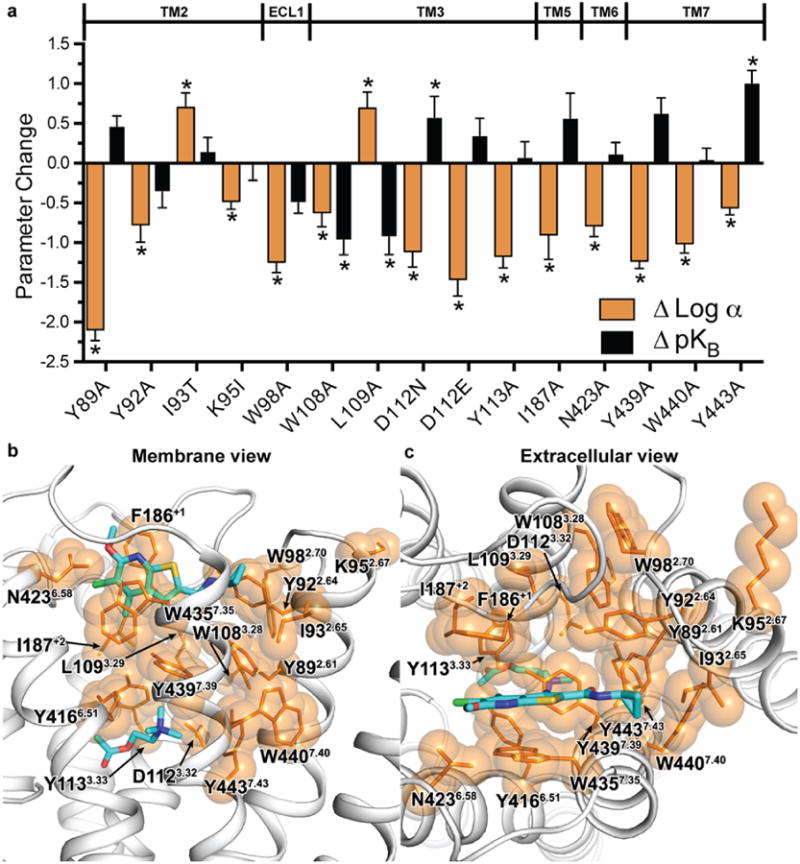
a, Changes in either LY2033298 binding affinity (ΔpKB, coloured black) or cooperativity (ΔLog α, coloured orange) relative to wild-type M4 are shown for each mutation. Mutations that differ significantly from wild type are indicated by asterisks. Cooperativity and binding values for F186+1 and W4357.35 were not determined due to a lack of LY2033298 binding (see Supplementary Tables 2-4). b,c Residues from (a) were mapped onto the M4 active-state model and coloured as orange sticks with translucent spheres with views from (b) the membrane and (c) the extracellular side. LY2033298 and acetylcholine are shown as sticks and coloured the same as in Figure 4.
Importantly, mapping of the amino acid residues that significantly affect the cooperativity between acetylcholine and LY2033298 upon mutation also identified, for the first time, a network that appears to link the allosteric and orthosteric sites, involving the interface between TMs 2, 3, 6 and 7, and extending along the top of ECL2 (Fig. 5; orange coloured residues); this network is consistent with views of allosteric modulation that propose a preferred energetic link between orthosteric and allosteric sites42 but, to our knowledge, has never been directly mapped before in a GPCR. Interestingly, a comparison of the side chain locations between the inactive M4 structure and active M4 model for residues in the allosteric network reveals that the majority of residues at the TM2/3/7 interface that contribute to cooperativity are not predicted to undergo appreciable movement between states, whereas comparison of residues further away from the interface (F186ECL2, Y4166.51, N4236.58, and W4357.35) are predicted to move significantly between the two states (Extended Data Fig. 8). The TM2/3/7 interface, which forms part of the hydrophobic core of the receptor, may act as a hinge mediating conformational rearrangements in the extracellular vestibule between the inactive (open extracellular vestibule) and active (closed extracellular vestibule) states of the receptor. Disruption of this hinge by mutagenesis alters the packing interactions within the interface and might change the energetic barrier between the open and closed conformations of the receptor leading to either an increase or decrease in PAM cooperativity. Thus, binding of a PAM to the allosteric site might stabilize the conformation of the allosteric network residues that are otherwise found in a more dynamic state. Presumably, structures of the inactive state and active M4 model described here represent the lowest energy conformations, as they were obtained using crystallography, or are based on the x-ray structures of the active M2 receptor35 (Extended Data Fig. 8).
Another noteworthy feature of LY2033298 is that it is selective towards the M4 receptor versus the M1 receptor when tested against acetylcholine15. This difference in selectivity could arise either through differential binding affinities of LY2033298 or through a difference in the cooperativity between LY2033298 and acetylcholine between the two subtypes (Extended Data Fig. 9).
Conclusions
Muscarinic receptors remain important drug targets, and designing molecules to selectively target the orthosteric binding site has proved challenging, as highlighted by the lack of prominent differences between the receptor subtypes. Alongside the previously determined M2 and M3 structures, the M1 and M4 structures presented here now offer a near complete view of the inactive state of this important subfamily of GPCRs. Excitingly, comparison of these structures clearly reveals a divergence in residues lining the allosteric site, highlighting the importance of this region for designing selective drugs. Moreover, our enriched structure-function analysis of the M4 receptor indicates that it is possible to combine crystal structure and mutagenesis data to uncover new insights into GPCR allosteric modulation, and our results point to the TM2/3/7 interface as a network for further studies on the mechanistic basis of allostery at Class A GPCRs. Together with the recent solution of the inactive M2 and M3 receptors, as well as the active and PAM-bound M2 receptor, our study has contributed to an emerging picture of mechanisms of allostery at a therapeutically important receptor family that may facilitate the design of novel agents targeting a variety of CNS disorders while avoiding peripheral off-target effects.
Methods
M1 and M4 receptor expression and purification
The human M4 muscarinic receptor gene (cdna.org) was cloned into a modified pFastBac1 vector to give a receptor containing an amino-terminal FLAG epitope tag and a carboxyl–terminal 8 × histidine tag. Residues 226–389 of ICL3 were removed and replaced by a minimal Cys-free T4 lysozyme fusion protein26. The human M1 muscarinic receptor gene was also cloned into the modified pFastBac1 vector, and residues 219-354 of ICL3 were removed and replaced by a Cys-free T4 lysozyme fusion protein. Both fusion proteins were expressed using the Bac-to-Bac Baculovirus Expression System (Invitrogen) in Sf9 cells. Cells were infected at a density of 4.0–5.0 × 10⁶ cells mL-1, treated with 10 μM atropine, and harvested at 60 hours. Receptor was solubilized and purified in the presence of tiotropium as previously described for the M322 receptor using Ni-NTA chromatography, FLAG affinity chromatography, and size exclusion chromatography. The N-terminus of the M4 receptor was removed by cleavage with HRV 3C protease at a concentration of 2% (w/w) during concentration of the receptor prior to size exclusion chromatography (∼2hr at 4 °C). Post size exclusion chromatography, purified receptor was concentrated to 85 AU (∼50 mg mL-1) and flash frozen in small aliquots using liquid nitrogen.
Pharmacology of crystallization constructs
Sf9 cells expressing wild type M4 or M4-mT4L receptor, as described above, were pelleted and washed with PBS three times for 1 h each to remove any bound atropine. Cells were resuspended in binding buffer (10 mM HEPES pH 7.5, 100 mM NaCl, and 10 mM MgCl2) and flash frozen with liquid nitrogen. Saturation binding assays were carried out using approximately 20,000 cells per well with 9 different concentrations of [3H]NMS in a total volume of 0.5 mL for 3 h at 37 °C. Competition binding assays with acetylcholine and tiotropium were carried out in the presence of a fixed concentration of [3H]NMS over 10 different concentrations of ligand for 3 h at 37 °C. Non-specific binding was measured in the presence of 10 μM atropine, and reactions were harvested by rapid filtration through GF/B filters. Data were analysed using Prism 6.0d. Similar methods were applied for binding assays using wild type M1 and M1-T4L, except that [3H]QNB was used as the radioligand.
Crystallization
Purified M1-T4L•tiotropium and M4-mT4L•tiotropium were crystallized using lipid cubic phase technology. Each receptor was reconstituted by mixing the protein solution into 10:1 (w/w) monoolein:cholesterol (Sigma) in 1:1.5 parts w/w protein:lipid ratio using the two-syringe method24. For the M1 receptor, samples of 50 nL (20–40 nL for M4) were spotted onto 96-well glass plates and overlaid with 800 nL (600 nL for M4) of precipitant solution for each well using a Gryphon LCP (Art Robbins Instruments). Glass plates were then sealed using a glass cover film and incubated at 20 °C. Initial crystals for the M1 receptor formed after 24 hours in conditions containing 33% PEG 300, 100 mM sodium acetate, and 100 mM Bis-Tris Propane (pH 8.0). For the M4 receptor, initial crystals formed after 24 hours in conditions containing 25–40% PEG 300, 50–100 mM EDTA (pH 8.0), and 100 mM MES (pH 5.5–6.5). M1 and M4 crystals were harvested using mesh grid loops (MiTeGen) and stored in liquid nitrogen before use.
Data collection, processing, and structure determination
X-ray diffraction data were collected at the Advanced Photon Source at Argonne National Laboratories at GM/CA beamline 23ID-D. Crystals were located by initial rastering using an 80 μm by 30 μm beam with five-fold attenuation and 1 s exposure. Regions that contained strong diffraction were then sub-rastered using a 10 μm collimated beam with five-fold attenuation. Data were then collected with the 10 μm beam using no attenuation with 1–2 second exposures and 1 degree oscillations. To prevent radiation damage, data were collected in wedges of 3–10 degrees before moving onto either a different site on the same crystal or a new crystal. Diffraction data were processed using HKL2000 (M1 receptor) or XDS46 (M4 receptor) and statistics are summarized in Extended Data Table 1. Both structures were solved by molecular replacement using Phaser47. For the M1 receptor, the inactive M3 structure22 (PDB: 4DAJ) was split into its receptor and T4L components and used as corresponding search models. The refinement was carried out using Refmac548 with manual building in coot49. For the M4 receptor, the inactive M2 structure23 (PDB: 3UON) and the inactive M3-mT4L26 (PDB: 4U15) were used as search models for the receptor and mT4L fusion domains, respectively. The resulting model was completed by iterative refinement in Phenix50 and manual building with Coot49. MolProbity51 was used for structure validation, and figures were prepared using PyMol52. Final refinement statistics are reported in Extended Data Table 1.
Induced fit docking of pirenzepine
The inactive state structures of M1, M2, M3 (PDB 4U15, chain B) and M4 (chain A) receptors were processed by the protein preparation wizard of the Schrodinger 2014-2 suite53, after deleting the lysozyme insertion region. Missing sidechains were added by Prime and hydrogens refined by minimization with the OPLS2.1 force field. Binding grids were defined using the default settings in Glide, centering the grid on the crystallized orthosteric ligand in each case. The PEG ligand in the extracellular vestibule of M3 and M4 receptors was deleted before grid generation. The ligand, pirenzepine, was treated with ligprep software to generate initial protonated 3D structures. Compound structures were docked using the induced fit docking protocol with default settings, which involves the use of the OPLS_2005 force field to refine residues around poses docked by Glide SP, followed by redocking into the generated receptor conformations, also with Glide SP. The poses with the lowest induced fit score were selected. This scoring function takes into account an estimate of the protein conformational penalty along with a protein-ligand interaction docking score.
Molecular modelling of active M4 receptor
A homology model of a human active-state M4 receptor was constructed using the Prime program implemented in Maestro version 2014.1 from Schrodinger. The crystal structure of the M2 receptor with an orthosteric and allosteric agonist bound (PDB: 4MQT) was used as a template to build the M4 model. The M2-M4 sequence alignment generated by Prime needed no adjustment due to the overall significant sequence homology between the two isoforms. The initial M4 receptor model was built with the allosteric ligand (LY2119620) present in the M2 crystal structure bound in the M4 allosteric site and with iperoxo bound in the orthosteric site (as also present in the M2 structure). The binding mode of LY2119620 in M4 was used as a guide to manually dock LY2033298 into the M4 allosteric binding site. In addition, iperoxo from the M4 model was manually modified into acetylcholine (ACh). The M4-ACh-LY2033298 complex was then subjected to 500 steps of energy minimization (MacroModel implemented in Maestro 2014.1 from Schrodinger53) in order to optimize key interactions in the binding sites. The resulting model of ACh and LY2033298 bound to M4 was used in subsequent modelling studies described in this paper.
Molecular modelling of active M1 receptor
The active state of the M1 receptor was modelled based on the active state structure of M2 bound to iperoxo (PDB: 4MQT), using the automated protein structure homology modelling web server Swiss-Model54,55. The nanobody structure was removed and the resulting coordinates were used as a template to model the M1 primary sequence without intracellular loop 3 residues (resi: 213-240). The model was built using Promod-II, minimized by steepest descent energy minimization using a GROMOS96 force field and the quality was assessed by the QMEAN scoring function. ACh and LY2033298 were docked in the M1 homology model using Swiss-Dock56, using steric and chemical considerations such as shape, charge complimentary, and keeping the protein structure constant. The top scoring clusters were evaluated manually based on chemical and steric considerations to pick the favourable pose. Due to static docking, the top four ACh poses did not affect the docking results for LY2033298. For ACh, the selected pose is in the trans conformation similar to the M4•ACh•LY2033298 model. Finally, the structures with the ligand were energy minimized using Chimera with standard Steepest Descent and Conjugate Gradient steps.
Receptor mutagenesis and generation of cell lines
DNA encoding the human M4 mAChR with a triple HA20 or cmyc21 tag at its amino terminus was subjected to QuikChange site-directed mutagenesis (Stratagene, La Jolla, CA) to generate M4 mAChR sequences with the desired amino acid substitutions. DNA constructs in pEF5/frt/V5 (Invitrogen) were stably expressed in FlpIn™ CHO cells, which were maintained in high-glucose Dulbecco's modified Eagle's medium containing 10% FBS, 16mM HEPES, and 400 μg/ml hygromycin B.
Radioligand binding assays
Cell membranes were prepared as described previously14,57. [3H]QNB affinity (KA) at the M4 WT receptor and mutants was determined by saturation binding assays, performed by incubating varying concentrations of [3H]QNB with 10–100 μg of membranes at 37 °C for 1 h, in a final volume of 0.5-1 ml binding buffer (20 mM HEPES, 100 mM NaCl, and 10mM MgCl2 at pH 7.4).
Radioligand inhibition binding assays were performed by co-incubating 10–100 μg of membranes with a KA concentration of [3H]QNB (determined in saturation assays, Supplementary Table 2) and varying concentrations of the non-radiolabeled test compound in 0.5–1 ml binding buffer in the presence of the guanine nucleotide, GppNHp (100 μM), which was used to promote receptor-G protein uncoupling. These experiments determined the concentration of ACh that inhibited 20% [3H]QNB binding, defined as the IC20 concentration of ACh, which was used in subsequent interaction studies between [3H]QNB, ACh, and LY2033298. These experiments were performed by co-incubating 10–100 μg of membranes, an IC20 concentration of ACh, and a KA concentration of [3H]QNB with increasing concentrations of LY2033298 in binding buffer containing GppNHp (100 μM). The reaction was left to reach equilibrium for 3 h at 37 °C. For all experiments, nonspecific binding was defined in the presence of 10 μM atropine, total binding was determined in the absence of the test ligand, and vehicle effects were determined with 0.1% DMSO. The assays were terminated by vacuum filtration through GF-B glass fibre filters, which were washed three times with ice-cold 0.9% NaCl. [3H]QNB radioactivity was measured using a Packard 1600 TR liquid scintillation beta counter. Due to a lack [3H]QNB binding, affinity data for W164A4.57 were determined from functional pERK1/2 experiments performed as previously described20,21.
Data Analysis
Data were analysed using Prism (GraphPad, San Diego, CA). For radioligand saturation binding, nonspecific and total binding data were analysed as described previously58. Inhibition binding curves between [3H]QNB and ACh were fitted to a one-site binding model58. Interaction experiments between [3H]QNB, ACh and LY2033298 were fitted to the following allosteric ternary complex model20,21,59:
where Y is the specific radioligand binding, Bmax is the total number of receptors, [A], [B], and [I] are the concentrations of radioligand, allosteric modulator, and unlabeled orthosteric ligand, respectively, KA, KB, and KI are the equilibrium dissociation constants of the radioligand, allosteric modulator, and unlabelled orthosteric ligand, respectively, and α′ and α are the cooperativity factors between allosteric modulator and the radioligand or unlabeled orthosteric ligand, respectively. The value of α′ was taken as 1 when the binding of [3H]QNB changed by less than 10% at 10-5 M LY2033298 relative to zero LY2033298, and was fixed as such for all analyses. Otherwise, the value of α′ was determined using a global fit to the allosteric ternary complex model. Statistical differences between pharmacological parameters at WT versus mutant M4 receptors were determined by oneway ANOVA with Dunnett's post hoc test, where p<0.01 was considered statistically significant.
Extended Data
Extended Data Figure 1. Crystallization construct design, purification and crystallization.

a-b, Crystallization constructs used for the (a) M1 receptor and (b) M4 receptor. All constructs contain an N-terminal FLAG epitope (coloured yellow), C-terminal histidine tag (coloured purple), and a T4L lysozyme fusion protein (coloured red). For the M4 receptor, initial constructs diffracted out to 4 Å, however, the diffraction data appeared to suffer from a lattice translocation disorder and were unsolvable. The final crystallization construct contained a shortened N-terminus with a HRV 3C cleavage site shown in dark green and a minimal T4 lysozyme fusion (mT4L)26, shown in red. c, Snake-plot diagram of the best diffracting M4 mAChR construct coloured according to (a). Residues coloured blue are single point mutations from this study, and residues coloured orange are previously studied mutations20,21. d, Size exclusion chromatography trace of purified monodispersed M4-mT4L bound to tiotropium. e, Crystals of M4-mT4L obtained in lipidic cubic phase and observed under circularly polarized light.
Extended Data Figure 2. Sequence conservation across the muscarinic receptor subfamily.

a-c, The sequence alignment of the human M1 – M5 receptors (d) was determined on the ConSurf server to calculate amino acid conservation scores60,61. Conservation scores for each residue were mapped62,63 onto the M4 structure and coloured as a gradient from blue (highly conserved) to red (least conserved) with views from the (b) extracellular and (c) intracellular sides. The radius of the cartoon increases as the residues at each position become more poorly conserved. Tiotropium and PEG 300 from the M4 structure are shown as spheres and coloured with carbon in white, oxygen in red, nitrogen in blue, and sulphur in yellow. d, Amino acid sequences of the human M1–M5 receptors were aligned using the ClustalW2 server64. Alpha helical regions are shown as blue boxes as determined by the consensus of the M1–M4 structures. The most conserved residue in each TM (X.50) is in bold lettering. Regions of the N-terminus, C-terminus and ICL3 regions are removed for space and clarity. Insertion points of the T4 lysozyme fusion proteins between TM5 and TM6 are underlined with bold lettering. Residues from the orthosteric binding-site are highlighted in red and allosteric binding-site residues in blue. Residues that contribute to both sites are coloured in yellow.
Extended Data Figure 3. Distinct structural features for the M1 and M4 receptors.

The receptors shown are aligned and coloured as in Figure 1. a,b, The M1 receptor was crystallized with the FLAG peptide (DYKDDDD; coloured cyan sticks) co-bound on the cytoplasmic surface. Residues of the M1 receptor within 4 Å of the FLAG peptide are shown as magenta coloured sticks with views from the (a) membrane and (b) cytoplasmic side. c, The linkage between TM7 and helix 8 of the M1 receptor undergoes a bend starting with a change in rotamer of residue Y7.53, which may be a result of perturbations in TM6 due to the FLAG peptide. d, The M1-N110Q3.37 mutation causes a slight bulge in TM4 due to the loss of a hydrogen bond with S4.53. e, Chain B of the M4 receptor has an intact ionic lock with R3.50 forming hydrogen bonds with T6.34 and E6.30.
Extended Data Figure 4. Induced fit docking of pirenzepine into the M1–M4 structures.

The receptors shown are aligned and coloured as in Figure 1. a, Superposition of the poses of pirenzepine from the IFD experiments. b, Comparison of the pirenzepine poses for the M1 and M4 receptor with residues that contribute to the orthosteric site of the M1–M4 receptors (several residues omitted for clarity).
Extended Data Figure 5. PEG 300 occupies the allosteric binding site of the inactive M4 receptor.

a, The cross section of the solvent accessible surface area of the M4 receptor is coloured blue. Tiotropium and PEG 300 are shown as spheres with respective carbons coloured white and peach. The aromatic cage of covering tiotropium is highlighted in orange b, View from the extracellular side with residues that contact PEG 300 shown as spheres. c, Dissociation kinetics of [3H]NMS in the presence of PEG 300. [3H]NMS was incubated with M4-mT4L membranes at 37 °C for 3 h, followed by addition of 10 μM atropine ± PEG 300 at the indicated concentrations and time points. Representative data from three experiments, performed in duplicate, fit to a one phase exponential decay are shown. d, PEG 300 has an apparent binding affinity for the NMS-occupied receptor of approximately 10 mM (LogIC50 = -1.95±0.02).
Extended Data Figure 6. Ligand interaction diagrams for the M4 receptor.

a,b The molecular interactions between the (a) orthosteric and (b) allosteric binding sites are shown by the program MOE65 for the inactive (M4•tiotropium structure) and active states (M4• acetylcholine •LY2033298 model). Residues with a bold outline were selected in this study or others20,21 as single point mutations.
Extended Data Figure 7. Identification of key residues that govern LY2033298 affinity and binding cooperativity with acetylcholine (ACh) at the M4 receptor.

Competition between a fixed concentration of [3H]QNB and increasing concentrations of ACh (black circles), LY2033298 (blue triangles) or LY2033298 in the presence of an IC20 concentration of ACh (red squares) are shown. The curves drawn through the points represent the best global fit of an extended ternary complex model. For data sets where the binding of [3H]QNB changed by less than 10% at 10-5 M LY2033298 relative to zero LY2033298, the value of α′ was fixed to 1 (connecting line shown). Data points represent the mean ± s.e.m. of at least three experiments performed in triplicate.
Extended Data Figure 8. Comparison of cooperativity network residues between the inactive and active-states.

a,b, Chemical structures of (a) the M4 ligands used in this study and (b) the M2 ligands from the active-state crystal structures (PDB: 4MQT and 4MQS). c-f, Mapping of the allosteric network onto the (c,d) inactive M4 structure (blue residues), M4 active-state model (orange residues) and (e,f) the inactive (yellow residues) and active-state M2 structures (magenta and green residues) with views from the (c,e) membrane or (d,f) extracellular surface. Ligands are coloured according to element: carbon, cyan; oxygen, red; nitrogen, blue; sulphur, yellow; chlorine, green.
Extended Data Figure 9. LY2033298 binding to active-state M1 and M4 models.

Comparison of active-state M1 (green) and M4 (orange) models bound to LY2033298 and acetylcholine, with acetylcholine and LY2033298 shown as sticks and coloured according to element: carbon, white; oxygen, red; nitrogen, blue; sulphur, yellow; chlorine, green. Several residues surrounding LY2033298 are shown as sticks and coloured according to receptor. M4-N4236.58 is predicted to undergo significant movement between the inactive and active states to form a hydrogen bond with the methoxy group of LY2033298. In the M1 receptor this residue is a serine (S3886.58) and is unable to form a similar hydrogen bond. However, mutation of N4236.58 to alanine at the M4 receptor results in no loss of LY2033298 affinity, but does result in a 6-fold loss in cooperativity between acetylcholine and LY2033298 (Supplementary Table 3). This is suggestive of selectivity being derived through cooperativity as a possible mechanism between the M1 and M4 receptors. Additional determinants for M1 and M4 selectivity could also arise through differences in residues on TMs 2 and 7, which contribute to (I932.65) or sit proximal to (D4327.32 and S4367.36) the allosteric network.
Extended Data Table 1. Data collection and refinement statistics.
| Data collection* | M1-T4L•tiotropium | M4-mT4L•tiotropium |
|---|---|---|
| Beamline | GM/CA | GM/CA |
| 23-ID-D | 23–ID-D | |
| Number of crystals | 8 | 64 |
| Space group | P 21 21 21 | P 1 21 1 |
| Cell dimensions | ||
| a, b, c (Å) | 58.0, 72.2, 175.7 | 48.5, 172.0, 60.7 |
| α, β, γ (°) | 90, 90, 90 | 90, 94.4, 90 |
| Resolution (Å) | 30.00–2.70 (2.80–2.70) | 28.99–2.60 (2.69–2.60) |
| Rmerge (%) | 15.5 (83.6) | 21.3 (94.7) |
| <I/σ> | 8.7 (1.9) | 8.2 (1.5) |
| CC1/2 (%) | N.D.† | 99.0 (54.5) |
| Completeness | 97.1 (98.2) | 99.7 (97.9) |
| Multiplicity | 4.3 (4.2) | 13.1 (4.9) |
|
| ||
| Refinement | ||
| Resolution (Å) | 30.00–2.70 | 28.53–2.60 |
| No. of reflections working / test set | 19,223 / 1,011 | 30,299 / 2,146 |
| Rwork/Rfree (%) | 22.8 / 27.5 | 22.7 / 24.0 |
| No. of atoms (Chain A / Chain B) | ||
| Protein | 3439 | 3058 / 3115 |
| Ligands | 210 | 176 / 167 |
| Average B-factors (Chain A / Chain B; Å2) | 73.6 | 74.0 / 70.5 |
| Receptor | 62.5 | 63.9 / 64.6 |
| T4 lysozyme | 64.4 | 99.5 / 85.3 |
| Tiotropium | 66.5 | 47.4 / 47.9 |
| Allosteric site PEG 300 | – | 74.9 / 81.6 |
| Waters | 58.1 | 53.7 / 46.7 |
| Other ligands | 74.8 | 80.8 / 78.4 |
| RMS deviation from ideality | ||
| Bond length (Å) | 0.009 | 0.002 |
| Bond angles (°) | 1.39 | 0.61 |
| Ramachandran statistics‡ | ||
| Favored regions (%) | 96.2 | 99.2 |
| Allowed regions (%) | 3.6 | 0.8 |
| Outliers (%) | 0.2 | 0.0 |
Highest shell statistics in parenthesis
N.D., Not determined, because the structure was solved before CC1/2 values were introduced71.
As calculated by Molprobity
Supplementary Material
Acknowledgments
This work was funded by Program Grant APP1055134 of the National Health and Medical Research Council (NHMRC) of Australia (A.C., P.M.S.). Portions of this work were supported by a Lilly Research Award Program grant. W.I.W. and B.K.K. were supported by the Mathers Foundation. A.C. is a Senior Principal, and P.M.S. a Principal, Research Fellow of the NHMRC. GM/CA @ APS has been funded in whole or in part with Federal funds from the National Cancer Institute (Y1-CO-1020) and the National Institute of General Medical Science (Y1-GM-1104). Use of the Advanced Photon Source was supported by the U.S. Department of Energy, Basic Energy Sciences, Office of Science, under contract No. W-31-109-ENG-38.
Footnotes
Author Contributions. D.M.T performed cloning, protein expression, purification, crystallization, data collection, structure refinement, and radioligand binding assays on the M4 receptor. D.F. purified and crystallized the M1 receptor. B.S. performed data collection and structure refinement on the M1 receptor. K.L., V.N. and D.M.T. performed mutagenesis and radioligand binding studies that examined the effects of amino acid substitutions on ligand pharmacology. C.C.F, M.G.B. and D.E. provided the pirenzepine IFD and active-state M4 homology model. P.B. generated the active-state model of the M1 receptor. T.S.K. provided supervision on the M1 muscarinic receptor production and purification. W.I.W. supervised structure refinement. B.K.K., P.M.S., and A.C. provided overall project supervision. D.M.T and A.C. wrote the manuscript.
Author Information. Atomic coordinates and structure factors will be deposited in the Protein Data Bank (http://pdb.rcsb.org) as entries 5CXV and 5DSG for the M1 and M4 receptors, respectively. C.C.F, M.G.B. and D.E. are employees of Eli Lilly. Readers are welcome to comment on the online version of the paper.
References
- 1.Wess J, Eglen RM, Gautam D. Muscarinic acetylcholine receptors: mutant mice provide new insights for drug development. Nature reviews Drug discovery. 2007;6:721–733. doi: 10.1038/nrd2379. [DOI] [PubMed] [Google Scholar]
- 2.Hasselmo ME. The role of acetylcholine in learning and memory. Curr Opin Neurol. 2006;16:710–715. doi: 10.1016/j.conb.2006.09.002. [DOI] [PMC free article] [PubMed] [Google Scholar]
- 3.Hasselmo ME, Giocomo LM. Cholinergic modulation of cortical function. J Mol Neurosci. 2006;30:133–135. doi: 10.1385/JMN:30:1:133. [DOI] [PubMed] [Google Scholar]
- 4.Kruse AC, et al. Muscarinic acetylcholine receptors: novel opportunities for drug development. Nature reviews Drug discovery. 2014;13:549–560. doi: 10.1038/nrd4295. [DOI] [PMC free article] [PubMed] [Google Scholar]
- 5.Kruse AC, Hu J, Kobilka BK, Wess J. Muscarinic acetylcholine receptor X-ray structures: potential implications for drug development. Current opinion in pharmacology. 2014;16:24–30. doi: 10.1016/j.coph.2014.02.006. [DOI] [PMC free article] [PubMed] [Google Scholar]
- 6.Foster DJ, Jones CK, Conn PJ. Emerging approaches for treatment of schizophrenia: modulation of cholinergic signaling. Discovery medicine. 2012;14:413–420. [PMC free article] [PubMed] [Google Scholar]
- 7.Shekhar A, et al. Selective muscarinic receptor agonist xanomeline as a novel treatment approach for schizophrenia. Am J Psych. 2008;165:1033–1039. doi: 10.1176/appi.ajp.2008.06091591. [DOI] [PubMed] [Google Scholar]
- 8.Bodick NC, et al. Effects of xanomeline, a selective muscarinic receptor agonist, on cognitive function and behavioral symptoms in Alzheimer disease. Archives of neurology. 1997;54:465–473. doi: 10.1001/archneur.1997.00550160091022. [DOI] [PubMed] [Google Scholar]
- 9.Heinrich JN, et al. Pharmacological comparison of muscarinic ligands: historical versus more recent muscarinic M1-preferring receptor agonists. Eur J Pharmacol. 2009;605:53–56. doi: 10.1016/j.ejphar.2008.12.044. [DOI] [PubMed] [Google Scholar]
- 10.Conn PJ, Christopoulos A, Lindsley CW. Allosteric modulators of GPCRs: a novel approach for the treatment of CNS disorders. Nat Rev Drug Discov. 2009;8:41–54. doi: 10.1038/nrd2760. [DOI] [PMC free article] [PubMed] [Google Scholar]
- 11.Digby GJ, Shirey JK, Conn PJ. Allosteric activators of muscarinic receptors as novel approaches for treatment of CNS disorders. Mol Biosyst. 2010;6:1345–1354. doi: 10.1039/c002938f. [DOI] [PMC free article] [PubMed] [Google Scholar]
- 12.Keov P, Sexton PM, Christopoulos A. Allosteric modulation of G protein-coupled receptors: a pharmacological perspective. Neuropharmacol. 2011;60:24–35. doi: 10.1016/j.neuropharm.2010.07.010. [DOI] [PubMed] [Google Scholar]
- 13.Suratman S, et al. Impact of species variability and ‘probe-dependence’ on the detection and in vivo validation of allosteric modulation at the M4 muscarinic acetylcholine receptor. British journal of pharmacology. 2011;162:1659–1670. doi: 10.1111/j.1476-5381.2010.01184.x. [DOI] [PMC free article] [PubMed] [Google Scholar]
- 14.Leach K, et al. Molecular mechanisms of action and in vivo validation of an M4 muscarinic acetylcholine receptor allosteric modulator with potential antipsychotic properties. Neuropsychopharmacology : official publication of the American College of Neuropsychopharmacology. 2010;35:855–869. doi: 10.1038/npp.2009.194. [DOI] [PMC free article] [PubMed] [Google Scholar]
- 15.Chan WY, et al. Allosteric modulation of the muscarinic M4 receptor as an approach to treating schizophrenia. Proceedings of the National Academy of Sciences of the United States of America. 2008;105:10978–10983. doi: 10.1073/pnas.0800567105. [DOI] [PMC free article] [PubMed] [Google Scholar]
- 16.Shirey JK, et al. A selective allosteric potentiator of the M1 muscarinic acetylcholine receptor increases activity of medial prefrontal cortical neurons and restores impairments in reversal learning. J Neurosci. 2009;29:14271–14286. doi: 10.1523/JNEUROSCI.3930-09.2009. [DOI] [PMC free article] [PubMed] [Google Scholar]
- 17.Ma L, et al. Selective activation of the M1 muscarinic acetylcholine receptor achieved by allosteric potentiation. Proc Natl Acad Sci U S A. 2009;106:15950–15955. doi: 10.1073/pnas.0900903106. [DOI] [PMC free article] [PubMed] [Google Scholar]
- 18.Abdul-Ridha A, et al. Molecular determinants of allosteric modulation at the M1 muscarinic acetylcholine receptor. J Biol Chem. 2014;289:6067–6079. doi: 10.1074/jbc.M113.539080. [DOI] [PMC free article] [PubMed] [Google Scholar]
- 19.Abdul-Ridha A, et al. Mechanistic insights into allosteric structure-function relationships at the M1 muscarinic acetylcholine receptor. J Biol Chem. 2014;289:33701–33711. doi: 10.1074/jbc.M114.604967. [DOI] [PMC free article] [PubMed] [Google Scholar]
- 20.Leach K, Davey AE, Felder CC, Sexton PM, Christopoulos A. The role of transmembrane domain 3 in the actions of orthosteric, allosteric, and atypical agonists of the M4 muscarinic acetylcholine receptor. Molecular pharmacology. 2011;79:855–865. doi: 10.1124/mol.111.070938. [DOI] [PubMed] [Google Scholar]
- 21.Nawaratne V, Leach K, Felder CC, Sexton PM, Christopoulos A. Structural determinants of allosteric agonism and modulation at the M4 muscarinic acetylcholine receptor: identification of ligand-specific and global activation mechanisms. The Journal of biological chemistry. 2010;285:19012–19021. doi: 10.1074/jbc.M110.125096. [DOI] [PMC free article] [PubMed] [Google Scholar]
- 22.Kruse AC, et al. Structure and dynamics of the M3 muscarinic acetylcholine receptor. Nature. 2012;482:552–556. doi: 10.1038/nature10867. [DOI] [PMC free article] [PubMed] [Google Scholar]
- 23.Haga K, et al. Structure of the human M2 muscarinic acetylcholine receptor bound to an antagonist. Nature. 2012;482:547–551. doi: 10.1038/nature10753. [DOI] [PMC free article] [PubMed] [Google Scholar]
- 24.Caffrey M, Cherezov V. Crystallizing membrane proteins using lipidic mesophases. Nat Protoc. 2009;4:706–731. doi: 10.1038/nprot.2009.31. [DOI] [PMC free article] [PubMed] [Google Scholar]
- 25.Chun E, et al. Fusion partner toolchest for the stabilization and crystallization of G protein-coupled receptors. Structure. 2012;20:967–976. doi: 10.1016/j.str.2012.04.010. [DOI] [PMC free article] [PubMed] [Google Scholar]
- 26.Thorsen TS, Matt R, Weis WI, Kobilka BK. Modified T4 lysozyme fusion proteins facilitate G protein-coupled receptor crystallogenesis. Structure. 22:1657–1664. doi: 10.1016/j.str.2014.08.022. [DOI] [PMC free article] [PubMed] [Google Scholar]
- 27.van Rhee AM, Jacobson KA. Molecular Architecture of G Protein-Coupled Receptors. Drug development research. 1996;37:1–38. doi: 10.1002/(sici)1098-2299(199601)37:1<1∷aid-ddr1>3.0.co;2-s. [DOI] [PMC free article] [PubMed] [Google Scholar]
- 28.Lu ZL, Saldanha JW, Hulme EC. Transmembrane domains 4 and 7 of the M1 muscarinic acetylcholine receptor are critical for ligand binding and the receptor activation switch. J Biol Chem. 2001;276:34098–34104. doi: 10.1074/jbc.M104217200. [DOI] [PubMed] [Google Scholar]
- 29.Caulfield MP, Birdsall NJM. International Union of Pharmacology. XVII. Classification of Muscarinic Acetylcholine Receptors. Pharmacological Reviews. 1998;50:279–290. [PubMed] [Google Scholar]
- 30.Goodwin JA, Hulme EC, Langmead CJ, Tehan BG. Roof and floor of the muscarinic binding pocket: variations in the binding modes of orthosteric ligands. Mol Pharmacol. 2007;72:1484–1496. doi: 10.1124/mol.107.038265. [DOI] [PubMed] [Google Scholar]
- 31.Gregory KJ, Sexton PM, Christopoulos A. Allosteric modulation of muscarinic acetylcholine receptors. Curr Neuropharmacol. 2007;5:157–167. doi: 10.2174/157015907781695946. [DOI] [PMC free article] [PubMed] [Google Scholar]
- 32.Stockton JM, Birdsall NJ, Burgen AS, Hulme EC. Modification of the binding properties of muscarinic receptors by gallamine. Molecular pharmacology. 1983;23:551–557. [PubMed] [Google Scholar]
- 33.Gnagey AL, Seidenberg M, Ellis J. Site-directed mutagenesis reveals two epitopes involved in the subtype selectivity of the allosteric interactions of gallamine at muscarinic acetylcholine receptors. Mol Pharmacol. 1999;56:1245–1253. doi: 10.1124/mol.56.6.1245. [DOI] [PubMed] [Google Scholar]
- 34.Tautermann CS, et al. Molecular basis for the long duration of action and kinetic selectivity of tiotropium for the muscarinic M3 receptor. J Med Chem. 2013;56:8746–8756. doi: 10.1021/jm401219y. [DOI] [PubMed] [Google Scholar]
- 35.Kruse AC, et al. Activation and allosteric modulation of a muscarinic acetylcholine receptor. Nature. 2013;504:101–106. doi: 10.1038/nature12735. [DOI] [PMC free article] [PubMed] [Google Scholar]
- 36.Conn PJ, Jones CK, Lindsley CW. Subtype-selective allosteric modulators of muscarinic receptors for the treatment of CNS disorders. Trends Pharmacol Sci. 2009;30:148–155. doi: 10.1016/j.tips.2008.12.002. [DOI] [PMC free article] [PubMed] [Google Scholar]
- 37.Schober DA, Croy CH, Xiao H, Christopoulos A, Felder CC. Development of a radioligand, [(3)H]LY2119620, to probe the human M(2) and M(4) muscarinic receptor allosteric binding sites. Molecular pharmacology. 2014;86:116–123. doi: 10.1124/mol.114.091785. [DOI] [PubMed] [Google Scholar]
- 38.Croy CH, et al. Characterization of the novel positive allosteric modulator, LY2119620, at the muscarinic M(2) and M(4) receptors. Molecular pharmacology. 2014;86:106–115. doi: 10.1124/mol.114.091751. [DOI] [PubMed] [Google Scholar]
- 39.Khoury E, Clement S, Laporte SA. Allosteric and biased G protein-coupled receptor signaling regulation: potentials for new therapeutics. Front Endocrinol. 2014;5:68. doi: 10.3389/fendo.2014.00068. [DOI] [PMC free article] [PubMed] [Google Scholar]
- 40.Scarselli M, Li B, Kim SK, Wess J. Multiple residues in the second extracellular loop are critical for M3 muscarinic acetylcholine receptor activation. J Biol Chem. 2007;282:7385–7396. doi: 10.1074/jbc.M610394200. [DOI] [PubMed] [Google Scholar]
- 41.Avlani VA, et al. Critical role for the second extracellular loop in the binding of both orthosteric and allosteric G protein-coupled receptor ligands. J Biol Chem. 2007;282:25677–25686. doi: 10.1074/jbc.M702311200. [DOI] [PubMed] [Google Scholar]
- 42.Lockless SW, Ranganathan R. Evolutionarily conserved pathways of energetic connectivity in protein families. Science. 1999;286:295–299. doi: 10.1126/science.286.5438.295. [DOI] [PubMed] [Google Scholar]
- 43.Dolinsky TJ, Nielsen JE, McCammon JA, Baker NA. PDB2PQR: an automated pipeline for the setup of Poisson–Boltzmann electrostatics calculations. Nucleic Acids Res. 2004;32:W665–W667. doi: 10.1093/nar/gkh381. [DOI] [PMC free article] [PubMed] [Google Scholar]
- 44.Dolinsky TJ, et al. PDB2PQR: expanding and upgrading automated preparation of biomolecular structures for molecular simulations. Nucleic Acids Res. 2007;35:W522–W525. doi: 10.1093/nar/gkm276. [DOI] [PMC free article] [PubMed] [Google Scholar]
- 45.Baker NA, Sept D, Joseph S, Holst MJ, McCammon JA. Electrostatics of nanosystems: application to microtubules and the ribosome. Proc Natl Acad Sci U S A. 2001;98:10037–10041. doi: 10.1073/pnas.181342398. [DOI] [PMC free article] [PubMed] [Google Scholar]
- 46.Kabsch W. Xds. Acta crystallographica Section D, Biological crystallography. 2010;66:125–132. doi: 10.1107/S0907444909047337. [DOI] [PMC free article] [PubMed] [Google Scholar]
- 47.McCoy AJ, et al. Phaser crystallographic software. Journal of applied crystallography. 2007;40:658–674. doi: 10.1107/S0021889807021206. [DOI] [PMC free article] [PubMed] [Google Scholar]
- 48.Skubak P, Murshudov GN, Pannu NS. Direct incorporation of experimental phase information in model refinement. Acta Crystallogr Sect D-Biol Crystallogr. 2004;60:2196–2201. doi: 10.1107/S0907444904019079. [DOI] [PubMed] [Google Scholar]
- 49.Emsley P, Lohkamp B, Scott WG, Cowtan K. Features and development of Coot. Acta crystallographica Section D, Biological crystallography. 2010;66:486–501. doi: 10.1107/S0907444910007493. [DOI] [PMC free article] [PubMed] [Google Scholar]
- 50.Adams PD, et al. PHENIX: a comprehensive Python-based system for macromolecular structure solution. Acta crystallographica Section D, Biological crystallography. 2010;66:213–221. doi: 10.1107/S0907444909052925. [DOI] [PMC free article] [PubMed] [Google Scholar]
- 51.Chen VB, et al. MolProbity: all-atom structure validation for macromolecular crystallography. Acta crystallographica Section D, Biological crystallography. 2010;66:12–21. doi: 10.1107/S0907444909042073. [DOI] [PMC free article] [PubMed] [Google Scholar]
- 52.Schrodinger L. The PyMOL Molecular Graphics System, Version 1.7.0.3. 2010 [Google Scholar]
- 53.Schrödinger Release 2014-2: Maestro, version 9.7. 2014 [Google Scholar]
- 54.Guex N, Peitsch MC, Schwede T. Automated comparative protein structure modeling with SWISS-MODEL and Swiss-PdbViewer: a historical perspective. Electrophoresis. 2009;30 Suppl 1:S162–173. doi: 10.1002/elps.200900140. [DOI] [PubMed] [Google Scholar]
- 55.Arnold K, Bordoli L, Kopp J, Schwede T. The SWISS-MODEL workspace: a web-based environment for protein structure homology modelling. Bioinformatics. 2006;22:195–201. doi: 10.1093/bioinformatics/bti770. [DOI] [PubMed] [Google Scholar]
- 56.Grosdidier A, Zoete V, Michielin O. SwissDock, a protein-small molecule docking web service based on EADock DSS. Nucleic Acids Res. 2011;39:W270–277. doi: 10.1093/nar/gkr366. [DOI] [PMC free article] [PubMed] [Google Scholar]
- 57.Nawaratne V, et al. New insights into the function of M4 muscarinic acetylcholine receptors gained using a novel allosteric modulator and a DREADD (designer receptor exclusively activated by a designer drug) Molecular pharmacology. 2008;74:1119–1131. doi: 10.1124/mol.108.049353. [DOI] [PubMed] [Google Scholar]
- 58.Motulsky H, Christopoulos A. Fitting Models to Biological Data Using Linear and Nonlinear Regression: A practical guide to curve fitting. Oxford University Press; 2004. [Google Scholar]
- 59.Ehlert FJ. Estimation of the affinities of allosteric ligands using radioligand binding and pharmacological null methods. Mol Pharmacol. 1988;33:187–194. [PubMed] [Google Scholar]
- 60.Celniker G, et al. ConSurf: using evolutionary data to raise testable hypotheses about protein function. Isr J Chem. 2013;53:199–206. [Google Scholar]
- 61.Ashkenazy H, Erez E, Martz E, Pupko T, Ben-Tal N. ConSurf 2010: calculating evolutionary conservation in sequence and structure of proteins and nucleic acids. Nucleic Acids Res. 2010;38:W529–W533. doi: 10.1093/nar/gkq399. [DOI] [PMC free article] [PubMed] [Google Scholar]
- 62.Landau M, et al. ConSurf 2005: the projection of evolutionary conservation scores of residues on protein structures. Nucleic Acids Res. 2005;33:W299–W302. doi: 10.1093/nar/gki370. [DOI] [PMC free article] [PubMed] [Google Scholar]
- 63.Glaser F, et al. ConSurf: identification of functional regions in proteins by surface-mapping of phylogenetic information. Bioinformatics. 2003;19:163–164. doi: 10.1093/bioinformatics/19.1.163. [DOI] [PubMed] [Google Scholar]
- 64.Larkin MA, et al. Clustal W and Clustal X version 2.0. Bioinformatics. 2007;23:2947–2948. doi: 10.1093/bioinformatics/btm404. [DOI] [PubMed] [Google Scholar]
- 65.Molecular Operating Environment (MOE) Chemical Computing Group Inc.; 2015. [Google Scholar]
- 66.Karplus PA, Diederichs K. Linking Crystallographic Model and Data Quality. Science. 2012;336:1030–1033. doi: 10.1126/science.1218231. [DOI] [PMC free article] [PubMed] [Google Scholar]
Associated Data
This section collects any data citations, data availability statements, or supplementary materials included in this article.