Abstract
The purpose of the present study was to investigate the threshold dose for focal liver damage after stereotactic body radiation therapy (SBRT) in cirrhotic and normal livers using magnetic resonance imaging (MRI). A total of 64 patients who underwent SBRT for liver tumors, including 54 cirrhotic patients with hepatocellular carcinoma (HCC) and 10 non-cirrhotic patients with liver metastases, were analyzed. MRI was performed 3−6 months after SBRT, using gadolinium-ethoxybenzyl-diethylenetriamine pentaacetic acid-enhanced T1-weighted sequences. All MRI datasets were merged with 3D dosimetry data. All dose distributions were corrected to the biologically effective dose using the linear–quadratic model with an assumed α/β ratio of 2 Gy. The development of liver dysfunction was validly correlated with isodose distribution. The median biologically effective dose (BED2) that provoked liver dysfunction was 57.3 (30.0−227.9) and 114.0 (70.4−244.9) Gy in cirrhotic and normal livers, respectively (P = 0.0002). The BED2 associated with a >5% risk of liver dysfunction was 38.5 in cirrhotic livers and 70.4 Gy in normal livers. The threshold BED2 for liver dysfunction was not significantly different between Child−Pugh A and B patients (P = 0.0719). Moreover, the fractionation schedule was not significantly correlated with threshold BED2 for liver dysfunction in the cirrhotic liver (P = 0.1019). In the cirrhotic liver, fractionation regimen and Child−Pugh classification did not significantly influence the threshold BED2 for focal liver damage after SBRT. We suggest that the threshold BED2 for liver dysfunction after SBRT is 40 and 70 Gy in the cirrhotic and normal liver, respectively.
Keywords: radiotherapy, hepatocellular carcinoma, metastatic liver tumor, radiation-induced liver disease, stereotactic body radiation therapy, radiation-associated liver injury
INTRODUCTION
Surgical resection is the standard therapy for liver malignancies, hepatocellular carcinoma (HCC), and liver metastases. Other local therapies, such as radiofrequency ablation, percutaneous ethanol injection therapy, and transarterial chemoembolization, are alternatively used in medically inoperable patients [1]. Stereotactic body radiation therapy (SBRT) has recently attracted increasing attention as a therapeutic modality for various malignancies and has dramatically increased the use of radiation therapy as a curative rather than a palliative modality [1]. Several studies using SBRT for liver tumors have reported high tumor response and local control rates [2, 3]. In addition, it is often possible for patients to receive more than one SBRT session.
Radiation-induced liver disease (RILD) has traditionally been recognized as an almost fatal complication [4–6]. Several dosimetric models that make use of dose–volume histograms have been generated to quantify the probability of RILD in patients who receive 3D conformal radiotherapy [7–9]. However, little is known regarding the hepatic tolerance to SBRT [10–12]. In particular, the relationship between hepatic tolerance to SBRT and liver dysfunction severity in cirrhotic and non-cirrhotic patients is not well understood. Gadolinium-ethoxybenzyl-diethylenetriamine pentaacetic acid (Gd-EOB-DTPA), a magnetic resonance imaging (MRI) liver-specific contrast agent, is widely used to assess the response of liver tumors after SBRT. As intravenously infused Gd-EOB-DTPA is taken up by hepatocytes and excreted into the biliary tract, signal intensity of the liver parenchyma after Gd-EOB-DTPA administration depends on liver function. Therefore, Gd-EOB-DTPA-enhanced MRI is expected to be a useful imaging tool for evaluating liver function. Gd-EOB-DTPA-enhanced MRI can be used for the detection and characterization of hepatic lesions and possibly for the assessment of hepatic function [13–17]. However, relatively limited data exists on the use of Gd-EOB-DTPA-enhanced MRI for the evaluation of focal liver damage after SBRT [11].
In the present study, we used Gd-EOB-DTPA-enhanced MRI to identify the threshold doses for liver parenchymal damage after SBRT in cirrhotic and non-cirrhotic patients with liver tumors.
MATERIALS AND METHODS
Patient selection and clinical characteristics
This study was conducted according to the principles of the Declaration of Helsinki. A total of 64 patients (43 males and 21 females; median age, 73 years; age range, 43−84 years) who were treated with SBRT for liver tumors at Miyakojima IGRT Clinic or Saito Yukoukai Hospital between January 2009 and June 2012 were retrospectively analyzed. Patient data were recorded on standardized forms. Fifty-four and 10 patients were treated with SBRT for HCC and liver metastases, respectively. All patients were considered to be medically unsuitable for other radical therapies and signed an informed consent form prior to radiotherapy. Patient, tumor and treatment characteristics are shown in Table 1 and the Supplementary Data.
Table 1.
Patient characteristics
| HCC | Liver metastasis | P-value | |
|---|---|---|---|
| Number of patients | 54 | 10 | |
| Gender | |||
| male | 36 | 7 | 1.000 |
| female | 18 | 3 | |
| Child–Pugh classification | not applicable | not applicable | |
| A | 46 | ||
| B | 8 | ||
| C | 0 | ||
| Volume of PTV (cm3) | 33.0 (8.7–232.9) | 64.4 (8.5–204.5) | 0.230 |
| Total dose (Gy) | 44.0 (40.0–55.5) | 55.5 (48.0–65.0 | <0.0001 |
| Number of fractions | 5 (4–15) | 5.5 (4–25 | 0.481 |
| 4 | 20 | 3 | |
| 5 | 12 | 2 | |
| 6–9 | 14 | 3 | |
| ≥10 | 8 | 2 | |
| Fraction size (Gy) | 8.5 (3.7–12) | 9.5 (2.6–14) | 0.254 |
| Treatment duration (days) | 5 (4–23) | 7 (4–33) | 0.638 |
| BED10 (Gy) | 80.0 (71.1–105.6) | 105.6 (81.9–134.4) | <0.0001 |
| BED2 (Gy) | 223.1 (158.2–336.0 | 298.5 (149.5–448.0) | 0.0022 |
| Time from RT to MRI (days) | 94 (44–294) | 102 (52–180) | 0.665 |
HCC = hepatocellular carcinoma; PTV = planning target volume; BED = biologically effective dose; RT = radiotherapy; MRI = magnetic resonance imaging.
SBRT technique
Computed tomography (CT) and MRI images for treatment planning were collected using 4-slice BrightSpeed ExcelTM (GE Healthcare, Waukesha, WI, USA) and SIGNA EXCITE HDx 1.5TTM (GE Healthcare), respectively. Planning contrast-enhanced 4D CT scans and Gd-EOB-DTPA-enhanced MRI images were used to determine gross tumor volume. To account for tumor motion, an internal target volume (ITV) was generated by contouring the imaging data. The planning target volume (PTV) was calculated by adding an 8-mm margin in all directions to the ITV.
The prescription radiation doses were documented at the reference point, which is generally the isocenter using 3D conformal radiotherapy and dynamic conformal arc techniques, or were designed to deliver 100% of the prescription dose to 90% of the PTV using intensity-modulated radiation therapy (IMRT). We administered a prescription dose equivalent to BED10 of ∼80 Gy for HCC and 100 Gy for liver metastasis, respectively. Fractioned regimens were scheduled to spare organs at risks (OARs), including the background liver tissue. The analyzed subjects included one patient who received 48 Gy in four fractions equivalent to a BED10 of 105.6 Gy for HCC, and two patients who received a BED10 of 84.5 Gy or 81.9 Gy for metastasis to reduce the biological doses to normal tissues because their tumors existed in the hepatic portal regions.
Radiotherapy was performed using a 6-MV linear accelerator (Novalis [BrainLAB AG, Feldkirchen, Germany] at Miyakojima IGRT Clinic and Trilogy [Varian, Palo Alto, CA] at Saito Yukoukai Hospital). Daily image guidance was performed. Fiducial markers were not implanted in any of the patients.
Imaging analysis
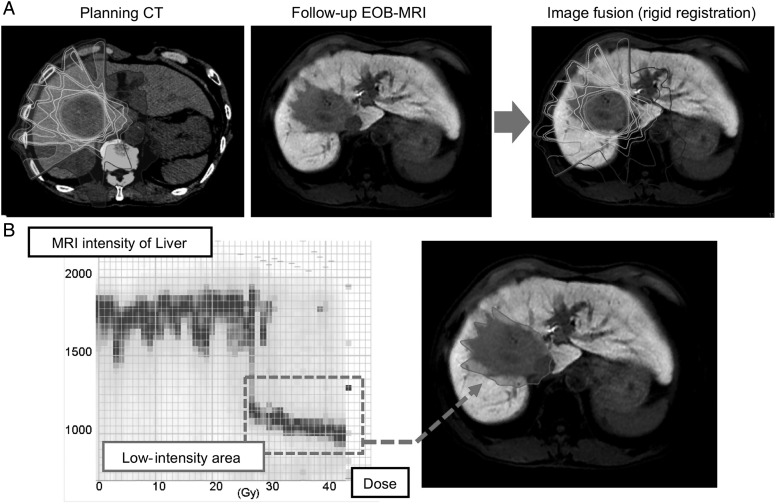
MRI was performed 3−6 months after SBRT. MRI was conducted using Gd-EOB-DTPA-enhanced T1-weighted gradient-echo pulse sequences (liver acquisition with volume acceleration). Gd-EOB-DTPA was injected 20 min before image acquisition. All MRI datasets were merged with 3D dosimetry data using in-house DICOM-RT image fusion software (ShioRISTM 2.0, Osaka, Japan) [18]. The six-dimensional rigid MRI to dose distribution image registration was performed with the mutual information cost function by limiting the registration to the liver as a region of interest (Fig. 1A). A histogram was constructed to assess the threshold dose for liver dysfunction (Fig. 2B). The volume that received each dose was displayed as a contrasting density on the histogram. The intensity of each bar was normalized for each dose to clarify the differences between the peripheral and central areas of the PTV. Finally, the threshold dose for liver dysfunction was identified in each patient.
Fig. 1.
Analysis of dose distribution in the follow-up MRI. (A) The EOB-magnetic resonance image was fused to the planning CT image. (B) For each patient, a histogram was constructed to analyze the correlation between the low-intensity area on the LAVA image and the delivered radiation dose. The x-axis and y-axis indicate the absolute physical dose received by the liver and MRI signal intensity, respectively. The threshold dose was identified in each patient (inset). MRI = magnetic resonance imaging; CT = computed tomography; EOB = adolinium-ethoxybenzyl-diethylenetriamine pentaacetic acid; LAVA = liver acquisition with volume acceleration.
Fig. 2.
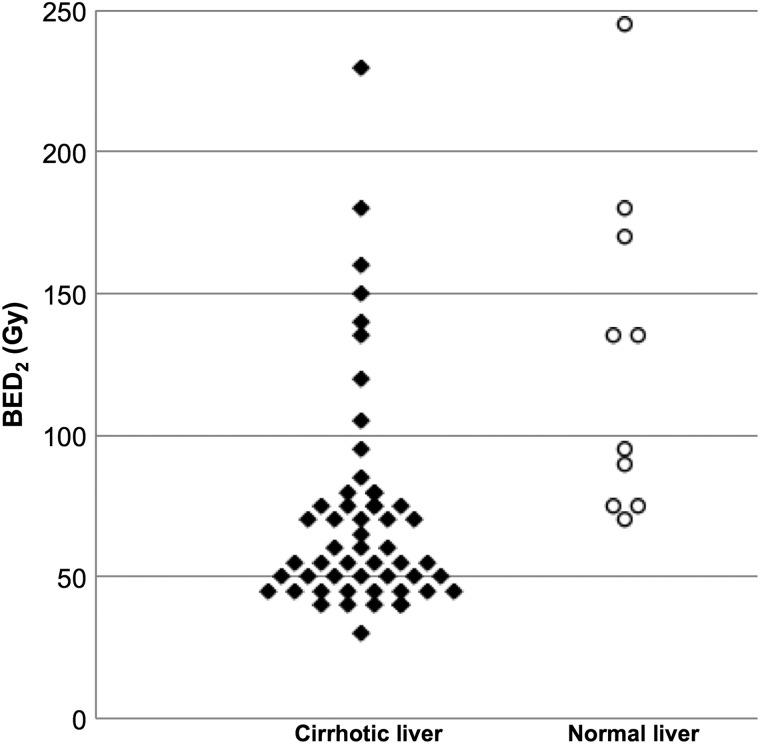
Threshold doses for liver dysfunction in the cirrhotic and normal liver. Threshold BED2 values were plotted and compared between cirrhotic and normal livers. BED = biologically effective dose.
The threshold dose for hepatic dysfunction was determined in each patient by individually assessing the correlation between MRI signal intensity and dose distribution to the liver. Next, to compare the various delivered dose distributions, all dose distributions were corrected to the biologically effective dose using the linear–quadratic (LQ) formulation with an assumed α/β ratio of 2 Gy for both normal and cirrhotic livers. We then determined the correlation of threshold biologically effective dose in BED2 with the Child–Pugh score and the fractionation schedule in patients with liver cirrhosis.
Statistical analysis
The data are expressed as the medians, with the ranges in parentheses, unless otherwise indicated. Mann–Whitney U and Fisher's exact tests were used to compare continuous variables and trends between two groups, respectively. The Kruskal–Wallis test was used for non-parametric comparisons of more than two groups. Pairwise comparisons were performed for significant three-group comparisons. A two-tailed Spearman test was performed to analyze the correlation between the time from SBRT to MRI and the threshold BED2. All statistical analyses were performed using GraphPad Prism version 6.0b (GraphPad Software Inc., San Diego, CA, USA). P values < 0.05 were considered statistically significant.
RESULTS
The radiotherapy prescription dose was 44 (40−55.5) Gy in 5 (4−15) fractions (8.5 [3.7−12] Gy per fraction) for HCC and 55.5 (48−65) Gy in 5.5 (4−25) fractions (9.5 [2.6−14] Gy per fraction) for liver metastases. No significant correlations were found between the treatment duration and the threshold BED2 (P = 0.171).
The minimal BED2 for visually apparent liver damage in patients with liver cirrhosis and normal livers is shown in Fig. 2. The median BED2 that provoked liver dysfunction was 57.3 (30.0−227.9) Gy in cirrhotic livers and 114.0 (70.4−244.9) Gy in normal livers (P = 0.0002). The scatter diagram showed that BED2 values greater than 40 and 70 Gy caused hepatic dysfunction in cirrhotic and normal livers, respectively.
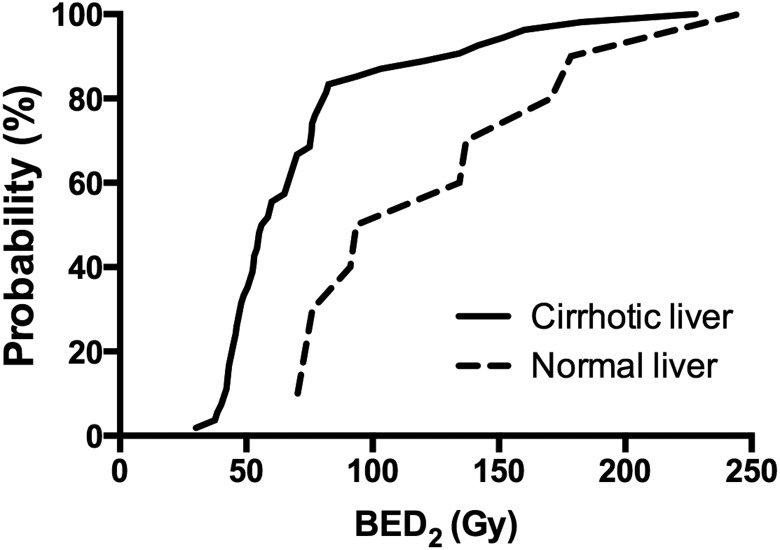
The BED2 associated with a >5% risk (TD5) and 50% risk (TD50) of visually apparent liver dysfunction was 38.5 and 56.0 Gy in cirrhotic livers and 70.4 and 93.5 Gy in normal livers, respectively (Fig. 3).
Fig. 3.
Probability of hepatic dysfunction in the cirrhotic liver. The x-axis and y-axis indicate the minimum BED2 for visually apparent hepatic dysfunction and probability of visually apparent hepatic dysfunction, respectively. The incidence of visually apparent hepatic dysfunction in cirrhotic patients sharply increased when the BED2 was increased from 40 to 80 Gy. BED = biologically effective dose.
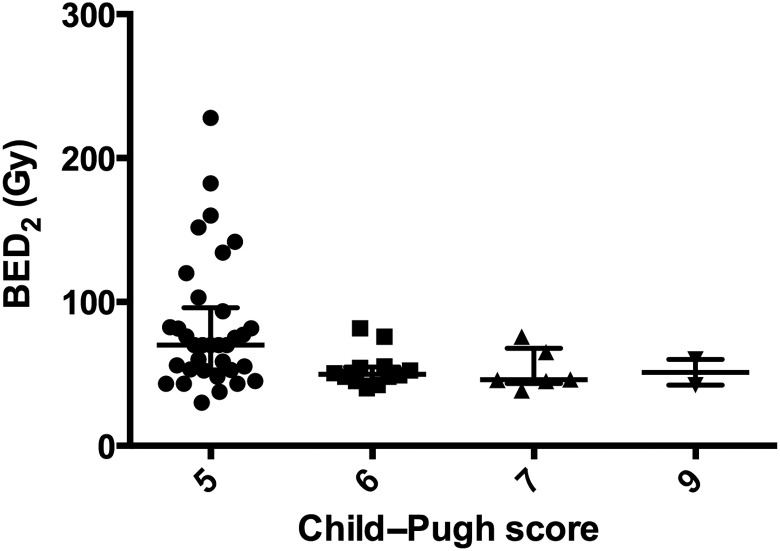
Next, we assessed the correlation between threshold BED2 and Child–Pugh score in patients with liver cirrhosis (Table 2 and Fig. 4). No significant differences existed between the Child–Pugh score and the number of fractions (P = 0.217). A trend was observed among the Child–Pugh scores (P = 0.0350). The median threshold BED2 for liver dysfunction was significantly higher in patients with a Child–Pugh score of 5 than in those with a Child–Pugh score of ≥6 (P = 0.0030; Table 2). In contrast, after excluding patients with a Child–Pugh score of 5, no trends in Child–Pugh scores were observed (P = 0.8699). The Child–Pugh score 5 group showed a tendency toward higher BED2s for liver dysfunction because of the wide individual variance in this value. However, only small differences in the threshold BED2 were observed among the Child–Pugh score groups (Fig. 4). In addition, the BED2 was not higher than 85 Gy in patients with a Child–Pugh score of >5.
Table 2.
Median threshold doses according to Child–Pugh score
| Child–Pugh score | Number of patients | Median threshold dose (BED2 [Gy]) | Number of patients according to the number of fractions received |
||||||||
|---|---|---|---|---|---|---|---|---|---|---|---|
| 4 fr | 5 fr | 6 fr | 7 fr | 8 fr | 9 fr | 10 fr | 12 fr | 15 fr | |||
| 5 | 34 | 70.0 (30.0−227.9) | 16 | 7 | 1 | 0 | 3 | 3 | 4 | 0 | 0 |
| 6 | 12 | 49.7 (40.0−81.6) | 3 | 3 | 0 | 0 | 1 | 3 | 1 | 1 | 0 |
| 7 | 6 | 46.0 (38.5−75.9) | 1 | 1 | 0 | 1 | 1 | 0 | 1 | 0 | 1 |
| 9 | 2 | 51.1 (42.2−60.0) | 0 | 1 | 0 | 0 | 0 | 1 | 0 | 0 | 0 |
BED = biologically effective dose.
Fig. 4.
Correlation between threshold BED2 and Child–Pugh score in patients with liver cirrhosis. Threshold BED2 values were plotted according to Child–Pugh score. Error bars indicate the medians with interquartile ranges. Threshold BED2 values ranged widely in the Child–Pugh score 5 group. BED = biologically effective dose.
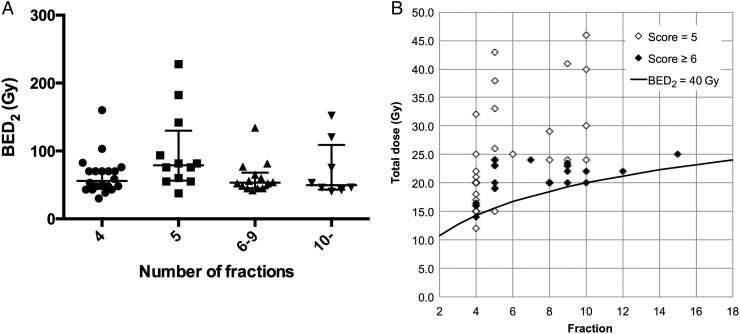
Threshold BED2 according to fractionation regimen is shown in Fig. 5. The number of fractions (5, 6−9 and ≥10) was not significantly correlated with threshold BED2 for liver dysfunction in cirrhotic livers (P = 0.1019; Fig. 5A). Treatment regimen was also not significantly correlated with threshold BED2 for liver dysfunction in cirrhotic livers (Fig. 5B).
Fig. 5.
Threshold BED2 according to fractionation regimen in patients with liver cirrhosis. (A) Threshold BED2 values were plotted according to the number of fractions in cirrhotic patients. Error bars indicate the medians with interquartile ranges. Fractionation regimen was not significantly correlated with hepatic dysfunction (P = 0.1019). (B) Total radiation dose was plotted against the number of fractions in cirrhotic patients with Child–Pugh scores of 5 and ≥ 6. The solid line indicates a BED2 of 40 Gy. BED = biologically effective dose.
DISCUSSION
Compared with conventional techniques, modern radiotherapeutic techniques including SBRT can provide higher radiation doses while sparing OARs. SBRT is sometimes alternatively performed using fractionated regimens [2, 3, 10–12]. Dosimetric parameters, such as fraction volume of normal liver, have been commonly used to predict RILD in patients receiving conventional fractionated radiotherapy at doses >30 Gy [7–9]. No established therapies for classic RILD exist, and RILD is a life-threatening complication of radiotherapy. To prevent RILD-related mortality, we first evaluate the mean doses for the whole liver, and then analyze the potential loss of hepatic function in our current clinical practice [7–9]. Only a few studies have investigated liver tolerance dose in patients receiving different radiotherapeutic regimens [10–12]. The LQ model has been widely used to compare different fractionated radiotherapeutic regimens, despite several limitations [19]. In the present study, we determined the threshold dose for visually apparent focal liver damage using the LQ model to overcome radiotherapeutic regimen–induced variability. An α/β ratio of 2 for the liver has been widely used in LQ model calculations [20]. Using the LQ model, we showed that a BED2 of 40 Gy could predict the incidence of visually apparent liver damage in the cirrhotic liver, regardless of treatment schedule. Furthermore, we suggest that the threshold BED2 for liver damage in the normal liver is 70 Gy. Our results will be instrumental in helping future clinical trials establish radiotherapeutic regimens, including fractionated schedules.
Gd-EOB-DTPA-enhanced MRI has been increasingly used to evaluate hepatic function and has been reported to correlate well with the indocyanine green clearance [13–17]. Recently, MRI changes have been reported to occur in the liver after radiotherapy. Rühl et al. used MRI to determine the tolerance dose for focal liver response after repeated applications of single-fraction irradiation for metastatic liver tumors [21]. Using Gd-EOB-DTPA-enhanced MRI, Sanuki et al. reported that the median tolerance dose was 30.5 Gy in five fractions and 25.2 Gy in five fractions in Child–Pugh A and B patients, respectively [11]. In the present study, we determined the threshold dose for visually apparent focal liver damage using novel in-house software that we developed [18]. This software makes it easier to analyze liver volume loss in the fusion image and provides important information to identify threshold doses with high objectivity.
Previous reports have demonstrated that Child–Pugh score significantly influences hepatic radiation tolerance and tolerance dose differs between Child–Pugh A and B patients [8–12]. However, our data suggest that the minimum dose for radiation-induced liver damage did not differ between Child–Pugh A and B patients. We found that the threshold dose for liver damage after SBRT varied widely in the Child–Pugh score 5 group, which included Child–Pugh A patients. We speculate that the wide range of threshold scores contributed to the lack of association between threshold dose and Child–Pugh classification. Furthermore, the potential inclusion of chronic hepatitis patients with pre-cirrhosis disease in the Child–Pugh score 5 group might have also influenced this association. Advanced chronic hepatitis has been reported to be a risk factor for HCC [22]. In the present study, the threshold BED2 significantly differed between the cirrhotic and normal liver. Our study findings indicate that the tolerance dose for the liver is influenced by fibrotic changes, but not by Child–Pugh score.
Olsen et al. reported that SBRT-induced histopathological changes, including focal veno-occlusive disease with various features, were clearly limited within the high-dose irradiated area [23]. These changes seem to coincide with visualized liver damage on MRI. The selective hepatic uptake of Gd-EOB-DTPA enables visualization of parenchymal volume loss [13–17]. Low-intensity areas due to decreased Gd-EOB-DTPA uptake are assumed to represent radiation-induced liver damage [10, 14].
Several authors have proposed models to predict residual liver volume after surgical resection of liver tumors [24]. SBRT is a well-established treatment option for medically inoperable patients with liver tumors and can provide good in-field local control [1–3]. However, out-field intrahepatic recurrence is the main cause of treatment failure in patients with HCC and liver metastasis. Therefore, models capable of predicting functional liver volume loss after SBRT would be extremely helpful in designing treatment strategies for patients with liver tumors. Threshold BED2 values may represent a practical tool to predict spared liver volume prior to treatment, thus allowing for optimized and individualized treatment plans.
Our study has several limitations. MRI data was analyzed at a single time-point following SBRT. Subsequent studies that use different time-points may yield different results. The radiological response of the liver to radiotherapy stabilizes 2–4 months after radiotherapy, and morphological changes, including liver atrophy, develop later [25–27]. Follow-up MRI at 3–6 months after SBRT seems to be suitable for evaluating hepatic dysfunction because it allows for adequate hepatic recovery with minimal loss of hepatic parenchyma [11]. The accuracy of planning CT and follow-up MRI fusion and individual patient threshold doses might be affected by image mismatch and interobserver errors. We developed in-house software to overcome these artifacts, thus allowing us to objectively evaluate the threshold doses for hepatic dysfunction. Our findings suggest the use of threshold BED2 values of 40 and 70 Gy in the cirrhotic and normal liver, respectively, based on the TD5 values. Although the liver is believed to be a parallel-structured organ, we determined the SBRT dose that provoked small-volume hepatic dysfunction, not hepatic failure. As a result, our estimated threshold doses may potentially overestimate loss of liver function and risk of liver failure. Therefore, we currently provide SBRT for liver tumor when <30% of the whole liver volume receives BED2 values of 50 and 75 Gy for the cirrhotic and normal liver in our clinical practice, respectively. In addition, our sample size was relatively small and, therefore, selection bias may have been present. However, we used statistical tests and scatter diagrams to ensure highly accurate data analysis. To the best of our knowledge, this is the first study to use the LQ model to determine the influence of the Child–Pugh score, treatment regimen, and cirrhosis on threshold BED2 for hepatic dysfunction.
In conclusion, we used threshold BED2 to predict hepatic dysfunction after SBRT in the cirrhotic and normal liver. The suggested threshold BED2 for liver damage is 40 and 70 Gy in the cirrhotic and normal liver, respectively. Child–Pugh classification and treatment regimen did not significantly influence threshold BED2 in patients with liver cirrhosis.
FUNDING
Funding to pay the Open Access publication charges for this article was provided by Miyakojima IGRT Clinic.
Supplementary Material
ACKNOWLEDGEMENTS
We would like to thank Editage (www.editage.jp) for English language editing. This study was presented in part at: the 24th Semi-annual Meeting of the Japan 3D Conformal External Beam Radiotherapy Group, Yokohama, Japan, 2012; the 25th Annual Meeting of the Japanese Society for Therapeutic Radiology and Oncology, Tokyo, Japan, 2012; the 70th Annual Scientific Congress of the Japanese Society of Radiological Technology, Yokohama, Japan, 2014; and ASTRO's 56th Annual Meeting, San Francisco, CA, USA, 2014.
REFERENCES
- 1.National Comprehensive Cancer Network. Hepatobiliary Cancers, Ver. 2, 2015. http://www.nccn.org/professionals/physician_gls/pdf/hepatobiliary.pdf (24 June 2015, date last accessed). [Google Scholar]
- 2.Huertas A, Baumann AS, Saunier-Kubs F et al. Stereotactic body radiation therapy as an ablative treatment for inoperable hepatocellular carcinoma. Radiother Oncol 2015;115:211–6. [DOI] [PubMed] [Google Scholar]
- 3.Tree AC, Khoo VS, Eeles RA et al. Stereotactic body radiotherapy for oligometastases. Lancet Oncol 2013;14:e28–37. [DOI] [PubMed] [Google Scholar]
- 4.Lawrence TS, Robertson JM, Anscher MS et al. Hepatic toxicity resulting from cancer treatment. Int J Radiat Oncol Biol Phys 1995;31:1237–48. [DOI] [PubMed] [Google Scholar]
- 5.Lawrence TS, Ten Haken RK, Kessler ML et al. The use of 3-D dose volume analysis to predict radiation hepatitis. Int J Radiat Oncol Biol Phys 1992;23:781–8. [DOI] [PubMed] [Google Scholar]
- 6.Cheng JC, Wu JK, Huang CM et al. Radiation-induced liver disease after radiotherapy for hepatocellular carcinoma: clinical manifestation and dosimetric description. Radiother Oncol 2002;63:41–5. [DOI] [PubMed] [Google Scholar]
- 7.Pan CC, Kavanagh BD, Dawson LA et al. Radiation-associated liver injury. Int J Radiat Oncol Biol Phys 2010;76:S94–100. [DOI] [PMC free article] [PubMed] [Google Scholar]
- 8.Xu ZY, Liang SX, Zhu J et al. Prediction of radiation-induced liver disease by Lyman normal-tissue complication probability model in three-dimensional conformal radiation therapy for primary liver carcinoma. Int J Radiat Oncol Biol Phys 2006;65:189–95. [DOI] [PubMed] [Google Scholar]
- 9.Liang SX, Zhu XD, Xu ZY et al. Radiation-induced liver disease in three-dimensional conformal radiation therapy for primary liver carcinoma: the risk factors and hepatic radiation tolerance. Int J Radiat Oncol Biol Phys 2006;65:426–34. [DOI] [PubMed] [Google Scholar]
- 10.Son SH, Choi BO, Ryu MR et al. Stereotactic body radiotherapy for patients with unresectable primary hepatocellular carcinoma: dose–volumetric parameters predicting the hepatic complication. Int J Radiat Oncol Biol Phys 2010;78:1073–80. [DOI] [PubMed] [Google Scholar]
- 11.Sanuki N, Takeda A, Oku Y et al. Threshold doses for focal liver reaction after stereotactic ablative body radiation therapy for small hepatocellular carcinoma depend on liver function: evaluation on magnetic resonance imaging with Gd-EOB-DTPA. Int J Radiat Oncol Biol Phys 2014;88:306–11. [DOI] [PubMed] [Google Scholar]
- 12.Jung J, Yoon SM, Kim SY et al. Radiation-induced liver disease after stereotactic body radiotherapy for small hepatocellular carcinoma: clinical and dose–volumetric parameters. Radiat Oncol 2013;8:249. [DOI] [PMC free article] [PubMed] [Google Scholar]
- 13.Katsube T, Okada M, Kumano S et al. Estimation of liver function using T1 mapping on Gd-EOB-DTPA-enhanced magnetic resonance imaging. Invest Radiol 2011;46:277–83. [DOI] [PubMed] [Google Scholar]
- 14.Seidensticker M, Seidensticker R, Mohnike K et al. Quantitative in vivo assessment of radiation injury of the liver using Gd-EOB-DTPA enhanced MRI: tolerance dose of small liver volumes. Radiat Oncol 2011;6:40. [DOI] [PMC free article] [PubMed] [Google Scholar]
- 15.Kamimura K, Fukukura Y, Yoneyama T et al. Quantitative evaluation of liver function with T1 relaxation time index on Gd-EOB-DTPA-enhanced MRI: comparison with signal intensity-based indices. J Magn Reson Imaging 2014;40:884–9. [DOI] [PubMed] [Google Scholar]
- 16.Takao H, Akai H, Tajima T et al. MR imaging of the biliary tract with Gd-EOB-DTPA: effect of liver function on signal intensity. Eur J Radiol 2011;77:325–9. [DOI] [PubMed] [Google Scholar]
- 17.Tsuboyama T, Onishi H, Kim T et al. Hepatocellular carcinoma: hepatocyte-selective enhancement at gadoxetic acid–enhanced MR imaging—correlation with expression of sinusoidal and canalicular transporters and bile accumulation. Radiology 2010;255:824–33. [DOI] [PubMed] [Google Scholar]
- 18.Inoue T, Oh RJ, Shiomi H et al. Stereotactic body radiotherapy for pulmonary metastases. Prognostic factors and adverse respiratory events. Strahlenther Onkol 2013;189:285–92. [DOI] [PubMed] [Google Scholar]
- 19.Hall EJ, Giaccia AJ. Radiobiology for the Radiologist. 7th ed. Philadelphia: Lippincott Williams & Wilkins, 2011. [Google Scholar]
- 20.Dawson LA, Normolle D, Balter JM et al. Analysis of radiation-induced liver disease using the Lyman NTCP model. Int J Radiat Oncol Biol Phys 2002;53:810–21. [DOI] [PubMed] [Google Scholar]
- 21.Rühl R, Lüdemann L, Czarnecka A et al. Radiobiological restrictions and tolerance doses of repeated single-fraction HDR-irradiation of intersecting small liver volumes for recurrent hepatic metastases. Radiat Oncol 2010;5:44. [DOI] [PMC free article] [PubMed] [Google Scholar]
- 22.Yoshida H, Shiratori Y, Moriyama M et al. Interferon therapy reduces the risk for hepatocellular carcinoma: national surveillance program of cirrhotic and non-cirrhotic patients with chronic hepatitis C in Japan. IHIT Study Group. Inhibition of Hepatocarcinogenesis by Interferon Therapy. Ann Intern Med 1999;131:174–81. [DOI] [PubMed] [Google Scholar]
- 23.Olsen CC, Welsh J, Kavanagh BD et al. Microscopic and macroscopic tumor and parenchymal effects of liver stereotactic body radiotherapy. Int J Radiat Oncol Biol Phys 2009;73:1414–24. [DOI] [PubMed] [Google Scholar]
- 24.Wagener G. Assessment of hepatic function, operative candidacy, and medical management after liver resection in the patient with underlying liver disease. Semin Liver Dis 2013;33:204–12. [DOI] [PubMed] [Google Scholar]
- 25.Fajardo LF. The pathology of ionizing radiation as defined by morphologic patterns. Acta Oncol 2005;44:13–22. [DOI] [PubMed] [Google Scholar]
- 26.Maturen KE, Feng MU, Wasnik AP et al. Imaging effects of radiation therapy in the abdomen and pelvis: evaluating ‘innocent bystander’ tissues. Radiographics 2013;33:599–619. [DOI] [PubMed] [Google Scholar]
- 27.Herfarth KK, Hof H, Bahner ML et al. Assessment of focal liver reaction by multiphasic CT after stereotactic single-dose radiotherapy of liver tumors. Int J Radiat Oncol Biol Phys 2003;57:444–51. [DOI] [PubMed] [Google Scholar]
Associated Data
This section collects any data citations, data availability statements, or supplementary materials included in this article.


