

Abstract
Epirubicin (EPI) is widely used for triple negative breast cancer (TNBC), but a substantial number of patients develop EPI resistance that is associated with poor outcome. The underlying mechanism for EPI resistance remains poorly understood. We have developed and characterized an EPI-resistant (EPI-R) cell line from parental MDA-MB-231 cells. These EPI-R cells reached stable growth in the medium containing 8 μg/ml of EPI. They overexpressed P-glycoprotein (P-gp) and contained numerous autophagic vacuoles. The suppression of P-gp overexpression and/or autophagy restored the sensitivity of these EPI-R cells to EPI. We further show that autophagy conferred resistance to EPI on MDA cells by blocking the nuclear factor kappa-light-chain-enhancer of activated B cells (NF-κB)-mediated pro-apoptotic signals. Together, these results reveal a synergistic role of P-gp, autophagy, and NF-κB pathways in the development of EPI resistance in TNBC cells. They also suggest that blocking the P-gp overexpression and autophagy may be an effective means of reducing EPI resistance.
Keywords: autophagy, P-gp, NF-κB, epirubicin, chemotherapy resistance, triple negative breast cancer
Introduction
Cells from triple negative breast cancer (TNBC) are deficient in the expression of the estrogen receptor (ER), progesterone receptor (PR) and human epidermal growth factor receptor 2 (HER2) [1]. TNBC is associated with a high rate of metastasis, a low response to chemotherapy and poor clinical outcome [2]. Anthracyclines are the main therapeutic drugs for TNBC, but 30–40% of patients respond poorly [3]. Among the anthracyclines, epirubicin (EPI) is the most effective against TNBC, but acquired resistance has been reported and significantly limited its therapeutic efficacy in treating TNBC [4]. Resistance to anthracycline drugs has been reported to be caused by: (1) Enhanced drug discharge from cancer cells that is mediated by ATP-binding cassette (ABC) transporters, including P-glycoprotein (P-gp), multidrug resistance-associated protein 1 (MRP1) and breast cancer resistance protein (BCRP) [5]; (2) An amplified process of intracellular “detoxification” through the glutathione transferase (GST) system [6]; (3) TOPO II-mediated changes in gene transcription and translation [7]; (4) changes in the DNA-repair activity [8]; and/or (5) changes in the sensitivity to apoptosis [9]. However, whether these factors are involved in the resistance to all anthracycline drugs or are manifested in a drug-specific fashion remains poorly defined.
To study the EPI resistance of TNBC cells in vitro, we established a new TNBC MDA-MB-231 cell line that is resistant to EPI (EPI-R). The EPI-resistant cells were found to express a high level of P-glycoprotein (P-gp), an ATP-binding cassette (ABC) transporter that is extensively involved in the chemotherapeutic resistance manifested by many types of cancers, including breast cancer [10]. However, the suppression of P-gp expression failed to completely recover the EPI sensitivity of EPI-R cells. Transmission electron microscopy further identified a substantial increase in the number of autophagic vacuoles in these EPI-R cells. These novel findings suggest that P-gp overexpression contributes to EPI resistance, but is not sufficient alone and that autophagy is involved in the development of EPI resistance.
Previous studies have shown that chemotherapy induces autophagy in cancer cells [11]. Laboratory and clinical evidence also suggests that autophagy regulates the response of cancer cells to chemotherapy [12]. For example, autophagy is found to be responsible for the resistance of breast cancer cells to tamoxifen [13] and Herceptin [14]. While a relationship between chemotherapy efficacy and autophagy has been experimentally examined, previous studies have often been conducted on cancer cells that are not resistant to chemotherapeutic drugs [15] or are ER, PR, and HER2-positive [16]. A specific role of autophagy in drug resistance cannot be examined in more clinically relevant triple negative breast cancer cells.
Autophagy refers to an intracellular process of the lysosome-dependent metabolic degradation of aberrant proteins and disrupted organelles that are contained in a characteristic double membrane vesicle called autophagosome. Upon membrane fusion, these autophagosome vesicles deliver their content to lysosomes for enzymatic degradation. Autophagy is critical for the self-renewal and survival of cells in response to environmental stress [17,18], The formation of autophagosomes is initiated by Beclin 1 and its binding partner class III phosphoinositide 3-kinase. Beclin 1 also interacts with anti-apoptotic BCL2 family proteins [19], suggesting a convergence between the autophagy and apoptosis pathways in the development of resistance to chemotherapeutic drugs.
A key factor in initiating and propagating apoptosis is the transcription factor NF-κB, which is typically associated with members of the Rel family such as P50, P65 (RelA), c-Rel, P52 and RelB. The activation of NF-κB is commonly identified by the phosphorylation of the P65/P50 heterodimer. NF-κB activated by chemotherapeutic drugs [20] plays a regulatory role in the overall resistance to these drugs [21]. However, relative contributions of autophagy and apoptosis to EPI resistance have not been determined. In light of published reports and our own experimental findings obtained from testing EPI-R cells, we hypothesized that (1) EPI at long exposure and/or high doses induces autophagy, rendering triple negative breast cancer cells resistant to EPI; (2) this EPI-induced autophagy persists after EPI withdrawal, becoming an intrinsic phenotype of EPI resistance and (3) autophagy-mediated drug resistance involves the NF-κB apoptosis pathway. We have tested these hypotheses using the EPI-R cell line that we have recently established as an in vitro model system. The findings shed new lights on the underlying mechanism for EPI resistance in TNBC cells and a role of autophagy in the process.
Materials and methods
Cells
Triple positive MCF-7 and triple negative MDA-MB-231 (MDA) breast cancer cells were purchased from the Chinese Academy of Sciences (Shanghai, China). These cells were respectively cultured in RPMI-1640 and DMEM media supplemented with 10% fetal bovine serum (FBS), and maintained at 37°C with 5% CO2 and 95% air for all of the experiments described herein.
Antibodies
We purchased rabbit anti-human microtubule-associated protein 1 light chain 3 beta polyclonal antibody (MAPLC3β, L8918) from Sigma-Aldrich (St. Louis, MO, USA); mouse monoclonal anti-human P-gp antibody (MRK 16) from the Kamiya Biomedical Company (Seattle, WA, USA); rabbit polyclonal anti-human MRP1 (BA0567) and rabbit polyclonal anti-rabbit β-actin (BA2301) antibodies from the Boster Bio-Engineering Limited Company (Wuhan, Hubei, China); mouse monoclonal anti-human Beclin 1 (YM0060), rabbit polyclonal anti-human BAX (YT0459), rabbit polyclonal anti-human BCL2 (YT0469), rabbit polyclonal anti-human cleaved-caspase 3 (D175, YC004), rabbit polyclonal anti-human phospho-NF-κB-P65 (S536, YP0191), rabbit polyclonal anti-human P-gp (YT3692) and rabbit polyclonal anti-human BCRP (YT0053) antibodies from ImmunoWay (Newark, DE, USA).
Other reagents
EPI (H20041211), adriamycin (ADM, H20041318), and taxol (H20059377) were purchased from the Zhejiang Hisun Pharmaceutical Co., Ltd (Taizhou, Zhejiang, China). Etoposide (H37023183) and cisplatin (H37021358) were obtained from the Qilu Pharmaceutical Co., Ltd (Jinan, Shandong, China). The autophagy inhibitor chloroquine (CQ, B1793), the fluorescent dye monodansylcadaverine (MDC, 30432), Verapamil hydrochloride (V4629), ammonium pyrrolidinedithiocarbamate (PDTC, P8765) and 3-(4,5-dimethyl-2-thiazolyl)-2,5-diphenyl-2-H-tetrazolium bromide (MTT, M2128) were obtained from Sigma-Aldrich (St. Louis, MO, USA). Rhodamine 123 (Rh 123, R8004) was purchased from BioSharp (Hefei, Anhui, China).
Cell viability assay
Cells were seeded at a density of 8×10³ cells/well in a 96-well flat-bottom plate overnight at 37°C. These cells were then cultured for various times in the medium that contained a testing agent at 37°C. Cell viability was measured at OD490 nm using the MTT assay. EPI was tested at 0.25, 0.5, 1, 2, 4, 8, 16 and 32 μg/ml. Taxol (1, 2.5, 5, 7.5, 10, 15, 25 and 50 μg/ml), etoposide (1, 10, 100, and 1,000 μg/ml), and cisplatin (1, 10, 100, and 1,000 μg/ml) were also tested. For the assay, the IC50 was defined as the concentration of EPI that inhibits 50% of cell proliferation.
Cell growth assay
Two assays were used to cross-validate the results. The first was a daily count in duplicate plates of the cells, which had initially been seeded at a density of 5×10⁴ in DMEM medium containing 10% FBS. The second was the MTT assay, in which cells were seeded at 500 cells/well in 96-well flat-bottom plate and the optical density of the cells was measured at OD490 nm daily for 7 days.
Transmission electron microscopy (TEM)
Cells were fixed in 2.5% glutaraldehyde for 1 hr and then exposed to 2.5% osmic acid for 1 hr. The gel-embedded cells were dehydrated using gradient ethanol solutions and infiltrated with propylene oxide. After being embedded in epoxy resin, cells were thin-sectioned, stained with uranyl acetate and lead citrate, and viewed under transmission electron microscopy (JEM-1230, JEOL, Japan).
Flow cytometry
This technique was used for four assays. The first was to analyze cell cycle distribution as previously reported [22]. Briefly, cells were fixed in 70% ice-cold ethanol for 24 hrs, washed twice with ice-cold PBS and then treated with RNase A (20 μg/ml) for 30 min at 37°C. The treated cells were incubated with propidium iodide (PI, final concentration: 10 mg/ml) in dark for 30 min at room temperature and then analyzed for DNA ploidy on a flow cytometer (FACSVerse, BD, New Jersey, US). The second experiment measured the expression of P-gp on the cell surface. Briefly, cells were washed and resuspended in PBS at a density of 106 cells/ml. They were incubated with a mouse monoclonal anti-human P-gp antibody for 20 min at room temperature. Following washes with PBS, they were resuspended in 0.3 ml of PBS and incubated with a PE-conjugated goat anti-mouse IgG2a for 20 min at room temperature. The stained cells were analyzed and data presented as the geometrical mean fluorescence. The third flow cytometry-based technique detected drug accumulation and efflux from cells that were treated with the fluorescent dyes ADM [23] or Rh123 [24]. Once inside a cell, ADM emits fluorescence with signal intensity proportional to the amount of intracellular ADM. Rh 123 is a cationic fluorescent dye that is absorbed by mitochondria. Since both dyes are specifically removed from cells by P-gp, their efflux can be used as a marker of P-gp activity. For dye accumulation, cells were incubated for 30 min at 37°C with either 30 μg/ml of ADM or 15 μg/ml of Rh 123, washed with ice-cold PBS and analyzed immediately for the accumulation of intracellular fluorescence. For dye efflux, ADM- or Rh123-labeled cells were incubated for an additional 60 min at 37°C in the dark with dye-free PBS, washed twice with ice-cold PBS and examined for residual intracellular fluorescence. The fourth experiment measured cell apoptosis using a Dead Cell apoptosis kit (Invitrogen, Grand Island, NY, USA) according the manufacturer’s instructions. Briefly, cells (106 cells/ml) were incubated with 5μl Alexa Fluor® 488-conjugated annexin V and 0.1 μg of PI at room temperature for 15 min. After dilution with 1× annexin-binding buffer, the cells were analyzed for annexin V binding by flow cytometry.
Short hairpin RNA (shRNA) interference
Four short hairpin oligonucleotides derived from the human MDR1 gene (sh-MDR1-1: GAACACATTGGAAGGAAAT, sh-MDR1-2: ACAGAATAGTAACTTGTTT, sh-MDR1-3: TCATCGTTTGTCTACAGTT, sh-MDR1-4: TGCTTTCCTGCTGATCTAT) and four from the human BECN1 gene (sh-BECN1-1: CAAGTTCATGCTGACGAAT, sh-BECN1-2: GACTTGTTCCTTACGGAAA, sh-BECN1-3: CGTGGAATGGAATGAGATT, sh-BECN1-4: CAGGATGATGTCCACAGAA) were synthesized by GeneChem Co., Ltd. (Shanghai, China), individually cloned into the mammalian vector GV118, and transiently transfected into EPI-R and the parental MDA cells using Lipofectamine™ 2000 (Invitrogen, Grand Island, NY, USA) as the oligonucleotide carrier. The expression of the MDR1 and BECN1 gene products P-gp and Beclin 1, respectively, were evaluated 48 hrs after transfection by western blot.
MDC staining
Cells were treated with testing agents for various periods of time and then incubated for 1 hr at 37°C with 0.1 mM MDC, which is a marker for autophagic vacuoles. These cells were then fixed in 4% paraformaldehyde for 10 min and viewed under an upright fluorescence microscope (Nikon, Japan). MDC fluorescence was quantified by threshold fluorescence intensity by Image-Pro Plus 6.0 software.
Immunoblots
Cells were seeded in 25-cm2 tissue culture flasks and allowed to achieve ~ 80% confluence. After being treated with a testing agent for indicated times, the cells were detached and lysed in 1× PBS (pH 7.6) containing 1% NP-40, 0.1% sodium dodecyl sulfate (SDS), 0.5% sodium deoxycholate and a protease inhibitor cocktail (Sigma-Aldrich). Cell lysates were separated by 12 or 15% SDS-polyacrylamide gel electrophoresis (SDS-PAGE) and electro-transferred to polyvinylidene fluoride (PVDF) membrane. For immunoblots, the membrane was blocked by 5% nonfat dry milk in Tris-buffered saline-Tween 20 (TBST, pH 7.6) for 1 hr at room temperature followed by an overnight incubation at 4°C with a primary antibody diluted in TBST. After washing it three times with TBST to remove unbound antibody, the membrane was incubated with a fluorescently-labeled secondary antibody (1: 5000 dilution, Licor) for 1 hr at room temperature. The protein-antibody complexes were visualized using the Odyssey detection system (Licor Biosciences, Nebraska, US). The amount of proteins probed by immunoblots was estimated by densitometry using the integrated optical density analysis tool provided by the Image Pro Plus 6.0 software.
Quantitative real-time PCR (qRT-PCR) and reverse transcription PCR (RT-PCR)
Total RNA was isolated from cells using a commercial RNA extraction kit (TaKaRa Biotechnology, Dalian, Liaoning, China) and reverse-transcribed using M-MLV reverse transcriptase (Takara Biotechnology) according to the manufacturer’s instructions. The reverse-transcribed cDNA (1 μg/ml) was used as the template for subsequent quantitative and semi-quantitative PCR reactions with the primers listed in Table. 1.
Table 1.
Primers used for reverse transcription
| Primers | Primer sequence (5′-3′) | Size of products (bp) | Cycles | Tm (°C) |
|---|---|---|---|---|
| MDR1 | F:5′- CCCATCATTGCAATAGCAGG-3′ R:5′- GTTCAAACTTCTGCTCCTGA-3′ |
157 | 40 | 57 |
| BECN1 | F:5′- AACCAACGTCTTTAATGCAACCTTC-3′ R:5′- GGCATGGAGCAGCAACACAGTC-3′ |
143 | 35 | 63 |
| BCL2 | F:5′- AACATCGCCCTGTGGATGAC-3′ R:5′- AGAGTCTTCAGAGACAGCCAGGAG-3′ |
142 | 35 | 63 |
| β-actin | F:5′- TGCTCCTCCTGAGCGCAAGTA-3′ R:5′- CCACATCTGCTGGAAGGTGGA-3′ |
186 | 35 | 63 |
qRT-PCR for MDR1 and BCL2 mRNA was performed using the SYBR Premix Ex Taq II TM kit (Takara Biotechnology). Relative quantifications (RQ) of MDR1 and BCL2 mRNA were made using a comparative CT method (RQ=2−ΔΔCT) and normalized to the level of β-actin mRNA. In addition, reverse-transcribed DNA from MDR1 and BECN1 mRNA was amplified using the GoTap Green Master Mix (Promega Co. Ltd., Beijing, China) and separated by 1.5% agarose gel electrophoresis. DNA bands were visualized under UV light and quantified by Image Pro Plus 6.0 software using the integrated optical density analysis tool.
Statistical analysis
Data were analyzed using SPSS 20.0 (SPSS, Inc.). Quantitative results are expressed as the mean ± SE. Statistical comparisons of the mean were performed using the analysis of variance (ANOVA) or t-test as specified in each data set. The IC50 was determined by the probit regression analysis model in SPSS 20.0. A p value of < 0.05 was considered statistically significant. All microscopic images and data from immunoblots are representative of three or more separate experiments, and quantified by immunofluorescence intensity of labeled cells and the densitometry of specific protein bands, respectively, using graphic tools provided in Image Pro Plus 6.0 software package.
Results
Establishment of an EPI-resistant (EPI-R) cell line≠
To establish an EPI-resistant cell line, we first tested the EPI sensitivity of cells from the common breast cancer lines MCF-7 and MDA. These two cell lines were chosen because the former is ER+/PR+/HER2+ and the latter is triple negative. When exposed to EPI, MDA cells were more sensitive to EPI than MCF-7 cells (Supplementary Table 1) and also allowed for specifically examining the response of triple negative cells to the chemotherapeutic drugs to be tested in the study. MDA cells were, therefore, selected as the parental cell line to establish an EPI-resistant cell line.
We modified a protocol reported by Liang et al [25] to select cells for EPI resistance. Briefly, MDA cells were cultured in the DMEM medium containing increasing concentrations of EPI (0.0625, 0.125, 0.25, 0.5, 1, 2, 4, 6 or 8 μg/ml). At each EPI dosing, cells were exposed to EPI for 24 hrs followed by 6 weeks in EPI-free medium, until they reached stable growth in the medium containing 8 μg/ml of EPI for 13 months. The EPI-R cells were then maintained in the medium containing 4 μg/ml of EPI. All experiments reported here were conducted in EPI-R cells that had been cultured in EPI-free medium for 2 months.
EPI-R cells were found to be more viable at all doses of EPI, as measured by the MTT assay (Fig. 1A), reaching an IC50 that was 55 fold higher than the parental MDA cells (Tab. 2). The resistance index (RI) did not change after EPI-R cells were grown in the EPI-free medium for 2 months or when they were subjected to repeated cycles of freezing and thawing (Fig. 1B), suggesting that the EPI-R cells are stably resistance to EPI. In addition to EPI, EPI-R cells also exhibited resistance to taxol, etoposide and cisplatin (Fig. 1C–1E), but with IC50s that were lower than EPI (Tab. 2).
Figure 1. Establishment of an EPI-resistant (EPI-R) cell line.
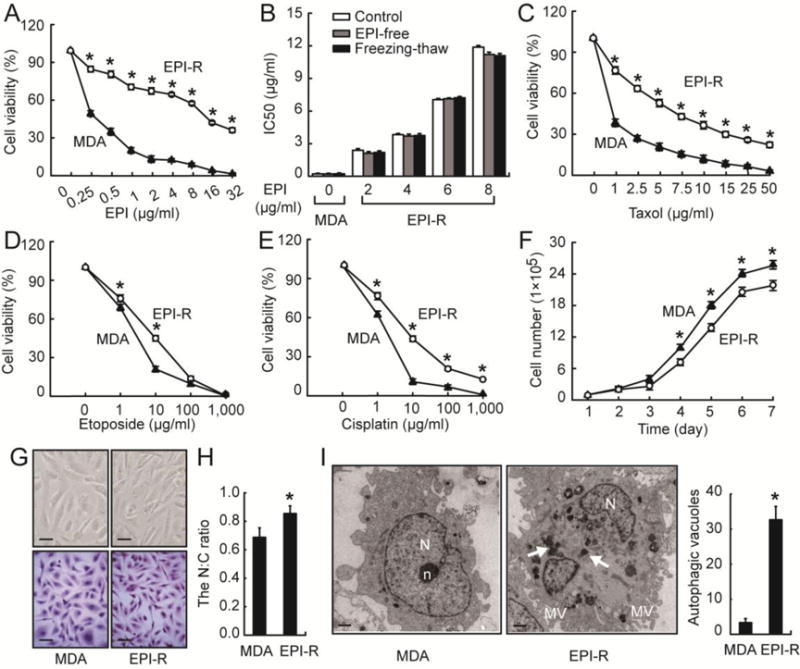
(A) MDA and EPI-R cells were incubated with EPI for 72 hrs and examined for cell viability by the MTT assay (n = 3, t-test at each dose, *p < 0.05). (B) IC50 of MDA and EPI-R cells that were cultured in EPI-containing (open bar), EPI-free medium (grey bar) for 2 months or subjected to freeze-thaw cycles (black bar, n = 3 in each group, ANOVA). MDA and EPI-R cells incubated with taxol (C), etoposide (D), and cisplatin (E) for 72 hrs were examined for cell viability by MTT assay (n = 3 in each group, t-test, *p < 0.05). (F) MDA and EPI-R cells were cultured in an EPI-free medium for 7 days to measure daily cell survival (n = 3, t-test, *p < 0.05). (G) EPI-R and MDA cells were examined under the phase contrast microscopy (top panel, bar = 40 μm) and after they were stained with hematoxylin and eosin (bottom panel, bar = 40 μm). (H) The nucleus-to-cytoplasm (N:C) ratio of the HE-stained EPI-R and MDA cells was quantified by Image-Pro Plus 6.0 (n = 3, t-test, *p < 0.05). (I) TEM images of MDA and EPI-R cells, Autophagosome-like vacuoles are indicated by white arrows (left, bar = 1 μm, N: nucleus, n: nucleolus, MV: microvilli). The bar graph (right) counts autophagic vacuoles from multiple TEM images (n = 3, t-test, *p < 0.05).
Table 2.
IC50 of MDA and EPI-R cells to EPI, taxol, etoposide, and cisplatin
| Agents | IC50 (48 hrs) |
RI48 | IC50 (72 hrs) |
RI72 | ||
|---|---|---|---|---|---|---|
| MDA | EPI-R | MDA | EPI-R | |||
| EPI | 1.65±0.18 | 23.55±0.75* | 14.27 | 0.22±0.05 | 11.88±0.14* | 54.98 |
| taxol | 3.66±0.44 | 21.65±0.52* | 5.92 | 0.79±0.13 | 9.674±0.1* | 12.26 |
| etoposide | 8.3±0.24 | 10.5±0.33* | 1.27 | 2.97±0.07 | 5.173±0.04* | 1.74 |
| cisplatin | 4.97±0.14 | 8.52±0.19* | 1.71 | 1.31±0.01 | 7.034±0.06* | 5.36 |
IC50 was measured in cells incubated with each of these drugs for 48 and 72 hrs. T-test, n = 3 in each group,
p < 0.05
EPI-R cells grew in an EPI-free medium at a slightly slower rate than the parental cells, as measured by cell numbers (Fig. 1F) and the MTT assay (Fig. S1), and were found more in the G0/G1 phase (Tab. 3 & Fig. S2). Morphologically, EPI-R cells were predominantly spindle-like (Fig. 1G), with a higher nucleus to cytoplasm ratio than their parental MDA cells (Fig. 1H). TEM shows that EPI-R cells formed extensive microvilli on their surface (Fig. 1I) and had more cytoplasmic organelles (data not shown). Most importantly, the EPI-R cells contained a large number of autophagosome-like vacuoles in their cytoplasm (Fig. 1I). Together, these data suggest that EPI-R cells are highly tolerant to EPI, are developmentally more immature, and have distinct morphologies. A key characteristic of these EPI-R cells was the enhanced capacity for autophagy.
Table 3.
Cell cycles of MDA and EPI cells measured by flow cytometry
| Cell lines | The percentage of cells (%) |
||
|---|---|---|---|
| G0/G1 | S | G2/M | |
| MDA | 71.11 ±0.85 | 17.95±0.07 | 10.94 ±0.12 |
| EPI-R | 90.04±1.06* | 8.38 ±0.35* | 1.58±0.28* |
T-test, n = 3 in each group,
p< 0.05
Impact of high P-gp expression on EPI resistance
This newly established EPI-resistant cell line afforded us a unique opportunity of studying the underlying mechanism of EPI resistance. Our initial focus was on ABC transporters, which are known to be closely involved in the EPI resistance of breast cancer cells. We measured the level as well as the function of ABC transporters in EPI-R and the parental MDA cells by examining rates of the ABC transporter-dependent efflux of fluorescent dyes ADM and Rh 123. There was no difference in the rate of dye accumulation between the EPI-R and the parental cells (Fig. 2A). However, the efflux of both dyes (indicative of ABC transporter activity) was significantly increased in EPI-R cells. Approximately 70.2% of ADM and 89.9% of Rh 123 was discharged from EPI-R cells after a 60-min incubation with dye-free PBS, whereas only minimal dye efflux was observed for the parental MDA cells during the same time period (Fig. 2B). The multidrug transporter inhibitor Verapamil reversed the accelerated dye exclusion in EPI-R cells to a level similar to that of the parental MDA cells (Fig. 2B). These dye accumulation and efflux profiles strongly indicate that EPI-resistant cells have an enhanced ABC transporter activity, a conclusion that was cross-validated by two different classes of dyes: ADM and Rh123.
Figure 2. P-gp overexpression in EPI resistant cells.

MDA and EPI-R cells were incubated with ADM or Rh 123 in the presence and absence of the P-gp inhibitor verapamil (Vera, 5 μM) for 30 min at 37°C to measure ABC-dependent dye accumulation (A) and then incubated with a dye-free medium for an additional 60 min to measure the ABC-dependent dye efflux (B, n = 3, ANOVA, *p < 0.05 vs. MDA cells). (C) MDA cells treated with EPI were examined for the expression of P-gp, BCRP and MRP1. The bar graph on the right represents densitometry measurements for multiple SDS-PAGE (n = 3, repeat measures ANOVA, *p < 0.05 vs. untreated). (D) Levels of MDR1 mRNA in EPI-R and MDA cells were measured by qRT-PCR (n = 3, t-test, *p < 0.05). (E) The percentage of P-gp positive EPI-R and MDA cells was quantified by flow cytometry (n = 3, t-test, *p < 0.05). (F) The top panel: representative of MDR1 mRNA detected by RT-PCR of the cells transfected with each of the 4 sh-MDR1 or a scramble (Scr) oligonucleotides (control: untransfected EPI-R cells) and bottom: a summary of densitometry measurements from 3 experiments (ANOVA, *p < 0.05 vs. EPI-R cells transfected with a scramble oligonucleotide [Scr]). (G) Top panel: representative immunoblots of P-gp detected in EPI-R cells transfected with each of four sh-MDR1-3 oligonucleotide or a scramble oligonucleotide. Untransfected EPI-R cells were tested as control. Bottom panel: densitometry measurements of 3 independent immunoblots (ANOVA, *p < 0.05 vs. Scr.). (H) EPI-R cells transfected with sh-MDR1-3 or a scramble oligonucleotide were treated with EPI for 72 hrs and subsequently examined for viability (n = 3, ANOVA, *p < 0.05 vs. cells transfected with the scramble oligonucleotide).
Consistent with this increased rate of dye efflux, we detected substantially increased expressions of the ABC transporters P-gp, MRP1 and BCRP in MDA cells tolerized with increasing concentrations of EPI (Fig. 2C). The mRNA level of MDR1, which encodes for P-gp [26] was 53.7-fold higher in EPI-R cells compared to the parental MDA cells (Fig. 2D). Furthermore, the overexpression of P-gp was found in 54.2–56% of the EPI-R cells, as compared to 0.5–0.57% of the MDA cells (Fig. 2E). To further investigate the impact of the P-gp overexpression on EPI resistance, we suppressed P-gp expression using sh-MDR1 oligonucleotides. Among the four probes synthesized and transfected, sh-MDR1-3 drastically reduced the level of both MDR1 mRNA (Fig. 2F) and P-gp protein (Fig. 2G) to levels similar to those of the parental MDA cells. More importantly, EPI-R cells transfected with sh-MDR1-3 had an increased sensitivity to EPI compared to EPI-R cells that were either untransfected or transfected with a scramble oligonucleotide (Fig. 2H). However, the IC50 for EPI remained significantly higher for EPI-R cells transfected with sh-MDR1-3 than that of the parental MDA cells (4.39 μg/ml vs. 0.22 μg/ml, paired t test, p < 0.001), suggesting that EPI sensitivity was only partially recovered by suppressing P-gp expression.
Enhanced autophagy in EPI-R cells
As shown in Fig. 1I, there were a large number of autophagosome-like vacuoles in EPI-R cells. These vacuoles persisted in high numbers for a prolonged period of time after EPI was removed from the medium, suggesting that (1) EPI-induced autophagy renders the cells resistant to EPI and (2) the EPI-induced autophagy becomes an intrinsic structural feature of EPI-R cells. To test these hypotheses, we measured the presence/levels of the LC3-II complex, a marker for autophagic flux, in parental MDA and EPI-R cells. The microtubule-associated proteins 1A/1B, as well as the light chains 3A/LC3A and 3B/LC3B (collectively referred to as LC-3) are ubiquitin-like proteins that are involved in the synthesis of pro-LC3, which is cleaved by Atg4 to generate cytosolic LC3-I. During autophagosome formation, LC3-I is converted to LC3-II by forming a covalent complex with the membrane-bound phosphatidylethanolamine. LC3-II located on the surface of autophagosomes is widely used as a reliable marker for monitoring autophagy [27].
We detected an increased level of LC3-II in EPI-R cells that were either newly established or cultured in an EPI-free medium for 2 months (Fig. 3A). Consistent with this result, MDC labeling was enhanced in EPI-R cells (Fig. 3B, top panel). and reduced by the sh-MDR1-3-mediated suppression of MDR1 transcription. These EPI-R cells also expressed higher levels of BECN1 mRNA (Fig. 3C) and its encoded protein, Beclin 1 (Fig. 3D), which is critical for autophagy formation. When four short hairpin oligonucleotides for BECN1 (sh-BECN1-1 to 4) were individually transfected into the EPI-R cells, sh-BECN1-1 and 2 were found to be most active in suppressing BECN1 mRNA (Fig. S3) and Beclin 1 protein (Fig. S4) in EPI-R cells. More importantly, Beclin 1 expression was suppressed in EPI-R cells transfected with the sh-MDR1-3 oligonucleotide (Fig. 3B bottom panel & 3E), which suppressed P-gp expression (Fig. 2F & 2G) and sensitized EPI-R cells to EPI (Figure 2F–2H). In contrast, P-gp expression was not affected in EPI-R cells transfected with sh-BECN1-1 (Fig. 3F), which inhibited autophagy. Together, these data demonstrated an interaction between ABC transporter and autophagy in inducing EPI resistance. In this interaction, Beclin 1 acts downstream of P-gp, suggesting an active role of P-gp in enhancing autophagy in EPI-R cells.
Figure 3. Enhanced autophagy in EPI-R cells.

(A) Top panel: LC3-I (18 kDa) and LC3-II (16 kDa) were detected with specific antibodies in lysates of MDA and EPI-R cells that were either newly established (Ctrl) or had been cultured in EPI-free medium for 2 months. Bottom panel: quantitative densitometry of 3 independent immunoblots (ANOVA, *p < 0.05 vs. MDA cells). (B) MDC fluorescence of MDA and EPI-R cells that were untransfected or transfected with either sh-MDR1-3 or a scramble oligonucleotide (left panel, bar = 40 μm) and intracellular fluorescence intensity measured from 3 independent experiments (right, ANOVA, *p < 0.05 vs. EPI-R cells transfected with a scramble oligonucleotide). (C) Top panel: BECN1 mRNA was detected by RT-PCR in EPI-R cells in media containing 2, 4, or 8 μg/ml EPI and the parental MDA cells. Bottom panel: the densitometry summary of 3 independent immunoblots (ANOVA, *p < 0.05 compared to MDA cells). (D) Beclin 1 protein detected by a specific antibody in a representative immunoblot of EPI-R cells that were treated identically as C (top panel) and quantified by densitometry from 3 independent immunoblots (bottom panel, ANOVA, *p < 0.05 vs. MDA cells). (E) A representative immunoblot of Beclin 1 expression in EPI-R cells that were untransfected or transfected with sh-MDR1-3 or a control scramble oligonucleotide (top) and quantitative data by densitometry from 3 independent immunoblots (bottom, ANOVA, *p < 0.05 vs. scramble transfection). (F) P-gp detected by a representative immunoblot of EPI-R cells that had been transfected with sh-BECN1-1 or a scramble oligonucleotide (top) and quantified by 3 independent densitometry (bottom, ANOVA).
To address the question of whether increase in autophagy confers EPI resistance, we blocked autophagy in EPI-R cells by suppressing Beclin 1 expression or by the autophagy inhibitor CQ. EPI-R cells transfected with sh-BECN1-1 or treated with 40 μM CQ had a low expression of the autophagy marker MDC (Fig. 4A). CQ also significantly increased the level of LC3-II (Fig. 4B), primarily by blocking LC-3 flux [28]. Moreover, EPI-R cells transfected with sh-BECN1-1 or treated with 40 μM CQ became sensitized to high doses of EPI (Fig. 4C & 4D). This reversal of EPI resistance was greater in EPI-R cells transfected with sh-MDR1-3 and treated with CQ, as compared to either sh-MDR1-3 transfection or CQ treatment alone (Fig. 4E). This concentration of CQ was used in a 12-hr incubation time to minimize its cytotoxic effects (Fig. S5), while maintained its activity in blocking autophagy. The data presented in Figure 4 collectively suggest that suppressing autophagy partially restored the sensitivity of EPI-R cells to EPI.
Figure 4. EPI sensitization by inhibition of autophagy.

(A) Representative images of MDC labeling of MDA and EPI-R cells untransfected or transfected with either sh-BECN1-1 or treated with 40 μM CQ (left, bar = 40 μm). The intracellular fluorescence was quantified from 3 separate experiments (right, ANOVA, *p < 0.05 vs. EPI-R cells). (B) EPI-R cells were cultured for 12 hrs in the presence and absence of 40 μM CQ. LC3-I and LC3-II were detected by specific antibodies (top) and their expression was quantified by densitometry from 3 independent immunoblots (bottom, t-test, *p < 0.05). (C) EPI-R cells transfected with sh-BECN1-1 or scramble oligonucleotides were treated with EPI for 72 hrs to measure cell viability (n = 3, ANOVA at each dose, *p < 0.05). (D) EPI-R cells treated for 12 hrs with 40 μM CQ or vehicle control were subsequently treated with EPI for 72 hrs to measure cell viability (n = 3, paired t-test at each dose, *p < 0.05). (E) The viability of EPI-R cells transfected with sh-MDR1-3 and then exposed to either 40 μM CQ or vehicle control for 12 hrs in medium containing high doses of EPI. The values are after subtraction from basal measurements in MDA cells (n = 3, repeat measures ANOVA, *p < 0.05, #p < 0.05).
Interaction between autophagy and the NF-κB pathway
In addition to P-gp overexpression and enhanced autophagy, we also detected an elevated level of BCL2 mRNA in EPI-R cells (Fig. S6), indicating a reduction in apoptosis. We thus conducted several experiments to specifically investigate a potential cross-talk between autophagy and apoptosis, with a specific focus on how autophagy influences EPI-induced apoptosis. First, we found that MDC labeling (a marker for autophagy) was significantly enhanced in EPI-R cells treated with 4 μg/ml of EPI for 24 hrs (Fig. S7), indicating that EPI is able to induce further autophagy in EPI-R cells. Second, EPI-R cells that exhibited a high level of LC3-II (indicative of an increase in autophagic flux) also had a reduced level of cleaved-caspase 3 (Fig. S8). Third, suppressing autophagy in EPI-R cells by either sh-BECN1-1 (Fig. 5A) or 40 μM CQ (Fig. 5B) increased the cleavage of caspase 3 as well as the BAX-to-BCL2 ratio, two well-established markers for apoptosis. Fourth, the observed increases in caspase 3 cleavage and the BAX-to-BCL2 ratio induced by sh-BECN1 or CQ were reversed by the NF-κB inhibitor PDTC (Fig. 5A & 5B). The rate of apoptosis in EPI-R cells treated with CQ was also higher than EPI-R cells and this increase was reversed by PDTC (Fig. 6A). Fifth, the phosphorylation of P65, a key component of the transcription factor NF-κB complex was significantly reduced in EPI-R cells (Fig. 5A & 5B). This reduction was reversed in EPI-R cells that were transfected with sh-BECN1-1 (Fig. 5A) or treated with 40 μM CQ (Fig. 5B). PDTC eliminated the effect of sh-BECN1-1 transfection or CQ treatment (Fig. 5A & 5B). Finally, PDTC partially reversed the CQ- or sh-BECN1-1-induced sensitization of EPI-R cells to high doses of EPI (Fig. 6B & 6C). Together, these data indicate that a dynamic balance between autophagy and apoptosis is critical for regulating EPI resistance and that autophagy down-regulates the NF-κB pathway to inhibit EPI-induced apoptosis.
Figure 5. Interaction between autophagy and NF-κB pathways.

(A) Expressions of BAX, BCL2, cleaved-caspase 3, phosphorylated P65, and GAPDH (as loading control) in MDA and EPI-R cells that were transfected with either sh-BECN1-1 or a scramble oligonucleotide (left) and quantified by densitometry from 3 separate immunoblots (right, ANOVA, *p < 0.05 vs. scramble transfection, #p < 0.05 vs. sh-BECN1-1 transfected). A subgroup of cells was also treated with 50 μM PDTC for 1 hr in medium containing 4 mg/ml of EPI. The BAX-to-BCL2 ratio was separately determined by densitometry. (B) The same expression profile was also detected in EPI-R cells treated with 40 μM CQ for 12 hrs (left, MDA cells used as control) and quantified through 3 independent experiments (right, ANOVA, *p < 0.05 vs. scramble transfection, #p < 0.05 vs. EPI-R cells with CQ).
Figure 6. Induction of apoptosis after inhibition of autophagy.

(A) Density plots (left) of Alexa Fluor® 488-Annexin V/PI staining of EPI-R cells that were treated with CQ and/or PDTC by flow cytometry. Quantitative data are summarized in the right panel (n = 3, ANOVA, *p < 0.05 vs. EPI-treated EPI-R cells, #p < 0.05 vs. EPI and CQ-treated EPI-R cells). (B) The viability of EPI-R cells that were transfected with sh-BECN1-1 or a scramble oligonucleotide, and subsequently exposed to either 50 μM PDTC or a vehicle control in the medium containing increasing concentrations of EPI. The values are after subtraction from basal measurements of untreated MDA cells (n = 3, repeat measures ANOVA, *p < 0.05 vs. sh-BECN1-1 transfected cells). (C) The same experiments with EPI-R cells treated with 40 μM CQ, with or without additional treatment of 50 μM PDTC in the medium containing increasing concentrations of EPI for 72 hrs. The values are also after base MDA subtraction (n = 3, repeated measures ANOVA, *p < 0.05 vs. CQ-treated cells).
Discussion
Acquired resistance has significantly limited the therapeutic efficacy of EPI to treat TNBC [4]. In an effort to investigate the underlying mechanism of EPI resistance specifically in triple negative breast cancer, we established and characterized an EPI-resistant cell line developed from the parental MDA cells (Fig. 1). These EPI-resistant cells are similar to those reported by Negoro et al [29] and Zhang et al [30]. During the preparation of this manuscript, Chittaranjan et al [31] reported the establishment and characterization of an EPI-resistant MDA-MB-231 cell line that is similar to the EPI-R cell line reported here. Our study supports the basic findings made by Chittaranjan et al., but also investigated interactions among autophagy, ABC transporters, and apoptosis that results in EPI resistance.
In addition to EPI resistance, we also show that these EPI-R cells are resistant to taxol, etoposide and cisplatin, albeit at lower activities, indicating that they are multidrug-resistant. This finding is particularly important because these chemotherapeutic drugs inhibit cancer cells through different mechanisms: taxol disrupts microtubules during cell division; etoposide is a topoisomerase inhibitor and cisplatin crosslinks DNA to induce apoptosis, suggesting that P-gp and autophagy are common pathways in the development of drug resistance.
We demonstrated that an overexpression of P-gp, a crucial drug efflux transporter that is involved in MDR [32], is partially responsible for EPI resistance in TNBC cells (Fig. 2). The overexpression of P-gp makes EPI-R cells to undergo cell cycles different from their parental MDA cells. This cell cycle change may alter expressions and functions of checkpoint proteins. This notion is consistent with P-gp expression being cell cycle dependent in cells that are multidrug resistant [33]. This conclusion is supported by a previous report that P-gp binds EPI and other anthracyclines (e.g. doxorubicin and daunorubicin) to help actively transport these hydrophobic drugs out of cancer cells to reduce their intracellular concentrations [34]. A key finding of this study is that the suppression of P-gp overexpression did not fully restore the sensitivity of EPI-R cells to EPI, suggesting that other molecules and/or pathways are involved in the development of EPI resistance. One of these pathways is autophagy.
EPI-R cells were found to contain considerably more autophagic vacuoles and expressed higher levels of autophagy-associated molecules (e.g. LC-3II and Beclin 1, Fig. 3) compared to their parental cells. More importantly, blocking autophagy by either down-regulating an autophagy-associated gene or by a specific inhibitor (Fig. 4) sensitized EPI-R cells to EPI. These findings are consistent with an earlier study, where the sh-BECN1-mediated inhibition of autophagy was shown to enhance the sensitivity of tumor cells to tamoxifen [13]. We further show that autophagy was decreased when P-gp was down-regulated (Fig. 3), and that EPI-R cells transfected with sh-MDR1-3 to block P-gp were also treated with CQ to block autophagy, they were more sensitized to EPI than either sh-MDR1-3 transfection or CQ treatment alone (Fig. 4). These results suggest that P-gp overexpression induces autophagy, but the two pathways also act independently in making MDA cells resistant to EPI. Consistent with our observation, P-gp has previously been shown to mediate autophagy and cell-cycle arrest induced by celecoxib in human MDR overexpressing hepatocellular carcinoma cells by the down-regulation of the HGF/MET autocrine loop [35].
As a process of lysosome-dependent metabolic degradation of cellular waste, autophagy is expected to increase in cancer cells that have a high turnover rate. However, how autophagy confers EPI resistance remains poorly understood. Our results suggest that autophagy induces EPI resistance at least in part by blocking pro-apoptotic NF-κB signal in EPI-R cells. We show that enhanced autophagy is associated with reductions in caspase 3 cleavage, P65 phosphorylation and the BAX-to-BCL2 ratio (Fig. 5). Furthermore, the suppression of autophagy by either gene knockdown or a specific inhibitor significantly increased NF-κB signal (Fig. 5). The rate of apoptosis was significantly increased for CQ treated EPI-R cells and this increase was blocked by PDTC (Fig. 6A). Together, these results demonstrate that autophagy induces EPI resistance by blocking the pro-apoptotic NF-κB pathway, which has been shown to be constitutively activated in ER-negative breast cancer cells [36]. The putative interactions among the P-gp transporter, autophagy and the NF-κB pathway are schematically illustrated in Fig. 7. Consistent with this paradigm, autophagy is reported to be involved in several NF-κB regulated cellular functions, including cell survival, differentiation, senescence, inflammation and immunity [37]. This paradigm is also supported by early studies conducted on MDA cells [38,39], but differs from the reported anti-apoptotic activity of the NF-κB pathway [40].
Figure 7. A schematic summary of the findings in the study.

The results suggest that P-gp overexpression not only increases EPI efflux, but also increases Beclin 1 expression and induces autophagy in EPI-R cells. The enhanced autophagy inactivates the NF-κB pathway through multiple targets to reduce apoptosis. This P-gp-autophagy-NF-κB pathway of inducing EPI resistance is defined by red arrows (as compared to effect of EPI on genomic DNA defined by black arrows). Key questions to this model are: 1) how is enhanced autophagy induced and role of P-gp in the process (red dot line) and 2) how does enhanced autophagy inhibit NF-κB pathway (blue dot line)?
In conclusion, we have shown that enhanced autophagy causes MDA cells to become resistant to EPI. This enhancement is propagated by the up-regulation of ATP-binding cassette transporters and leads to the down-regulation of the NF-κB pathway. Autophagy inactivates the NF-κB signal pathway, thereby reducing the rate of apoptosis to increase EPI resistance. These results suggest that blocking P-gp overexpression and autophagy may synergistically sensitize TNBC to EPI and other anthracyclines.
Supplementary Material
Acknowledgments
This research work was supported by National Science Foundation of China grant 81372575 (ML), Science and Technology Support Program of Gansu Province grant 1204FKCA172 (ML), the Program for Changjiang Scholars and Innovative Research Team in University grant IRT1137 (ML), the Fundamental Research Funds for the Central Universities grant lzujbky-2015-162 (CYW) and the National Institute of Health grants HL71895 and HL085769 (JFD).
Abbreviations
- ABC transporter
ATP-binding cassette transporter
- ADM
Adriamycin
- BCL2
B-cell CLL/lymphoma 2
- BCRP
breast cancer resistance protein
- BECN1
Beclin 1
- CQ
chloroquine
- EPI
epirubicin
- EPI-R cell
EPI-resistant MDA-MB-231 cell
- ER
estrogen receptor
- FBS
fetal bovine serum
- FCM
flow cytometry
- GST
glutathione transferase
- HER2
human epidermal growth factor receptor 2
- MAP1-LC3 or LC3
microtubule-associated protein 1 light chain 3
- MDA cell
MDA-MB-231 cell
- MDC
monodansylcadaverine
- MRP1
multidrug resistance-associated protein 1
- MTT
3-(4,5-dimethyl-2-thiazolyl)-2,5-diphenyl-2-H-tetrazolium bromide
- NF-κB
nuclear factor kappa-light-chain-enhancer of activated B cells
- PBS
phosphate-buffered saline
- PDTC
ammonium pyrrolidinedithiocarbamate
- P-gp
P-glycoprotein
- PR
progesterone receptor
- PVDF
polyvinylidene fluoride
- qRT-PCR
quantitative real-time PCR
- Rh123
rhodamine 123
- RI
resistance index
- RT-PCR
reverse transcription PCR
- SDS
sodium dodecyl sulfate
- SDS-PAGE
SDS-polyacrylamide gel electrophoresis
- TBST
Tris-buffered saline-Tween 20
- TEM
transmission electron microscopy
- TNBC
triple negative breast cancer
Footnotes
The MDA-MB-231/EPI cell line used in this study was patented in accordance with Goub Company Ltd., Beijing, China on May 4, 2014 (Case #: 201410183516.4). This cell line was preserved in China Center for Type Culture Collection (CCTCC), NO: C201439.
Conflict of Interest: the authors claim no relevant conflicts of interest.
Contributor Information
Li-han Zhang, Email: zhanglh14@lzu.edu.cn.
Ai-jun Yang, Email: yangaijun999@126.com.
Min Wang, Email: wmin@lzu.edu.cn.
Wei Liu, Email: blliuwei@163.com.
Chen-yu Wang, Email: wangcylz@126.com.
Xiao-feng Xie, Email: xiexf08@163.com.
Xu Chen, Email: chenxu19880816@126.com.
Jing-fei Dong, Email: jfdong@psbc.org.
Min Li, Email: limin@lzu.edu.cn.
References
- 1.Foulkes WD, Smith IE, Reis-Filho JS. Triple-Negative Breast Cancer. New England Journal of Medicine. 2010;363(20):1938–1948. doi: 10.1056/NEJMra1001389. [DOI] [PubMed] [Google Scholar]
- 2.Irshad S, Ellis P, Tutt A. Molecular heterogeneity of triple-negative breast cancer and its clinical implications. Curr Opin Oncol. 2011;23(6):566–577. doi: 10.1097/CCO.0b013e32834bf8ae. [DOI] [PubMed] [Google Scholar]
- 3.Carey LA. Directed therapy of subtypes of triple-negative breast cancer. Oncologist. 2010;15(Supplement 5):49–56. doi: 10.1634/theoncologist.2010-S5-49. [DOI] [PubMed] [Google Scholar]
- 4.Metzger-Filho O, Tutt A, de Azambuja E, Saini KS, Viale G, Loi S, Bradbury I, Bliss JM, Azim HA, Jr, Ellis P, Di Leo A, Baselga J, Sotiriou C, Piccart-Gebhart M. Dissecting the heterogeneity of triple-negative breast cancer. J Clin Oncol. 2012;30(15):1879–1887. doi: 10.1200/JCO.2011.38.2010. [DOI] [PubMed] [Google Scholar]
- 5.Kovalev AA, Tsvetaeva DA, Grudinskaja TV. Role of ABC-cassette transporters (MDR1, MRP1, BCRP) in the development of primary and acquired multiple drug resistance in patients with early and metastatic breast cancer. Exp Oncol. 2013;35(4):287–290. [PubMed] [Google Scholar]
- 6.Palodetto B, de Melo Campos P, Benites BD, de Lourdes Lopes Ferrari Chauffaille M, Velloso ED, Traina F, Saad ST. MDR-1 and GST polymorphisms are involved in myelodysplasia progression. Leuk Res. 2013;37(8):970–973. doi: 10.1016/j.leukres.2013.04.024. [DOI] [PubMed] [Google Scholar]
- 7.Zhu WY, Hunag YY, Liu XG, He JY, Chen DD, Zeng F, Zhou JH, Zhang YK. Prognostic evaluation of CapG, gelsolin, P-gp, GSTP1, and Topo-II proteins in non-small cell lung cancer. Anat Rec. 2012;295(2):208–214. doi: 10.1002/ar.21523. [DOI] [PubMed] [Google Scholar]
- 8.Genois M-M, Paquet ER, Laffitte M-CN, Maity R, Rodrigue A, Ouellette M, Masson J-Y. DNA Repair Pathways in Trypanosomatids: from DNA Repair to Drug Resistance. Microbiology and Molecular Biology Reviews. 2014;78(1):40–73. doi: 10.1128/mmbr.00045-13. [DOI] [PMC free article] [PubMed] [Google Scholar]
- 9.Ling X, Zhou Y, Li S-W, Yan B, Wen L. Modulation of mitochondrial permeability transition pore affects multidrug resistance in human hepatocellular carcinoma cells. Int J Biol Sci. 2010;6(7):773–783. doi: 10.7150/ijbs.6.773. [DOI] [PMC free article] [PubMed] [Google Scholar]
- 10.Louisa M, Soediro TM, Suyatna FD. In vitro Modulation of P-glycoprotein, MRP-1 and BCRP Expression by Mangiferin in Doxorubicin-Treated MCF-7 Cells. Asian Pacific Journal of Cancer Prevention. 2014;15(4):1639–1642. doi: 10.7314/apjcp.2014.15.4.1639. [DOI] [PubMed] [Google Scholar]
- 11.Kondo Y, Kanzawa T, Sawaya R, Kondo S. The role of autophagy in cancer development and response to therapy. Nat Rev Cancer. 2005;5(9):726–734. doi: 10.1038/nrc1692. [DOI] [PubMed] [Google Scholar]
- 12.Levine B, Yuan J. Autophagy in cell death: an innocent convict? Journal of Clinical Investigation. 2005;115(10):2679–2688. doi: 10.1172/JCI26390. [DOI] [PMC free article] [PubMed] [Google Scholar]
- 13.Cook KL, Shajahan AN, Warri A, Jin L, Hilakivi-Clarke LA, Clarke R. Glucose-regulated protein 78 controls cross-talk between apoptosis and autophagy to determine antiestrogen responsiveness. Cancer Res. 2012;72(13):3337–3349. doi: 10.1158/0008-5472.CAN-12-0269. [DOI] [PMC free article] [PubMed] [Google Scholar]
- 14.Vazquez-Martin A, Oliveras-Ferraros C, Menendez J. Autophagy facilitates the development of breast cancer resistance to the anti-HER2 monoclonal antibody trastuzumab. PLoS One. 2009;4(7):e6251. doi: 10.1371/journal.pone.0006251. [DOI] [PMC free article] [PubMed] [Google Scholar]
- 15.Sun WL, Chen J, Wang YP, Zheng H. Autophagy protects breast cancer cells from epirubicin-induced apoptosis and facilitates epirubicin-resistance development. Autophagy. 2011;7(9):1035–1044. doi: 10.4161/auto.7.9.16521. [DOI] [PubMed] [Google Scholar]
- 16.Cook KL, Shajahan AN, Clarke R. Autophagy and endocrine resistance in breast cancer. Expert Rev Anticancer Ther. 2011;11(8):1283–1294. doi: 10.1586/era.11.111. [DOI] [PMC free article] [PubMed] [Google Scholar]
- 17.Xie Z, Klionsky DJ. Autophagosome formation: core machinery and adaptations. Nat Cell Biol. 2007;9(10):1102–1109. doi: 10.1038/ncb1007-1102. [DOI] [PubMed] [Google Scholar]
- 18.Choi KS. Autophagy and cancer. Exp Mol Med. 2012;44:109–120. doi: 10.3858/emm.2012.44.2.033. [DOI] [PMC free article] [PubMed] [Google Scholar]
- 19.Kim S-Y, Song X, Zhang L, Bartlett DL, Lee YJ. Role of Bcl-xL/Beclin-1 in Interplay between Apoptosis and Autophagy in Oxaliplatin and Bortezomib-induced Cell Death. Biochem Pharmacol. 2014;88(2):178–188. doi: 10.1016/j.bcp.2014.01.027. [DOI] [PMC free article] [PubMed] [Google Scholar]
- 20.Geismann C, Grohmann F, Sebens S, Wirths G, Dreher A, Häsler R, Rosenstiel P, Hauser C, Egberts J, Trauzold A, Schneider G, Sipos B, Zeissig S, Schreiber S, Schäfer H, Arlt A. c-Rel is a critical mediator of NF-κB-dependent TRAIL resistance of pancreatic cancer cells. Cell Death Dis. 2014;5:e1455. doi: 10.1038/cddis.2014.417. [DOI] [PMC free article] [PubMed] [Google Scholar]
- 21.Godwin P, Baird A-M, Heavey S, Barr M, O’Byrne K, Gately KA. Targeting Nuclear Factor-kappa B to overcome resistance to chemotherapy. Frontiers in Oncology. 2013;3:120. doi: 10.3389/fonc.2013.00120. [DOI] [PMC free article] [PubMed] [Google Scholar]
- 22.Liu Yf, Yang A, Liu W, Wang C, Wang M, Zhang L, Wang D, Dong Jf, Li M. NME2 Reduces Proliferation, Migration and Invasion of Gastric Cancer Cells to Limit Metastasis. PLoS One. 2015;10(2):e0115968. doi: 10.1371/journal.pone.0115968. [DOI] [PMC free article] [PubMed] [Google Scholar]
- 23.Liu L, Zuo LF, Guo JW. Reversal of multidrug resistance by the anti-malaria drug artesunate in the esophageal cancer Eca109/ABCG2 cell line. Oncol Lett. 2013;6(5):1475–1481. doi: 10.3892/ol.2013.1545. [DOI] [PMC free article] [PubMed] [Google Scholar]
- 24.Tarasova NI, Seth R, Tarasov SG, Kosakowska-Cholody T, Hrycyna CA, Gottesman MM, Michejda CJ. Transmembrane inhibitors of P-glycoprotein, an ABC transporter. J Med Chem. 2005;48(11):3768–3775. doi: 10.1021/jm049065t. [DOI] [PubMed] [Google Scholar]
- 25.Liang XJ, Shen DW, Garfield S, Gottesman MM. Mislocalization of membrane proteins associated with multidrug resistance in cisplatin-resistant cancer cell lines. Cancer Res. 2003;63(18):5909–5916. [PubMed] [Google Scholar]
- 26.Qin Q, Xiao X, Xie Z. Effect of neferine combined with mdr-1shRNA on the expression of mdr-1/P-gp in K562/A02 cell line. Zhong Nan Da Xue Xue Bao Yi Xue Ban. 2010;35(5):445–450. doi: 10.3969/j.issn.1672-7347.2010.05.007. [DOI] [PubMed] [Google Scholar]
- 27.Tanida I, Ueno T, Kominami E. LC3 and Autophagy. Methods Mol Biol. 2008;445:77–88. doi: 10.1007/978-1-59745-157-4_4. [DOI] [PubMed] [Google Scholar]
- 28.Zhou C, Zhong W, Zhou J, Sheng F, Fang Z, Wei Y, Chen Y, Deng X, Xia B, Lin J. Monitoring autophagic flux by an improved tandem fluorescent-tagged LC3 (mTagRFP-mWasabi-LC3) reveals that high-dose rapamycin impairs autophagic flux in cancer cells. Autophagy. 2012;8(8):1215–1226. doi: 10.4161/auto.20284. [DOI] [PubMed] [Google Scholar]
- 29.Negoro K, Yamano Y, Fushimi K, Saito K, Nakatani K, Shiiba M, Yokoe H, Bukawa H, Uzawa K, Wada T. Establishment and characterization of a cisplatin-resistant cell line, KB-R, derived from oral carcinoma cell line, KB. Int J Oncol. 2007;30(6):1325–1332. doi: 10.3892/ijo.30.6.1325. [DOI] [PubMed] [Google Scholar]
- 30.Zhang X, Yashiro M, Qiu H, Nishii T, Matsuzaki T, Hirakawa K. Establishment and characterization of multidrug-resistant gastric cancer cell lines. Anticancer Research. 2010;30(3):915–921. [PubMed] [Google Scholar]
- 31.Chittaranjan S, Bortnik S, Dragowska WH, Xu J, Abeysundara N, Leung A, Go NE, DeVorkin L, Weppler SA, Gelmon K, Yapp DT, Bally MB, Gorski SM. Autophagy inhibition augments the anticancer effects of epirubicin treatment in anthracycline-sensitive and -resistant triple-negative breast cancer. Clin Cancer Res. 2014;20(12):3159–3173. doi: 10.1158/1078-0432.CCR-13-2060. [DOI] [PubMed] [Google Scholar]
- 32.Seebacher NA, Richardson DR, Jansson PJ. Glucose Modulation Induces Reactive Oxygen Species and Increases Pgp-Mediated Multidrug-Resistance to Chemotherapeutics. British journal of pharmacology. 2015 doi: 10.1111/bph.13079. [DOI] [PMC free article] [PubMed] [Google Scholar]
- 33.Zhang W, Ling V. Cell-cycle-dependent turnover of P-glycoprotein in multidrug-resistant cells. Journal of cellular physiology. 2000;184(1):17–26. doi: 10.1002/(SICI)1097-4652(200007)184:1<17::AID-JCP2>3.0.CO;2-U. [DOI] [PubMed] [Google Scholar]
- 34.Lee YK, Lin TH, Chang CF, Lo YL. Galectin-3 silencing inhibits epirubicin-induced ATP binding cassette transporters and activates the mitochondrial apoptosis pathway via beta-catenin/GSK-3beta modulation in colorectal carcinoma. PLoS One. 2013;8(11):e82478. doi: 10.1371/journal.pone.0082478. [DOI] [PMC free article] [PubMed] [Google Scholar]
- 35.Mazzanti R, Platini F, Bottini C, Fantappie O, Solazzo M, Tessitore L. Down-regulation of the HGF/MET autocrine loop induced by celecoxib and mediated by P-gp in MDR-positive human hepatocellular carcinoma cell line. Biochem Pharmacol. 2009;78(1):21–32. doi: 10.1016/j.bcp.2009.03.013. [DOI] [PubMed] [Google Scholar]
- 36.Ciucci A, Gianferretti P, Piva R, Guyot T, Snape TJ, Roberts SM, Santoro MG. Induction of apoptosis in estrogen receptor-negative breast cancer cells by natural and synthetic cyclopentenones: role of the IkappaB kinase/nuclear factor-kappaB pathway. Mol Pharmacol. 2006;70(5):1812–1821. doi: 10.1124/mol.106.025759. [DOI] [PubMed] [Google Scholar]
- 37.Trocoli A, Djavaheri-Mergny M. The complex interplay between autophagy and NF-κB signaling pathways in cancer cells. Am J Cancer Res. 2011;1(5):629–649. [PMC free article] [PubMed] [Google Scholar]
- 38.Shibata A, Nagaya T, Imai T, Funahashi H, Nakao A, Seo H. Inhibition of NF-κB activity decreases the VEGF mRNA expression in MDA-MB-231 breast cancer cells. Breast Cancer Res Treat. 2002;73(3):237–243. doi: 10.1023/a:1015872531675. [DOI] [PubMed] [Google Scholar]
- 39.Radhakrishnan SK, Kamalakaran S. Pro-apoptotic role of NF-κB: implications for cancer therapy. Biochimica et Biophysica Acta (BBA)-Reviews on Cancer. 2006;1766(1):53–62. doi: 10.1016/j.bbcan.2006.02.001. [DOI] [PubMed] [Google Scholar]
- 40.Fan C, Yang J, Engelhardt JF. Temporal pattern of NFκB activation influences apoptotic cell fate in a stimuli-dependent fashion. J Cell Sci. 2002;115(24):4843–4853. doi: 10.1242/jcs.00151. [DOI] [PubMed] [Google Scholar]
Associated Data
This section collects any data citations, data availability statements, or supplementary materials included in this article.