Abstract
In recent reports, we demonstrated coupling of excited fluorophores with thin silver or gold films resulting in directional surface plasmon-coupled emission (SPCE) through the silver film and into the glass substrate. In the present report, we describe the spectral and spatial properties of SPCE from sulforhomamine 101 in polyvinyl alcohol (PVA) films of various thicknesses on 50-nm silver films. The PVA thickness varied from about 30 to 750 nm. In thin PVA films with a thickness less than 160 nm, SPCE occurred at a single angle in the glass substrate and displayed only p polarization. As the PVA thickness increased to 300 nm, we observed SPCE at two angles, with different s or p polarization for each angle. For PVA films from 500 to 750 nm thick, we observed SPCE at three or four angles, with alternating s and p polarizations. The multiple rings of SPCE and the unusual s-polarized emission are consistent with the expected waveguide modes in the silver–PVA composite film. However, in contrast to our expectations, the average lifetimes of SPCE were not substantially changed from the PVA films. The observation of SPCE at multiple angles and with different polarization opens new opportunities for the use of SPCE to study anisotropic systems or to develop unique sensing devices.
Introduction
Surface plasmon resonance (SPR) is widely used to measure bioaffinity reactions.1–3 SPR is based on the absorption of light by thin (about 50 nm) gold films on a glass prism. Light incident on the film through the prism displays strong absorption at a specific angle of incidence known as the surface plasmon angle (θSP). When light absorption occurs, there exists an evanescent field in the air or water phase above the gold that extends about 200 nm into this distal phase. The surface plasmon angle θSP is dependent on the effective refractive index of this phase. Binding of macromolecules within the evanescent field results in small changes in the local refractive index, which can be detected by a change in θSP. The change in the refractive index is due to the mass of the biomolecules and their effect on the refractive index. As a result, SPR analysis is usually performed to detect bioaffinity reactions using unlabeled biomolecules.
The occurrence of SPR requires matching of the wave vectors of the incident light and of the surface plasmons at the gold–sample interface. Plasmons cannot be excited by illumination through water due to an inability to match the wave vectors at the gold–sample interface. Matching of the wave vectors requires illumination of the metal through a medium with a higher refractive index, typically glass.4–7 SPR only occurs for the p-polarized component of the incident light,8–12 for which it is possible to match the wave vector by changing the incidence angle. The term “p” refers to the electric vector of the incident light oriented in the plane of incidence. This polarization is also called TM because of the direction of the magnetic field. Light can also be s polarized, in which case the electric vector is perpendicular to the plane of incidence. This polarization is also called TE for the transverse electric field.
In several recent reports, we described an emissive process that seems to be related to SPR.13–16 We placed fluorophores in close proximity to 50-nm-thick silver or gold films on glass prisms. Such metal films are optically dense and appear to be nearly opaque. The fluorophores were then excited either through the air/water phase or through the glass prism and metal film. In both cases, we observed a bright emission which passed through the silver or gold film and back into the prism. Remarkably, this emission in the prism occurred only at a specific angle relative to the normal axis, that is, the emission was directional. Since the sample was symmetrical around the normal axis, the emission in the prism appeared as a cone of emission around this axis. The emission angle was consistent with the surface plasmon angle calculated for the emission wavelength. Additionally, the emission seen through the prism was completely p polarized. We refer to this phenomenon as surface plasmon-coupled emission (SPCE). We believe the directional energy is due to a near-field interaction of the excited fluorophore with the metal film, which excites surface plasmons. These plasmons then emit to yield the far-field radiation.
As we continued our studies of SPCE, we decided to examine the distance over which coupling occurs by examining fluorophores in polyvinyl alcohol (PVA) films with increasing thickness. We reasoned that the SPCE intensity would become constant when the films were thicker than the coupling distance. When the PVA films thickness exceeded 200 nm, we were surprised to observe SPCE at more than a single angle. Depending on the PVA thickness, the SPCE was observed at 2, 3, or 4 emission angles that could be s or p polarized. In the present report, we describe characterization of SPCE in PVA films ranging in thickness from 30 to 750 nm. We note that the observation of SPCE at specific angles is not an obvious result. While the fluorophores might be expected to interact with the metal film, there was no reason to expect the plasmons would display detectable emission. Our results open the possibility of using surface plasmon emission, created by excited fluorophores, for a wide range of analytical and diagnostic applications.
Materials and Methods
Sample Preparation
Quartz slides (Spectrosil I, optical flatness λ/4, Starna Cells Inc.) were coated by vapor deposition by EMF Corp. (Ithaca, NY). A 50-nm-thick layer of silver was deposited on the quartz with about a 2-nm chromium undercoat. Fluorophores were deposited on the surface by spin coating at 3000 rpm a solution of low-molecular weight PVA (MW = 13 000–23 000, Aldrich) in water. The PVA solution contained sulforhodamine 101 (S101) from Aldrich. To achieve various thicknesses of the sample layer, silvered and unsilvered slides were spin coated with 1, 2, 4, 6, 8, and 10% PVA solutions containing S101. The ratio of S101/PVA was kept constant.
Initial estimates of the PVA film thickness were made by measurements of the optical densities of S101 on the spin coated slides. The optical densities were low and not reliable when measured on the silver coated slides. Hence we measured the optical densities of samples spin coated on unsilvered quartz slides. Control experiments measuring the optical density of S101 washed off the slides showed equal amounts of S101 remaining on the quartz or silvered surfaces. By comparison of the optical densities of the spin coated slides with optical densities of films prepared by evaporation of the same PVA solutions, we estimated PVA thicknesses to be 30, 53, 101, 196, 362, and 441 nm for 1, 2, 4, 6, 8, and 10% PVA, respectively. Next, we estimated the thickness from the optical densities of solutions obtained by washing off the slides with water. We found 30, 63, 198, 502, 853, and 1187 nm for 1, 2, 4, 6, 8, and 10% PVA, respectively. However, we believe the actual thicknesses are those found from the angular SPCE distributions (below).
Fluorescence Measurements
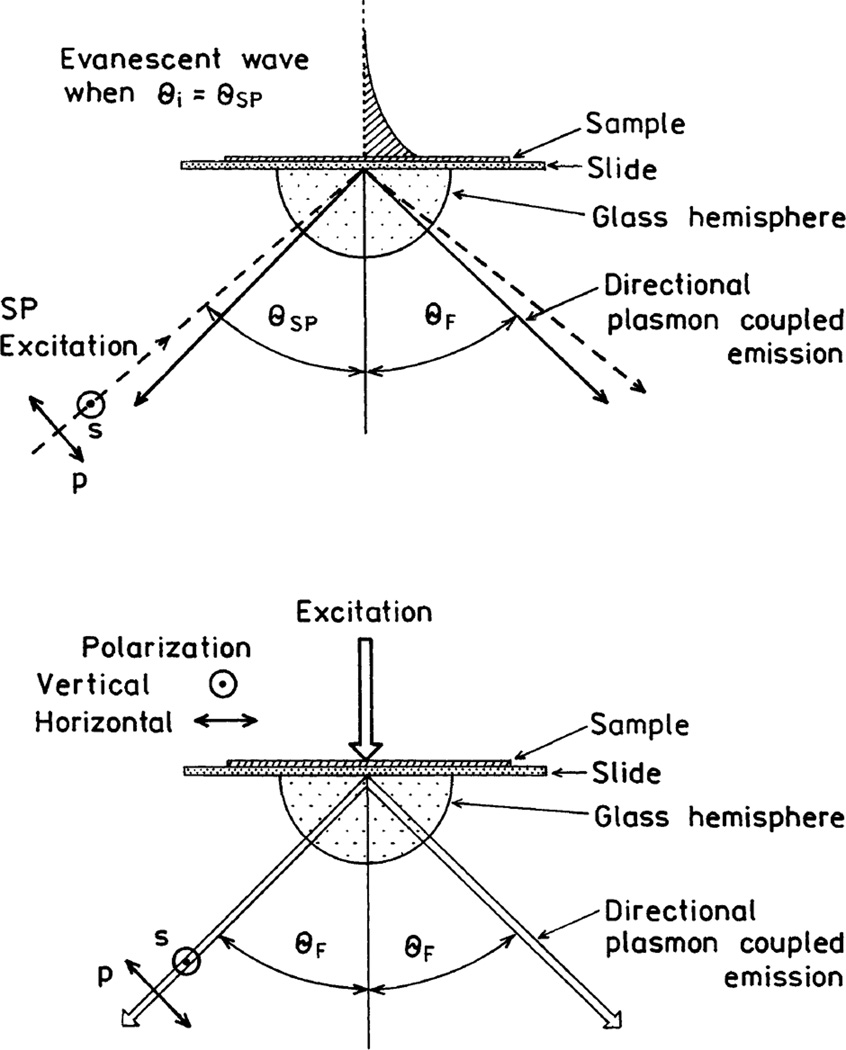
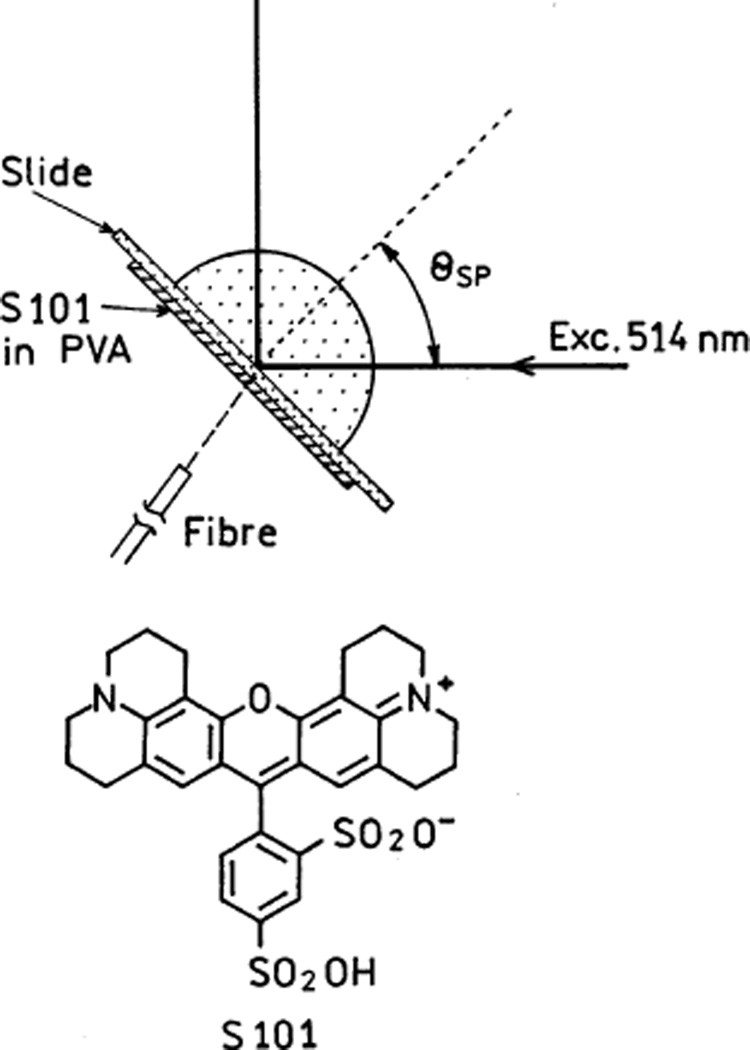
The spin-coated quartz slides (0.7 mm thick, n = 1.46) were attached to a hemi-cylindrical prism made of BK7 glass, n = 1.52 (Chart 1). The refractive indices were matched with glycerol, n = 1.475. This combined sample was positioned on a precise rotary stage which allows excitation and observation at any desired angle relative to the vertical axis around the cylinder.15 Two modes of excitation were used (Chart 1). The sample could be excited through the prism (Chart 1, top). In this case, the incident light was completely reflected at all angles except when the incident angle θI equaled the surface plasmon angle θSP. For incident angles near θSP, there exists an evanescent wave in the air–sample side, distal from the incident light. This evanescent field extends about 200 nm into the air or sample. This field is enhanced about 20-fold by the resonance interaction.17–20 This mode of illumination is called the Kretschmann (KR) configuration. The sample can also be excited from the air or sample side that has a refractive index lower than the prism. In this case, it is not possible to excite surface plasmons and the angle of incidence does not matter, but we used normal incidence (Chart 1, bottom). This is called the reverse Kretschmann (RK) configuration. Observation of the emission was performed with a 3-mm-diameter fiber bundle, covered with a 200-µm vertical slit, positioned about 15 cm from the sample. This corresponds to an acceptance angle below 0.1°.
CHART 1.
Geometries Used for SPCE Measurementsa
a Top: For SPE (Kretschmann configuration, KR). The excitation enters through the coupling prism. Bottom: In reverse Kretschmann configuration, RK. The excitation directly reaches the sample and does not excite surface plasmon.
For excitation, we used the 514-nm output of a mode-locked argon ion laser, 76 MHz repetition rate, 120 ps half width. Scattered light at 514 nm was suppressed by observation through a holographic supernotch-plus filter (Kaiser Optical System, Inc., Ann Arbor, MI). Emission intensities were observed through a long wave pass filter LWP 550 nm in addition to the notch filter. All emission spectra were recorded through the notch filter and the long pass filter. Frequency-domain intensity decays were measured with the 10-GHz instrument described earlier.21 For the photographs, we used 532-nm excitation from solid-state laser (maximum output power = 30 mW), and the samples were attached to a hemispherical prism rather than a hemi-cylinder.
The FD intensity decays were analyzed in terms of the multiexponential model
| (1) |
where τi are the lifetimes with amplitudes αi and ∑ αi = 1.0. Fitting to the multiexponential model was performed as described previously.22 For a single fluorophore that displays a multiexponential decay, the values of αi represent the molecular fractions of each component. The contribution of each component to the steady-state intensity is given by
| (2) |
where the sum in the denominator is over all the decay times and amplitudes. The mean decay time is given by
| (3) |
The amplitude-weighted lifetime is given by
| (4) |
Theory
We now describe the theory for SPR of thin films coating the metal surface. For such films, there is a single resonance at a single angle of incidence and only the p component of the incident light is absorbed. The observation of SPCE at multiple angles is best understood in terms of this model which provides a basis for comparison with the thick-film results. In the thicker PVA film, we found results consistent with optical waveguide effects. The theory for SPR in such waveguides is considerably more complex.
SPR occurs when light is incident on a thin metal film through a medium of a moderate refractive index such as glass (Chart 1, top). Light absorption by the silver film occurs when the angle of incidence (θI) equals the SPR angle for the incident wavelength (θSP). The reflectivity of the metal film is high except for a small range of angles around θSP. SPR does not occur if the light is incident on the metal from the side with a lower refractive index, typically an aqueous sample or in our case a PVA film.
Absorption by surface plasmons at a silver–sample interface occurs when the wavevector of the light incident through the prism matches the wavevector of the surface plasmon. The wavevector matching has to occur for the in-plane component of the incident wavevector. This requirement is a result of solving Maxwell’s equation for the boundary condition that the in-plane component of the electric field must be continuous across the interface. The free-space wavevector of the incident light is given by
| (5) |
where np is the refractive index of the prism, λ = λ0/np is the wavelength in the prism, λ0 is the wavelength in a vacuum, ω is the frequency in radians/s, and k0 is the wavevector or propagation constant in a vacuum. The wavevector of the incident light in plane of the silver–sample interface is given by
| (6) |
Calculation of the wavevector for the surface plasmon is more complex. The dielectric constant (ε) of a metal (m) is a complex quantity given by
| (7) |
where and the subscripts indicate the real (r) and imaginary (im) components. These constants are wavelength (frequency) dependent, but this effect is minor over the limited wavelength range of our experiments. For silver, we used εm = −14.06 + 0.45i at 600 nm and −9.0 + 0.3i at 514 nm, which represent consensus values obtained from several sources.23–25 To a first approximation, the real part of εm is determined by the conductivity of the metal, and the imaginary part of εm is due to attenuation (absorption) of the incident light. The wave vector for the surface plasmon is given by
| (8) |
where εm is the dielectric constant of the metal (m) and εs is the effective dielectric constant at the silver–sample (s) interface. Because the real part of εm is larger than the imaginary part, the wavevector can be approximated by
| (9) |
By use of the optical constants for silver εm = −9.0 + 0.3i at 514 nm,23–26 εs = 1.0 for the air, and np = 1.52 for the BK7 glass prism, one can calculate θSP = 44.14° from eq 8 and θSP = 44.25° from eq 9.
The condition for SPR absorption is satisfied when
| (10) |
Equation 10 illustrates an important property of surface plasmon resonance. For SPR to occur, the electric vector of the incident light in the metal plane needs to be modified by the angle of incidence. This only occurs if the electric vector is p polarized (Chart 1). In reality, SPR does not occur at a single angle but over a relatively narrow range of angles determined by the optical constants and resonance response of the metal.
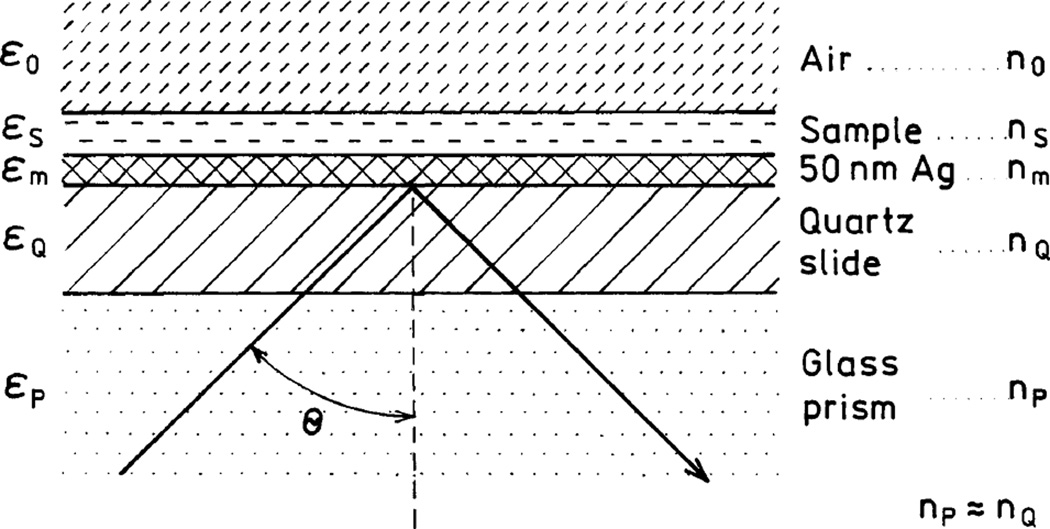
It is considerably more complex to calculate the angle-dependent reflectivity, especially if the configuration contains several layers. Such calculations can be performed using web-based software27 or commercial software such as TF Calc (Software Spectra, Inc., Portland, Oregon). We used TF Calc to calculate the reflectivity of a 4-phase configuration, which represents our experimental geometry (Chart 2). To simplify calculations, we assumed the refractive index of the prism (nP) and quartz slide (nQ) are equal. The reflectance of the multilayer system for monochromatic, linearly polarized light can be calculated from the following relationship involving the optical admittance28
| (11) |
where yQ is the admittance of the incident medium (quartz), the asterisk denotes complex conjugate, and Y is given by
| (12) |
where B and C are normalized electric and magnetic field respectively given by
| (13) |
where
| (14) |
corresponds to the phase thickness of metallic layer (m) and sample layer (s) at the appropriate angle of incidence (θ) given by Snell’s law for each interface and the wavelength (λ) and the respective substrate admittances for p and s polarizations given by
| (15) |
The indexes Q, m, s, and 0 refers to the quartz, metal film layer, sample layer, and emergent medium (air), respectively.
CHART 2.
Description of the 4-Phase System Used for Reflectivity Calculationsa
a We considered the prism (P) and quartz (Q) to represent a single phase.
Results
SPCE with RK Excitation
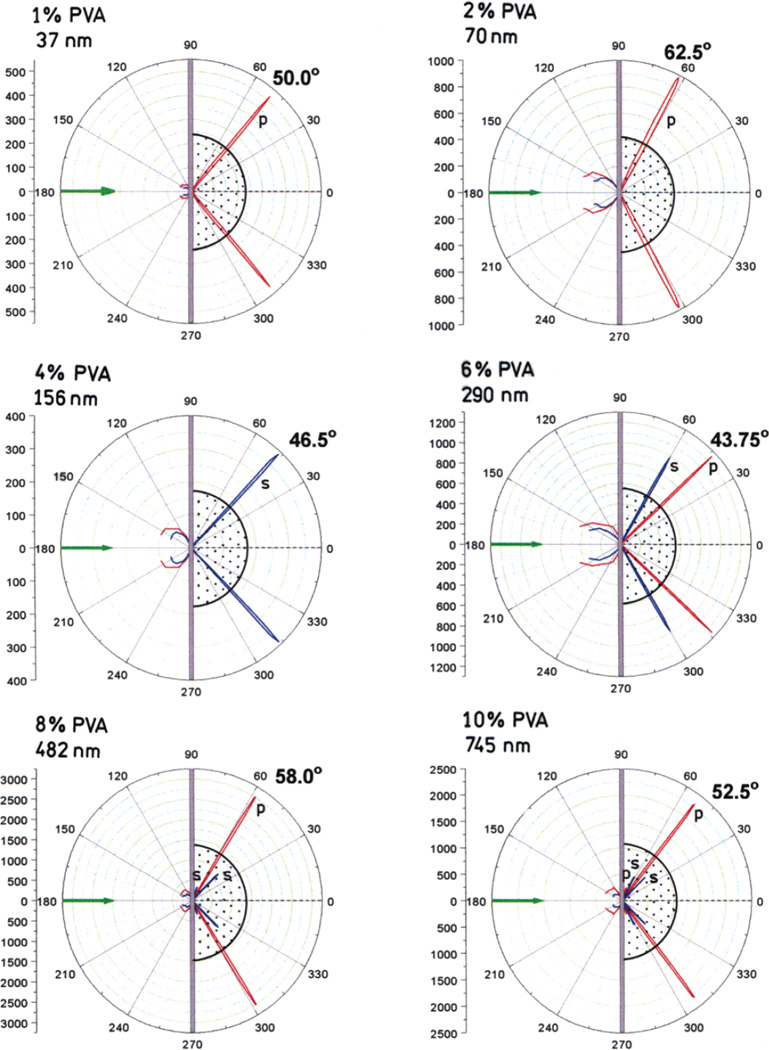
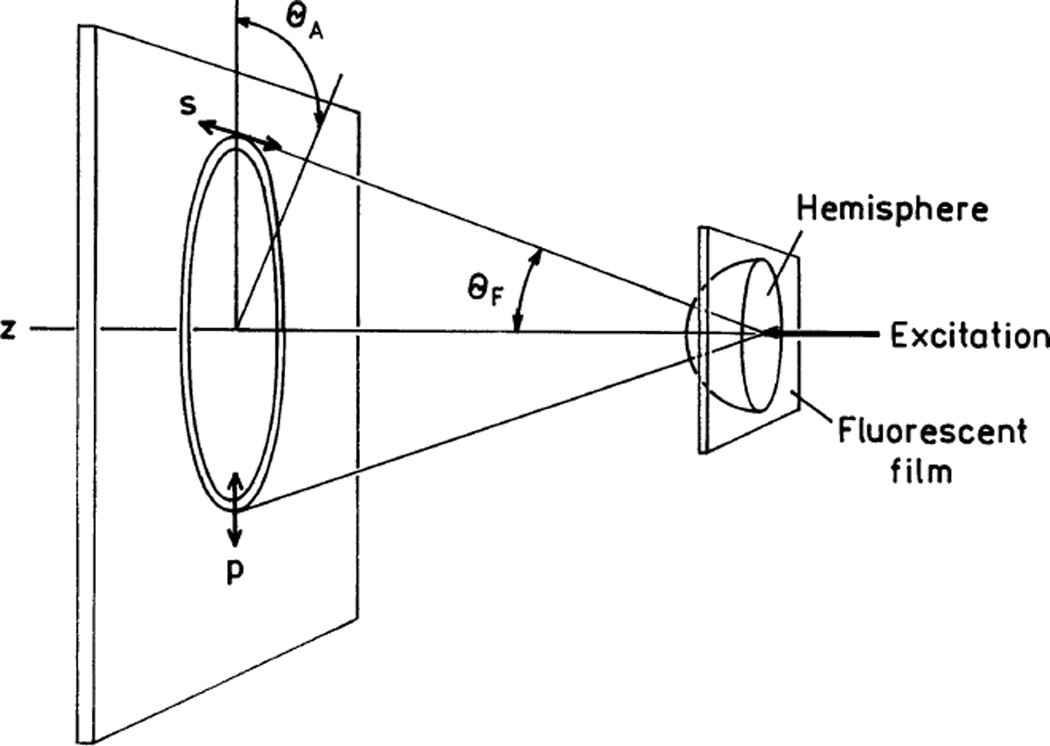
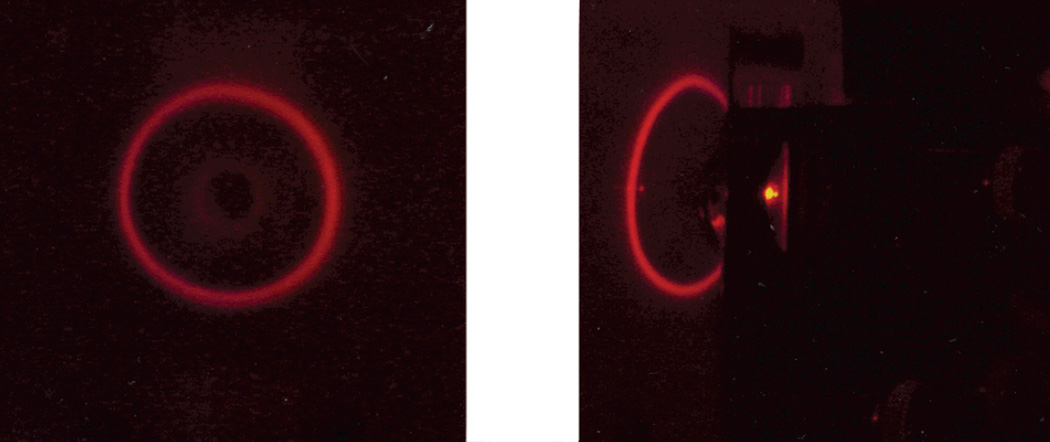
We measured the emission intensities for all accessible angle relative to the normal axis. For PVA thicknesses obtained from 1 and 2% PVA solution, we observed a single angle of maximum S101 intensity (Figure 1). The angle is larger for 2% vs 1% of PVA. This dependence is similar to that found for SPR, where the SPR angle increases when the effective dielectric constant increases. Since the occurrence of angular SPCE does not depend on the mode of excitation, there is no reason for SPCE to occur on any specific azimuthal angles (Chart 3). We examined the azimuthal distribution of SPCE by projecting the SPCE onto white tracing paper. We observed a cone of emission that was symmetric about the normal axis, as seen in the color photograph (Figure 2). Scattered excitation light was eliminated with a long pass filter. We note that the samples were excited in the RK configuration, for which the incident light cannot excite surface plasmons in the metal film. Hence the angle-dependent emission is not dependent on the surface plasmon evanescent field. At present, we believe the emission is due to surface plasmons in the metal which result from near-field coupling with the excited fluorophores. The plasmons then radiate into a glass prism at well-defined angles. This radiation is determined by the emission wavelengths of fluorophores and properties of the thin dielectrical layers and glass.
Figure 1.
Angular distribution of the S101 fluorescence emission. The thickness of the PVA varied from 37 nm to about 745 nm. See Table 1. The measurements were done in the RK configuration.
CHART 3.
Cone-of-Emission for SPCE with the RK Configuration
Figure 2.
Color photograph of the cone-of-emission for S101 in 70 nm thick PVA (2% PVA) using the RK configuration. The photograph was taken through a 570-nm long pass filter.
It should be noted that far-field fluorescence may enter the glass prism at the same angle θF. In fact, we observed this in the presence of an excessive amount of a fluorescent background where some of the emission from distal fluorophores propagated into the prism.15 For the sample thickness discussed in this manuscript, the far-field fluorescence is only a very small fraction of observed directional emission, as can be seen from the backward-to-forward ratio of emission intensity (Figure 1).
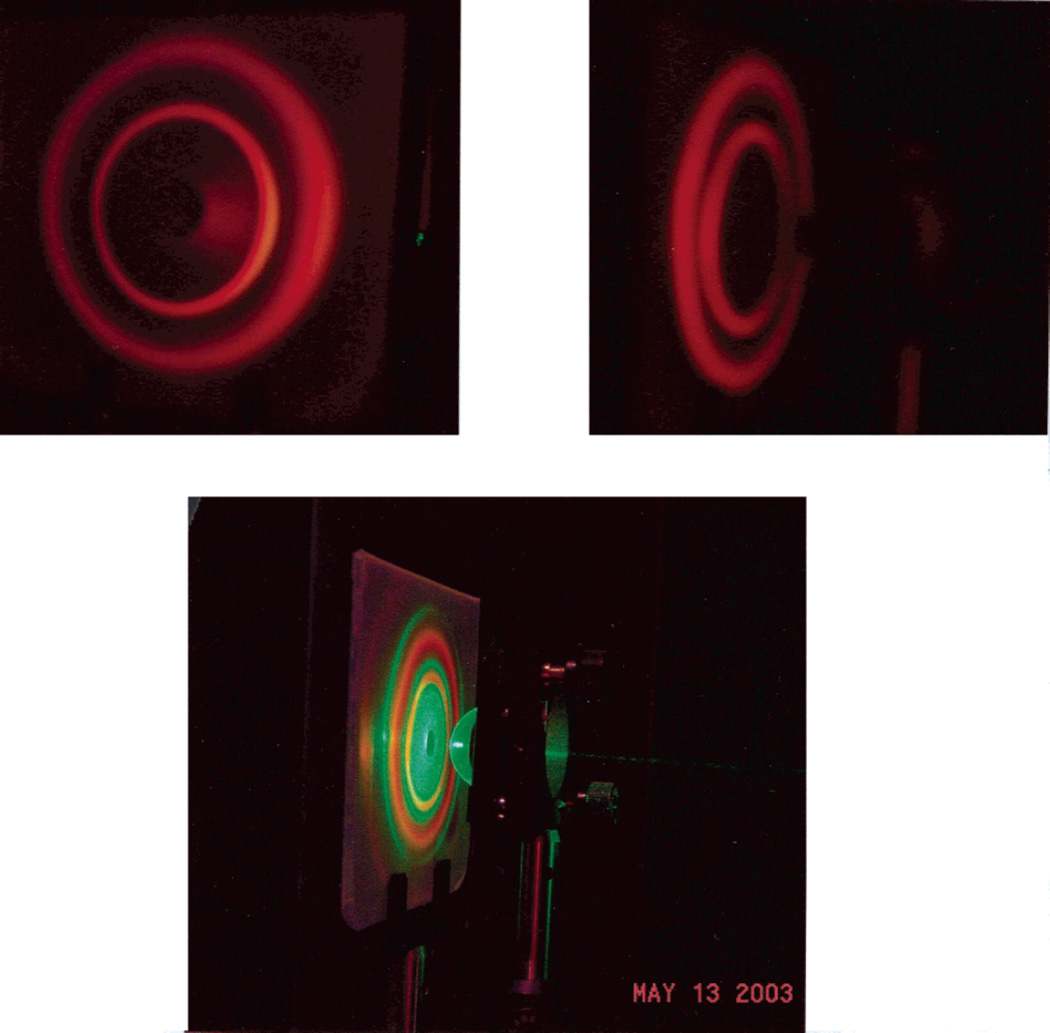
We then examined the angle-dependent SPCE with thicker layers of PVA (Figure 1). We were surprised to observe two angular SPCE maxima for a sample spin coated with 6% and three or four maxima for samples spin coated with 8 and 10% PVA, respectively. For 6% PVA, the two SPCE maxima were easily visible when projected onto paper (Figure 3). We note that the angular width of the SPCE does not depend strongly on the thickness of the PVA film. For example, the angular peaks are equally sharp for PVA samples from 1 to 10% (Figure 1). The angular width may be somewhat larger for the 2% PVA sample. The similarity for all these samples indicates that fluorophores at all distances from the metal surface result in the same SPCE angle.
Figure 3.
Color photograph of the cone-of-emission from S101 in 290-nm-thick PVA (6% PVA). Top, as observed through a 570 nm long pass filter; bottom, as observed without an emission filter.
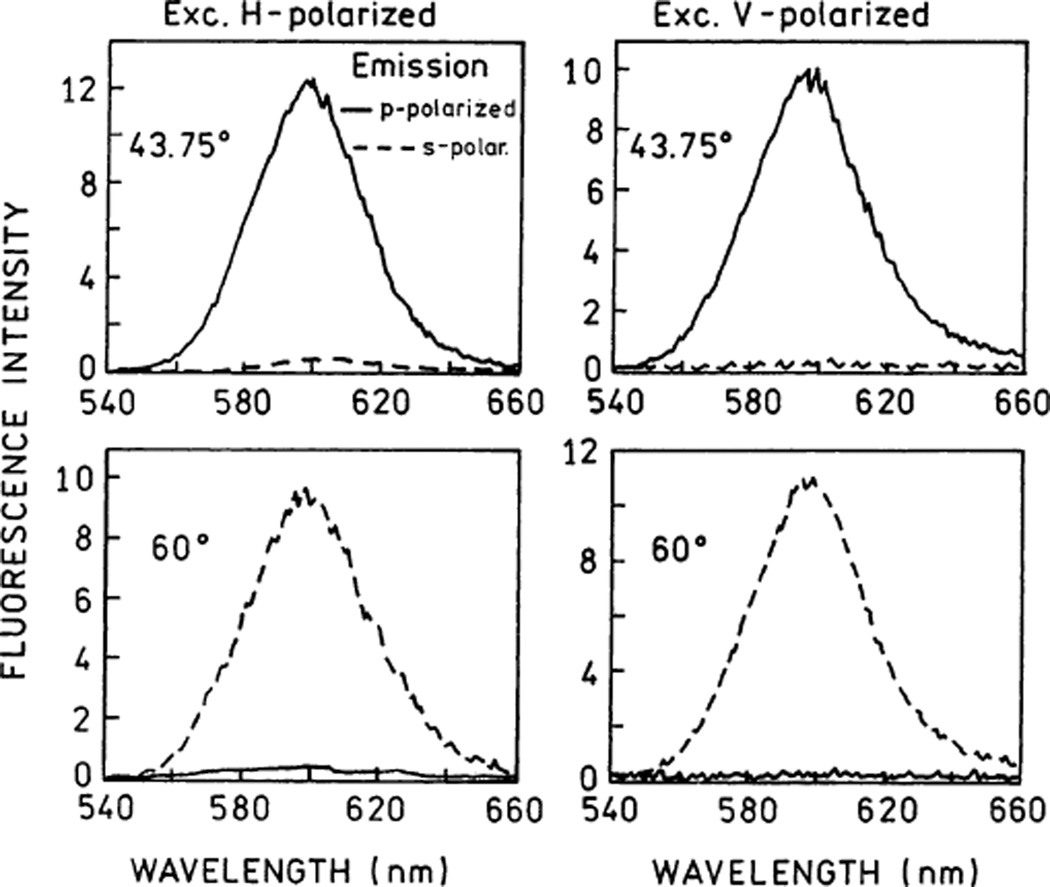
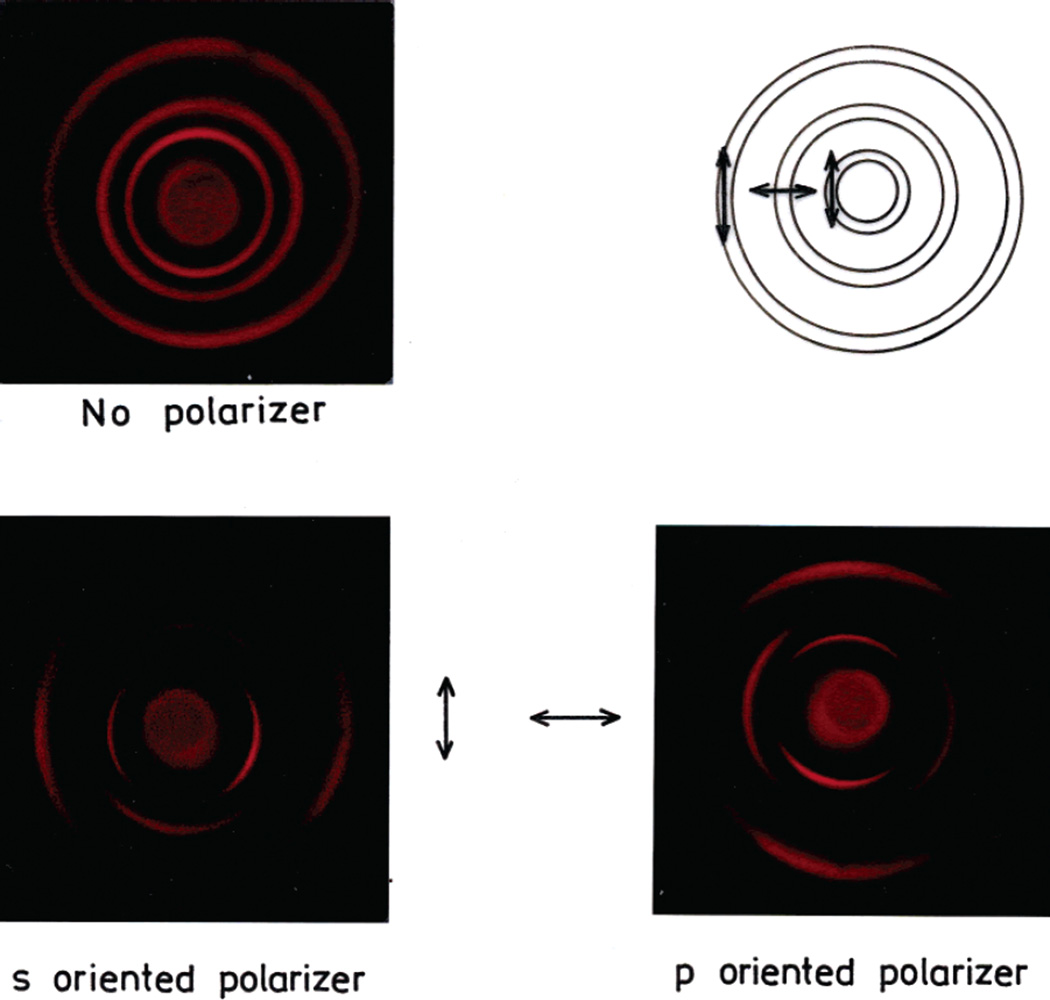
The observation of multiple SPCE rings was surprising and caused us to measure the polarization. Figure 4 shows emission spectra recorded through a polarizer oriented in the p or s position. The relative intensities of the s- and p-polarized emission did not depend significantly on the orientation of the excitation polarizer but were strongly dependent on the orientation of the emission polarizer. The two SPCE rings for the 6% PVA sample showed opposite polarizations. The 43.8° maximum was p polarized, and the 60° maximum was s polarized. For the thicker PVA film, the rings displayed alternate s and p polarization. This phenomenon is nicely visualized in photographs of the S101 emission taken without a polarizer (Figure 5, top left) or through a polarizer in the s (left) or p (right) orientation. The polarization of SPCE does not depend on the azimuthal angle (around the axis normal to the paper). For the p-polarized band (second ring ignoring the central full circle), the polarization points radially away from the center of the cone. As a result, only the sides are seen through the p polarizer (Figure 5, bottom right). The polarization of the first and third rings is tangential around the rings. Hence the top and bottom of these rings is not seen through the s polarizer (Figure 5, bottom left). The polarization of the rings is shown schematically in the top right panel.
Figure 4.
Polarized emission spectra for S101 in 6% PVA sample with the RK configuration.
Figure 5.
Cone-of-emission from S101 in about 8% PVA sample as seen through a 570-nm long pass filter. Top left, no polarizer; bottom, through a polarizer oriented vertically (s) (left) or horizontally (p) (right) as shown by the arrows; top right, scheme of polarization of the rings.
In Table 1, we summarized the SPCE angles and polarizations found for each PVA thickness. These results are interesting in that for 4% PVA only s-polarized SPCE is observed. For 6% PVA, the p-polarized ring occurs at a much smaller angle. As the PVA becomes thicker, these multiple rings display alternate s and p polarization. For some sample thickness, we found no SPCE (not shown). The relative intensities of the SPCE maxima (Table 1) show that the p-polarized rings are brighter, but both s and p rings were of comparable magnitude. We were able to obtain roughly equal intensities of the s and p rings by variations of the PVA thickness.
TABLE 1.
Optical Properties of S101 Surface Plasmon-Coupled Emission for Various Thickness of PVA
| % PVA | da (nm) | ΘF (deg) | polarization | Irel |
|---|---|---|---|---|
| 1 | 37 | 50.0 | p | 1.00 |
| 2 | 70 | 62.5 | p | 1.00 |
| 4 | 156 | 46.5 | s | 1.00 |
| 6 | 290 | 43.75 | p | 1.00 |
| 60.0 | s | 0.78 | ||
| 8 | 482 | 45.5 | s | 0.30 |
| 58.0 | p | 1.00 | ||
| 70.25 | s | 0.12 | ||
| 10 | 745 | 44.5 | s | 0.27 |
| 52.5 | p | 1.00 | ||
| 62.0 | s | 0.22 | ||
| 70.75 | p | 0.11 |
Thickness from comparison with calculated reflectivities from ref 39.
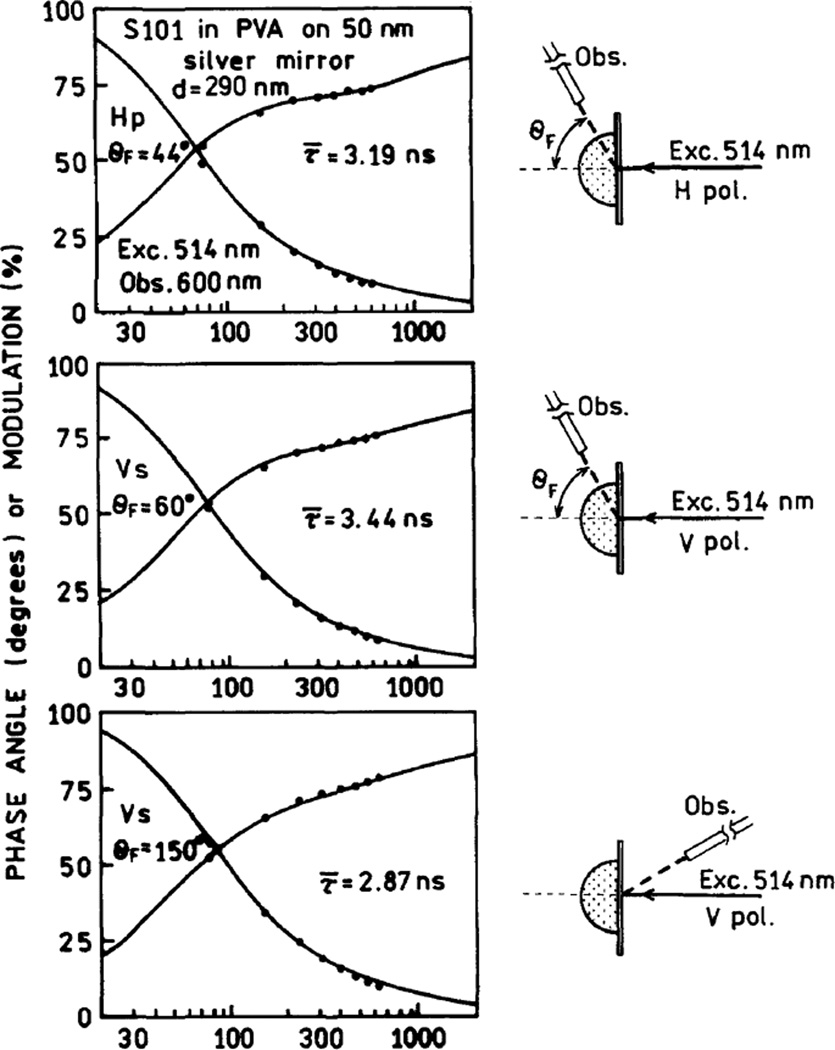
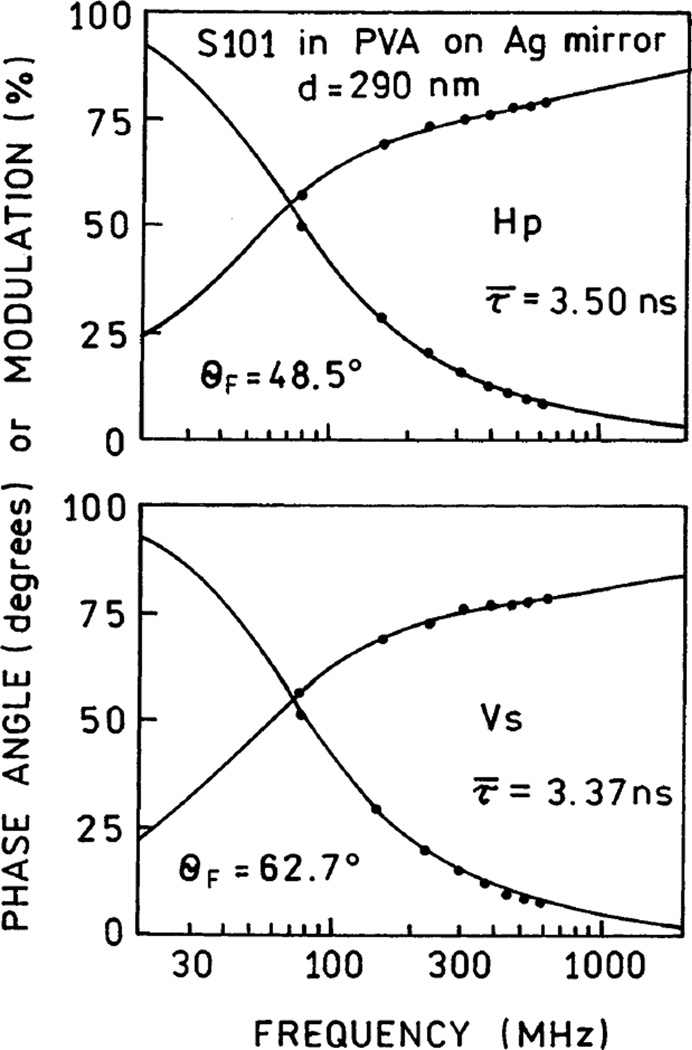
If the excited fluorophores are being deactivated by interactions with the surface plasmons, it is intuitive to expect a decrease in lifetime due to this coupling. We measured the FD intensity decays with RK excitation (Figure 6). The noncoupled free-space emission measured at 150° displayed amplitude-weighted lifetimes of 2.87–3.48 ns depending on polarization (Table 2). The SPCE lifetimes were similar to the free-space lifetimes, possibly longer, which is opposite to our expectations. At present, we do not understand why the SPCE lifetimes are not shorter than the free-space emission lifetimes.
Figure 6.
Frequency-domain intensity decay of S101 in 6% PVA sample with RK excitation. Top, p polarized at 44°; middle, s polarized at 60°; bottom, free-space emission at 150°.
TABLE 2.
Frequency-Domain Intensity Decay of S101 in 290-nm-Thick PVA on a 50-nm Silver Film
| observed angle |
excitation polarization |
observed polarization |
〈τ〉 (ns) | τ̄(ns) | α1 | f1 | τ1 (ns) | α2 | f2 | τ2 (ns) | ||
|---|---|---|---|---|---|---|---|---|---|---|---|---|
| Reverse Kretschmann Excitation | ||||||||||||
| 43.75° | H | p | 2.34 | 3.19 | 0.317 | 0.038 | 0.28 | 0.683 | 0.962 | 3.30 | 1.0 | |
| V | p | 2.98 | 3.78 | 0.261 | 0.033 | 0.37 | 0.739 | 0.967 | 3.90 | 1.1 | ||
| 60° | V | s | 2.32 | 3.44 | 0.380 | 0.043 | 0.27 | 0.620 | 0.957 | 3.58 | 1.4 | |
| H | s | 3.15 | 4.28 | 0.295 | 0.023 | 0.24 | 0.705 | 0.977 | 4.37 | 1.2 | ||
| 150° | V | p | 2.82 | 3.48 | 0.233 | 0.028 | 0.34 | 0.767 | 0.972 | 3.57 | 0.9 | |
| V | s | 2.27 | 2.87 | 0.270 | 0.041 | 0.35 | 0.730 | 0.959 | 2.98 | 0.9 | ||
| Kretschmann Excitation | ||||||||||||
| 45.5° | H, 51.5° | p | 2.72 | 3.50 | 0.268 | 0.032 | 0.33 | 0.732 | 0.968 | 3.60 | 0.9 | |
| 45.2° | V, 64.3° | p | 3.25 | 3.83 | 0.171 | 0.012 | 0.23 | 0.829 | 0.988 | 3.87 | 1.1 | |
| 60° | H, 51.5° | s | 3.26 | 3.97 | 0.200 | 0.014 | 0.23 | 0.800 | 0.986 | 4.02 | 0.9 | |
| 59.7° | V, 64.3° | s | 2.74 | 3.37 | 0.218 | 0.020 | 0.25 | 0.782 | 0.980 | 3.43 | 0.9 | |
SPCE with the KR Configuration
The Kretschmann configuration uses illumination through the prism at an angle that results in excitation of surface plasmons (Chart 1, top). Excitation of S101 is thus due to the enhanced evanescent field, which exists in the PVA film. Since the field penetrates about 200 nm, only fluorophores within 200 nm of the silver film are excited. We examined the free-space intensities of S101 measured for various angles of incidence as shown in Chart 4. The presence of the plasmon resonance can be detected by a sharp increase in the free-space emission at the excitation surface plasmon angle. For thin PVA films (<4%), we only observed significant free-space emission with p-polarized incident light (not shown). For the thicker PVA films (≥6%), a peak of S101 emission could be observed with either p- or s-polarized incident light (Figure 7). For p-polarized excitation, the peak occurred at a smaller angle of incidence than for s-polarized excitation, and the angles are about 12° apart for the 6% PVA film. This is similar to the SPCE angles, where the p angle is smaller than the s angle and the values are about 16° apart (Table 1). When one considers the difference in wavelength, the SPR and SPCE angles are nearly the same. This result shows the similarity of SPCE and SPR. The 6% PVA sample allows absorption of sor p-polarized incident light and SPCE with s or p polarization.
CHART 4.
Optical Configuration Used to Measure the Effect of θI on the Free-Space Emission from S101
Figure 7.
Free-space emission of S101 in the 6% PVA sample for various excitation incidence angles, KR configuration. Top, p polarized; bottom, s polarized.
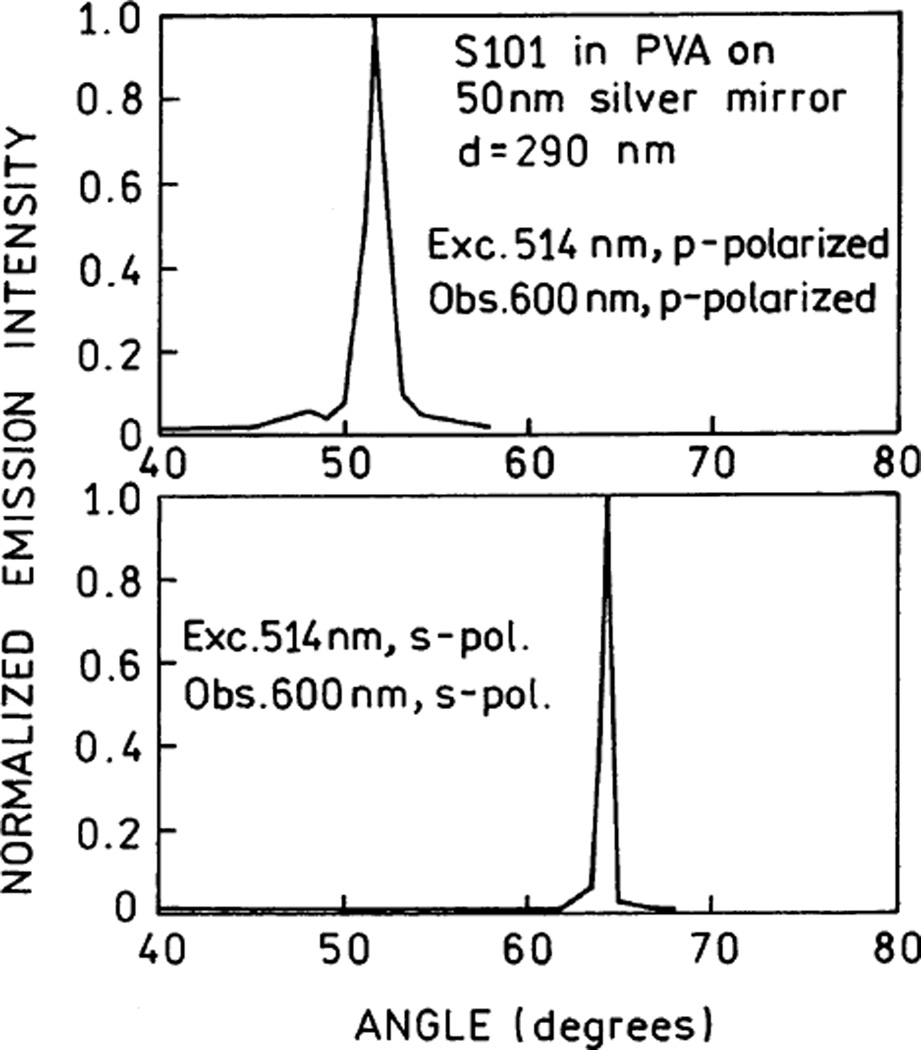
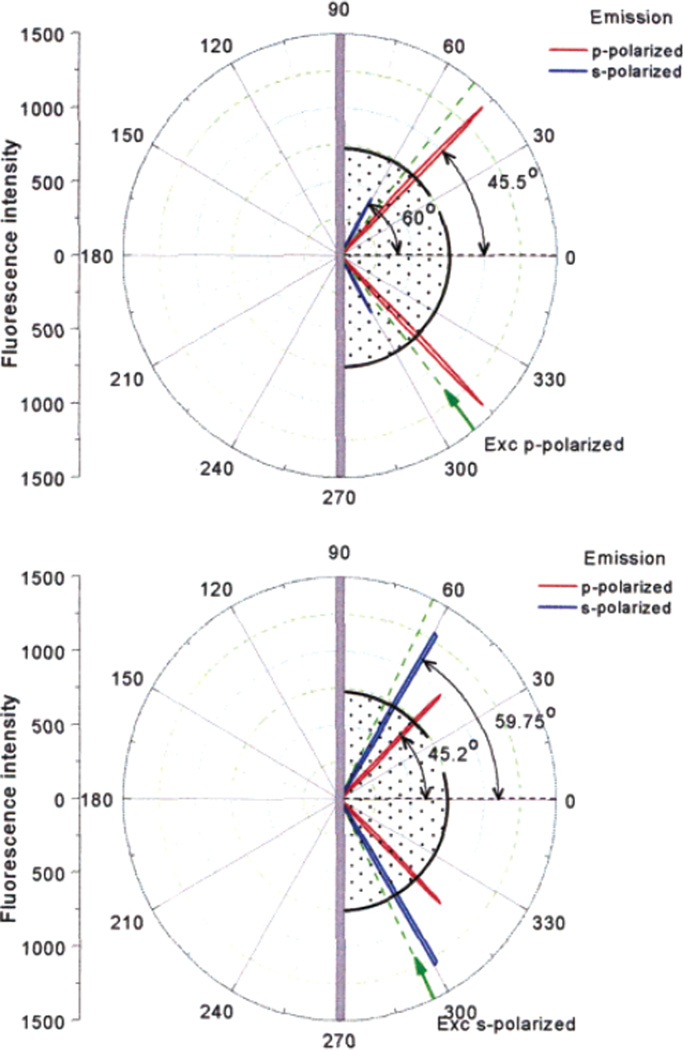
It is interesting to examine the relative SPCE intensities with KR excitation with the thick PVA film (Figure 8). We find that both s- and p-polarized SPCE is observed with p-polarized incident light at 51.5° or s-polarized incident light at 64.3°. However, higher p-polarized SPCE intensities are observed with p-polarized incident light, and higher s-polarized SPCE intensities are observed with s-polarized incident light. The complexity of this phenomenon can be seen from the angular position of the incident SPR angles, which occurs between the two SPCE maxima for p-polarized excitation and outside the two SPCE maxima for s-polarized incident light.
Figure 8.
Angular distribution of the S101 fluorescence emission measured in KR configuration. The thickness of the sample was 290 nm (6% PVA). Top, horizontally (p) polarized excitation; bottom, vertically (s) polarized excitation.
We measured the FD intensity decays with KR excitation. Any effects due to plasmon coupling should be larger than with RK excitation due to localization of the excited fluorophores near the silver film. The lifetimes were not dramatically changed from the free-space lifetimes and, if anything, are longer than the free-space lifetime (Figure 9 and Table 2). The p-polarized emission may have a slightly shorter lifetime than the s-polarized emission. This result is counterintuitive, because we expect stronger coupling with the fluorophores oriented to allow p-polarized SPCE. As stated above, we presently do not understand the linkage between SPCE and the S101 lifetimes and how the distance of the excited-state population from the silver surface varies with PVA thickness and polarization conditions.
Figure 9.
Frequency-domain intensity decays of the SPCE of S101 in the 6% PVA sample with KR excitation (Figure 8). Top, p-polarized excitation; bottom, s-polarized excitation.
We measured the relative intensities of the polarized SPCE intensities for each PVA film thickness (Table 3). The dependence on PVA thickness is complex with some thicknesses showing low intensity of one polarized component. However, there are some general features. The sum of the s- and p-polarized intensities is less variable with PVA thickness than the individual polarized intensities. The free-space emission intensities do not vary dramatically with sample thickness. The relative amounts of free-space and SPCE emission vary non-monotonically with sample thickness.
TABLE 3.
Angle-Integrated Emission Intensities with RK Excitationa
| % PVA |
d (nm) |
intensity (SPCE) |
intensity (free-space) |
I(SPCE)/ I(free-space) |
||||||
|---|---|---|---|---|---|---|---|---|---|---|
| p | s | p + s | p | s | p + s | p | s | p + s | ||
| 1 | 37 | 2534 | 127 | 2661 | 2919 | 1601 | 4520 | 0.87 | 0.08 | 0.59 |
| 2 | 70 | 5509 | 50 | 5559 | 14305 | 10674 | 24979 | 0.39 | 0.005 | 0.22 |
| 4 | 156 | 217 | 1159 | 1376 | 5921 | 4308 | 10229 | 0.04 | 0.27 | 0.14 |
| 6 | 290 | 3096 | 2767 | 5863 | 23212 | 15390 | 38602 | 0.13 | 0.18 | 0.15 |
| 8 | 482 | 10125 | 4225 | 14350 | 22291 | 15170 | 37461 | 0.45 | 0.28 | 0.38 |
| 10 | 745 | 10043 | 4343 | 14386 | 21055 | 12050 | 33105 | 0.48 | 0.36 | 0.44 |
Excitation and emission were measured with the same polarizer orientation.
What is the origin of the multiple angle SPCE peaks and the different s and p polarizations? We believe that these phenomena have their origin in addition modes which can exist with thicker dielectric films, comparable to those found in planar optical waveguides. It is known that both s (transverse electric, TE) and p (transverse magnetic, TM) modes can propagate in nonmetallic multilayer dielectric slabs because the configuration supports propagating waves with either polarization.28–30 It is also known that s- and p-polarized guided waves can propagate in thin silver films coated with a 20-µm layer of LiF.31–32 The s-polarized modes present in waveguides with a metal film are known to result in a surface plasmon resonance for s-polarized incident light. For example, 50-nm-thick silver films coated with 400-nm-thick SiO2 display decreased reflectivity of s- or p-polarized incident light, with more than a single resonance angle for each polarization.33–35 The s and p resonances occur at different angles of incidence, and the resonances are interlaced. The similarity of these observations with our own observation of multiple rings with alternating polarizations makes it almost certain that our results are due to waveguide modes that exist in silver films coated with the thicker PVA films.
To the best of our knowledge, no experimental results have been published for SPCE with thicker dielectric layers. A classic review36 shows calculations of high rates of energy transfer to the metals that were coated with thick dielectric layers. However, calculations were only presented for p modes. The authors state that similar transfer should occur for s modes, but no results are presented. The absence of published results makes it difficult to compare our observations with other theory or experiments. In principle, it is straightforward to calculate the expected results by solutions of Maxwell’s equations.37–38 In practice, it is difficult to calculate modes even for simple geometries and even more difficult to make predictions of the coupling of fluorophores with the various modes where additional considerations are needed, such as quenching, orientation effects, and the emission efficiency of the plasmons. However, reflectivity calculations for multilayer structures are available using commercial software used for the design of optical filters.39 Hence, we compared our SPCE results with the calculated reflectivity of similar structures.
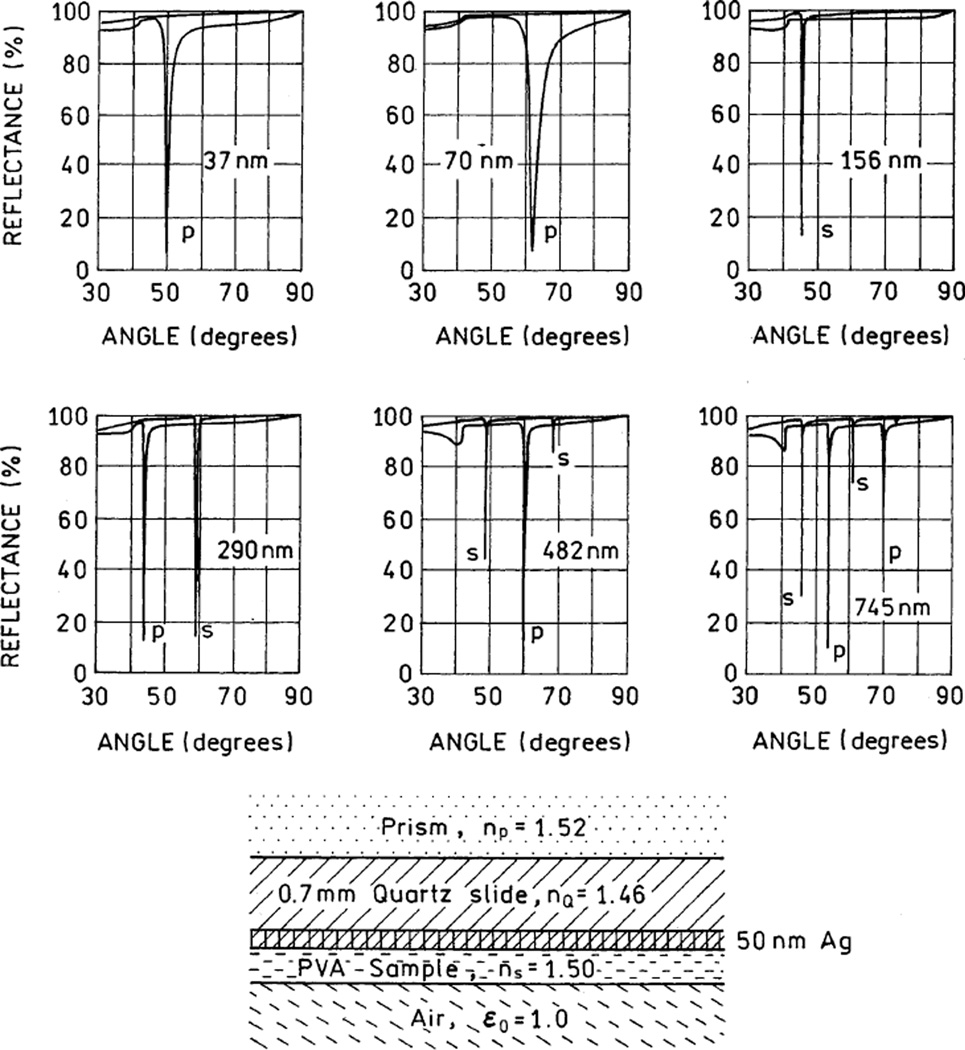
We calculated the dependence of reflectivity on the incidence angle for a five-phase system (Figure 10, bottom). We used the following parameters for calculations: a 50-nm-thick silver film (εm = −14.06 + 0.45i for 600 nm) on a 0.7-mm quartz slide (nQ = 1.46) attached to the BK7 glass prism (nP = 1.52). We assumed the silver was coated with various thicknesses of PVA with ns = 1.50. For the air phase, we used ε0 = 1.0. Reflectivity curves were calculated for 600 nm, which is the observed emission wavelength (Figure 4). Such curves can be calculated for any thickness of PVA. For the curves shown in Figure 10, we selected PVA thicknesses that showed reflectivity minima similar to those found for our 1–10% PVA samples. For thicknesses of PVA equal or less than 160 nm, we observed a single reflectivity minimum. However, the angle of minimum reflectivity changed from 62° at 70 nm PVA to 46° at 156 nm PVA. This is opposite to the usual increase in the angle of reflectivity minimum with high dielectric constants in the sample phase. Additionally, the polarization of the reflectivity minimum was s polarized at 156 nm rather than the usual p polarization for SPR or SPCE with thinner films.13–15
Figure 10.
Calculated reflectivity for various thicknesses of PVA (nS = 1.50) on 50-nm-thick silver (εm = −14.06 + 0.45i) on 0.7-mm quartz (nQ = 1.46) with light incident through a medium with np = 1.52. Bottom panel shows the five-phase system used for reflectivity calculation with TF Calc.39
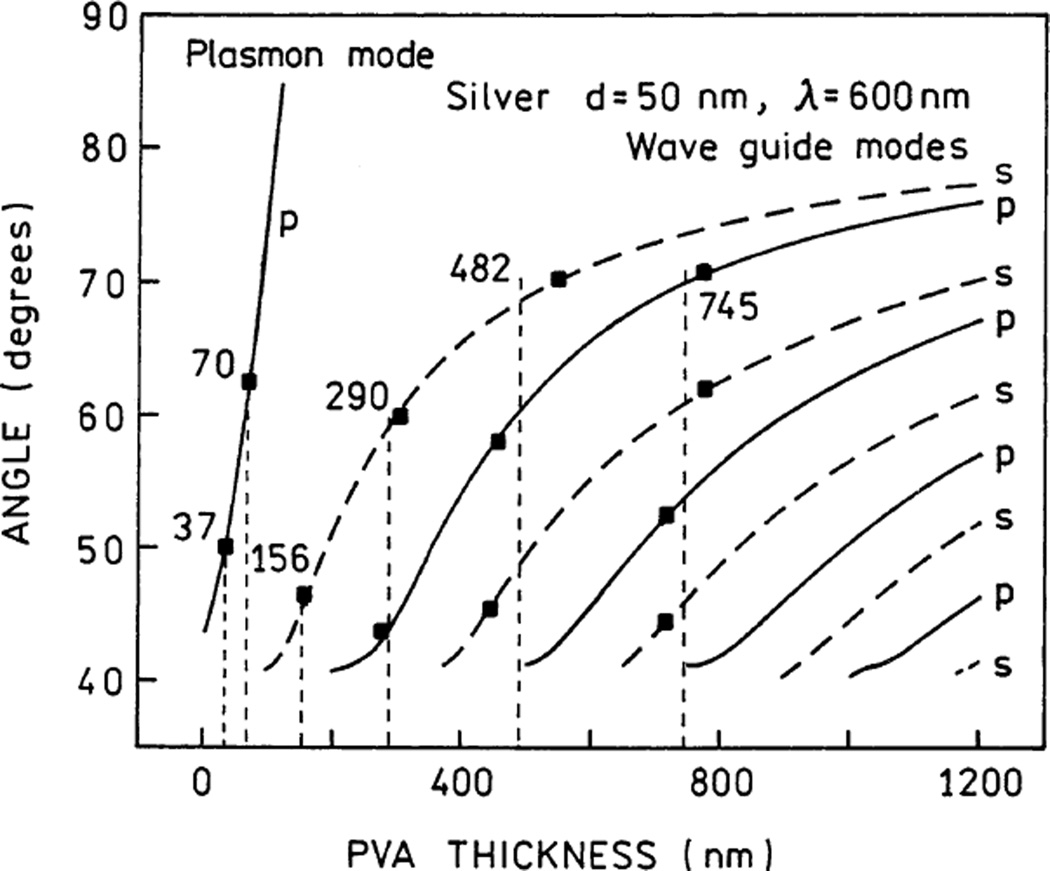
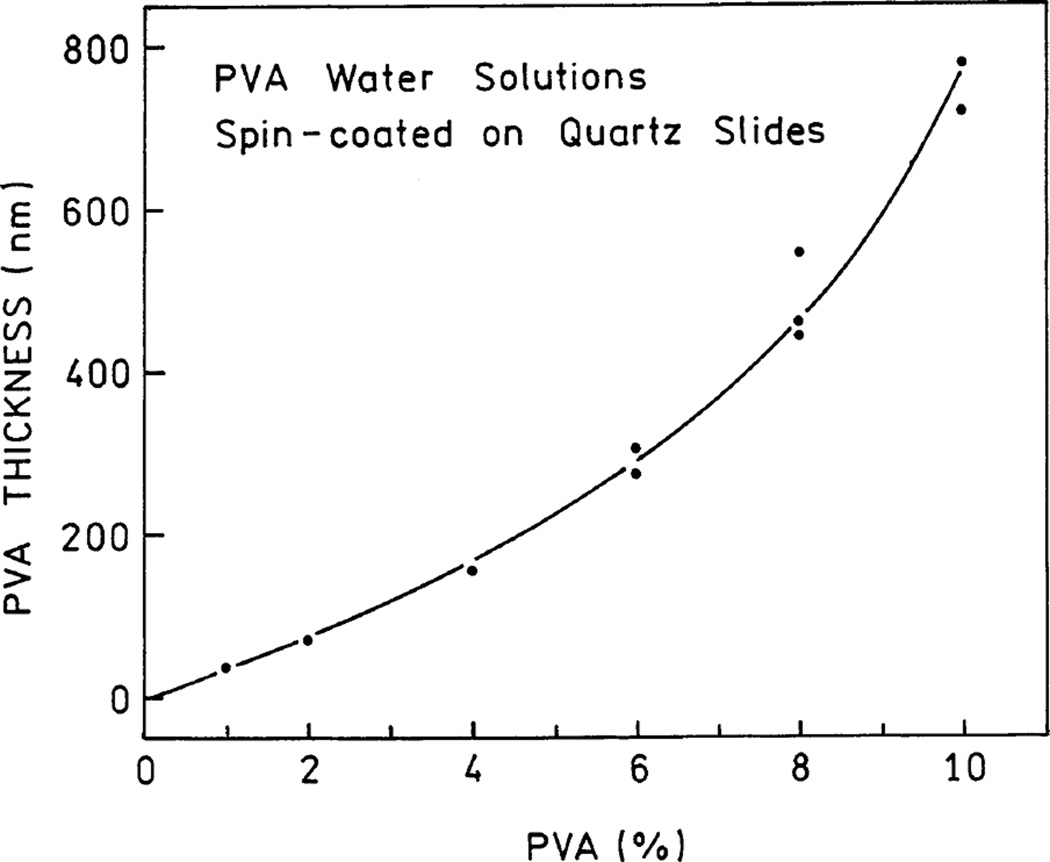
As the PVA thickness was increased, the calculated reflectivity curves showed 2, 3, and then 4 reflectivity minima (Figure 10). Also the polarization alternated from s to p. On the basis of such simulations, we varied the assumed thickness of the PVA samples to obtain a suitable match with the angles shown in Figure 1. These fits were done manually without computer minimization of deviations. These calculations are summarized in Figure 11. We found an excellent agreement between the observed and calculated angles and the polarization of the reflectivity minima. It should be noted that positions and polarizations of the minima of reflectivity are very sensitive to even small changes (nanometer range) of thickness of the sample. We believe that careful analysis of plasmon and waveguide modes can provide excellent accuracy in thickness measurements of the dielectric layer, precisely at the point of excitation. The assumed thicknesses needed to match the calculated and observed angles were roughly consistent with the expected thickness of PVA. Figure 12 shows the dependence of layer thickness on used PVA concentration. We conclude that the multiple angles and polarization of the SPCE is due to waveguide modes in the samples with PVA thickness above 100 nm.
Figure 11.
Dependence of the angle of minimum reflectance on PVA thickness calculated using TF Calc.39
Figure 12.
Thicknesses of the PVA films obtained by spin coating, as recovered from comparison with the waveguide modes using ref 39. The PVA was 13 000–23 000 MW (Aldrich), and solutions were spin-coated at 3 000 rpm on 12 × 45 mm2 quartz slides.
Discussion
It is important to recognize that the existence of a waveguide-determined SPCE is not an obvious or necessary result. The calculation of reflectivity curves for waveguides and/or thin metal films refers to absorption of far-field incident light. In contrast, the existence of SPCE depends on near-field coupling of the excited fluorophores with the metal films and/or available modes in the waveguide. Even if one could predict that such near-field coupling would occur, there was no reason to believe that significant SPCE would occur. Coupling to the metal or waveguide modes could have resulted in quenching without useful emission. In fact, early studies of plasmon emission due to electron bombardment indicated that plasmon emission was very weak, just 1 per 1000 incident electrons.40 Additionally, the fluorophores are present at all distances within the dielectric part of the waveguide. Prior to our experiments, it was not clear that SPCE at angles consistent with waveguide theory would occur with such near-field coupling over a range of fluorophore-to-metal distances, all resulting in the same SPCE angles.
We believe the existence of SPCE related to waveguide modes offers numerous advantages for both the study of SPCE itself and for its use in sensing devices. The comparison of experimental data with layered structures is facilitated by the availability of software packages to design optical filters. The angles and polarization of SPCE is strongly dependent on the thickness of the dielectric layer above the silver, which allows determination of the film thickness and/or optical constants from the SPCE pattern. With regard to biochemical studies, one can expect oriented systems such as lipid bilayers or Langmuir–Blodgett films to display SPCE patterns that depend on both the film thickness and the orientation of the fluorophores relative to the metal surface.
The existence of waveguide modes in SPCE will also be valuable for sensing applications. For example, suppose an analyte partitions into a polymer film on the surface of the metal. The change in film thickness and/or refractive index will result in changing SPCE patterns, and our simulations have shown the depth of the reflectivity minima to be highly sensitive to such changes. And finally, the SPCE can be observed with an imaging detector with no moving parts, which will allow development of portable devices.
Acknowledgments
This work was supported by the National Center for Research Resources, RR-08119, and the National Institute of Biomedical Imaging and Bioengineering, EB-00682 and EB-00981.
References and Notes
- 1.Salamon Z, Macleod HA, Tollin G. Surface Plasmon Resonance Spectroscopy as a Tool for Investigating the Biochemical and Biophysical Properties of Membrane Protein Systems. I: Theoretical Principles. Biochim. Biophys. Acta. 1997;1331:117–129. doi: 10.1016/s0304-4157(97)00004-x. [DOI] [PubMed] [Google Scholar]
- 2.Melendez J, Carr R, Bartholomew DU, Kukanskis K, Elkind J, Yee S, Furlong C, Woodbury R. A Commercial Solution for Surface Plasmon Sensing. Sensors Actuators B. 1996;35–36:212–216. [Google Scholar]
- 3.Liedberg B, Lundstrom I. Principles of Biosensing with an Extended Coupling Matrix and Surface Plasmon Resonance. Sensors Actuators B. 1993;11:63–72. [Google Scholar]
- 4.Forstmann F, Gerhardts RR. Metal Optics Near the Plasma Frequency. New York: Springer-Verlag; 1986. p. 132. [Google Scholar]
- 5.Natan MJ, Lyon LA. Surface Plasmon Resonance Biosensing with Colloidal Au Amplification. In: Feldheim DL, Foss CA, editors. Metal Nanoparticles. Synthesis, Characterization, and Applications. New York: Marcel Dekker; 2002. p. 38. [Google Scholar]
- 6.Jordan CE, Frey BL, Kornguth S, Corn RM. Characterization of Poly-l-lysine Adsorption onto Alkanethiol-Modified Gold Surfaces with Polarization-Modulation Fourier Transform Infrared Spectroscopy and Surface Plasmon Resonance Measurements. Langmuir. 1994;10:3642–3648. [Google Scholar]
- 7.Frey BL, Jordan CE, Kornguth S, Corn RM. Control of the Specific Adsorption of Proteins onto Gold Surfaces with Poly(l-lysine) Monolayers. Anal. Chem. 1995;67:4452–4457. [Google Scholar]
- 8.Holst K, Raether H. The Influence of Thin Surface Films on the Plasma Resonance Emission. Optics Commun. 1970;2(7):312–316. [Google Scholar]
- 9.Kovacs GJ, Scott GD. Optical Excitation of Surface Plasma Waves in Layered Media. Phys. Rev. B. 1977;16(4):1297–1311. [Google Scholar]
- 10.Hanken DG, Jordan CE, Frey BL, Corn RM. Electroanalytical Chemistry: A Series of Advances. New York: Marcel Dekker; 1998. Surface Plasmon Resonance Measurements of Ultrathin Organic Films at Electrode Surfaces; pp. 141–225. [Google Scholar]
- 11.Abeles F, Lopez-Rios T. Decoupled Optical Excitation of Surface Plasmons at the Two Surfaces of a Thin Film. Optics Commun. 1974;11(1):89–92. [Google Scholar]
- 12.Swalen JD. Optical Wave Spectroscopy of Molecules at Surfaces. J. Phys. Chem. 1979;83(11):1438–1445. [Google Scholar]
- 13.Lakowicz JR, Malicka J, Gryczynski I, Gryczynski Z. Directional Surface Plasmon-Coupled Emission: A New Method for High Sensitivity Detection. Biochem. Biophys. Res. Commun. 2003;307:435–439. doi: 10.1016/S0006-291X(03)01214-2. [DOI] [PMC free article] [PubMed] [Google Scholar]
- 14.Lakowicz JR. Radiative Decay Engineering 3. Surface Plasmon-Coupled Directional Emission. Anal. Biochem. 2004;324:153–169. doi: 10.1016/j.ab.2003.09.039. [DOI] [PMC free article] [PubMed] [Google Scholar]
- 15.Gryczynski I, Malicka J, Gryczynski Z, Lakowicz JR. Radiative Decay Engineering 4. Experimental Studies of Surface Plasmon-Coupled Directional Emission. Anal. Biochem. 2004;324:170–182. doi: 10.1016/j.ab.2003.09.036. [DOI] [PMC free article] [PubMed] [Google Scholar]
- 16.Gryczynski I, Malicka J, Gryczynski Z, Lakowicz JR. Surface Plasmon Coupled Emission Using Gold Films. J. Phys. Chem. B. doi: 10.1021/jp040221h. in press. [DOI] [PMC free article] [PubMed] [Google Scholar]
- 17.Kurihara K, Suzuki K. Theoretical Understanding of an Absorption-Based Surface Plasmon Resonance Sensor Based on Kretschmann’s Theory. Anal. Chem. 2002;74:696–701. doi: 10.1021/ac010820+. [DOI] [PubMed] [Google Scholar]
- 18.Salomon Z, Macleod HA, Tollin G. Surface Plasmon Resonance Spectroscopy as a Tool for Investigating the Biochemical and Biophysical Properties of Membrane Protein Systems. I: Theoretical Principles. Biochim. Biophys. Acta. 1997;1331:117–129. doi: 10.1016/s0304-4157(97)00004-x. [DOI] [PubMed] [Google Scholar]
- 19.Neumann T, Johansson ML, Kambhampati D, Knoll W. Surface-Plasmon Fluorescence Spectroscopy. Adv. Funct. Mater. 2002;12:9-575–9-586. [Google Scholar]
- 20.Liebermann T, Knoll W. Surface-Plasmon Filed-Enhanced Fluorescence Spectroscopy. Colloids Surfaces. 2000;171:115–130. [Google Scholar]
- 21.Laczko G, Lakowicz JR, Gryczynski I, Gryczynski Z, Malak H. A 10-GHz Frequency Domain Fluorometer. Rev. Sci. Instrum. 1990;61:233–237. [Google Scholar]
- 22.Lakowicz JR. Principles of Fluorescence Spectroscopy. 2nd. New York: Kluwer Academic/Plenum Press; 1990. p. 698. [Google Scholar]
- 23.Weber WH, McCarthy SL. Surface-Plasmon Resonance as a Sensitive Optical Probe of Metal-Film Properties. Phys. Rev. B. 1975;12(12):5643–5650. [Google Scholar]
- 24.Palik ED, editor. Handbook of Optical Constants of Solids. New York: Academic Press; 1985. p. 804. [Google Scholar]
- 25.Johnson PB, Christy RW. Optical Constants of the Noble Metals. Phys. Rev. B. 1972;6(12):4370–4379. [Google Scholar]
- 26.Shu QQ, Hansma PK. Fluorescent Apparent Quantum Yields for Excited Molecules near Dielectric Interfaces. Thin Solid Films. 2001;384:76–84. [Google Scholar]
- 27.Nelson BP, Frutos AG, Brockman JM, Corn RM. Near-Infrared Surface Plasmon Resonance Measurements of Ultrathin Films. 1. Angle Shift and SPR Imaging Experiments. Anal. Chem. 1999;71:3928–3934. [Google Scholar]
- 28.Macleod HA. Thin-Film Optical Filters. Philadelphia: Institute of Physics Publishing; 2001. p. 641. [Google Scholar]
- 29.Okamoto K. Fundamentals of Optical Waveguides. New York: Academic Press; 2000. p. 428. [Google Scholar]
- 30.Alferness RC, Burns WK, Donnelly JF, Kaminow IP, Kogelnik H, Leonberger FJ, Milton AF, Tamir T, Tucker RS. In: Guided-Wave Optoelectronics. Tamir T, editor. New York: Springer-Verlag; 1988. p. 401. [Google Scholar]
- 31.Raether H. Surface Plasma Oscillations and Their Applications. In: Hass G, Francombe MH, Hoffman RW, editors. Physics of Thin Films, Advances in Research and Development. Vol. 9. New York: Academic Press; 1977. pp. 145–261. [Google Scholar]
- 32.Raether H. Surface Plasmons on Smooth and Rough Surfaces and on Gratings. New York: Springer-Verlag; 1988. p. 136. [Google Scholar]
- 33.Salamon Z, Macleod HA, Tollin G. Coupled Plasmon-Waveguide Resonators: A New Spectroscopic Tool for Probing Proteolipid Film Structure and Properties. Biophys. J. 1997;73:2791–2797. doi: 10.1016/S0006-3495(97)78308-5. [DOI] [PMC free article] [PubMed] [Google Scholar]
- 34.Salamon Z, Lindblom G, Rilfors L, Linde K, Tollin G. Interaction of Phosphatidylserine Synthase from e. coli with Lipid Bilayers: Coupled Plasmon-Waveguide Resonance Spectroscopy Studies. Biophys. J. 2000;78:1400–1412. doi: 10.1016/S0006-3495(00)76693-8. [DOI] [PMC free article] [PubMed] [Google Scholar]
- 35.Salamon Z, Tollin G. Optical Anistropy in Lipid Bilayer Membranes: Coupled Plasmon-Waveguide Resonance Measurements of Molecular Orientation, Polarizability, and Shape. Biophys. J. 2001;80:1557–1567. doi: 10.1016/S0006-3495(01)76128-0. [DOI] [PMC free article] [PubMed] [Google Scholar]
- 36.Ford GW, Weber WH. Electromagnetic Interactions of Molecules with Metal Surfaces. Phys. Rep. 1984;113(4):195–287. [Google Scholar]
- 37.Born M, Wolf E. Principles of Optics Electromagnetic Theory of Propagation, Interference and Diffraction of Light. New York: Pergamon Press; 1980. p. 808. [Google Scholar]
- 38.Griffiths DJ. Introduction to Electrodynamics. New Jersey: Prentice Hall; 1999. p. 576. [Google Scholar]
- 39.TF Calc. Portland, Oregon: Software Spectra, Inc.; [Google Scholar]
- 40.Ferrel RA. Predicted Radiation of Plasma Oscillations in Metal Films. Phys. Rev. 1958;111(5):1214–1222. [Google Scholar]


