Fig. 5.

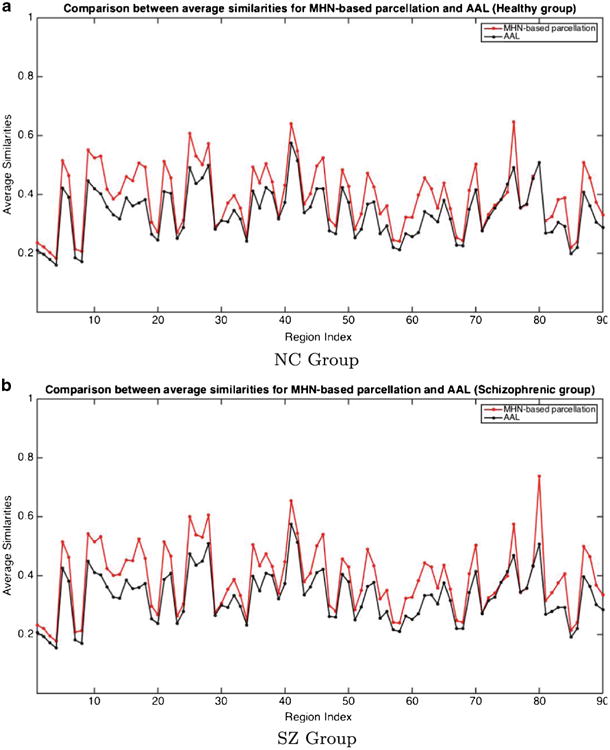
Region Connectivity Profile Similarity for NC and SZ Groups. The Similarity metric used is the average correlation between the connectivity profiles of pairs of voxels within a region

Region Connectivity Profile Similarity for NC and SZ Groups. The Similarity metric used is the average correlation between the connectivity profiles of pairs of voxels within a region