Abstract
Large-scale analysis of functional MRI data has revealed that brain regions can be grouped into stable “networks” or communities. In many instances, the communities are characterized as relatively disjoint. Although recent work indicates that brain regions may participate in multiple communities (for example, hub regions), the extent of community overlap is poorly understood. To address these issues, here we investigated large-scale brain networks based on “rest” and task human functional MRI data by employing a mixed-membership Bayesian model that allows each brain region to belong to all communities simultaneously with varying membership strengths. The approach allowed us to 1) compare the structure of disjoint and overlapping communities; 2) determine the relationship between functional diversity (how diverse is a region’s functional activation repertoire) and membership diversity (how diverse is a region’s affiliation to communities); 3) characterize overlapping community structure; 4) characterize the degree of non-modularity in brain networks; 5) study the distribution of “bridges,”, including bottleneck and hub bridges. Our findings revealed the existence of dense community overlap that was not limited to “special” hubs. Furthermore, the findings revealed important differences between community organization during rest and during specific task states. Overall, we suggest that dense overlapping communities are well suited to capture the flexible and task dependent mapping between brain regions and their functions.
Keywords: clustering, overlapping communities, networks, Bayesian methods, functional MRI
1. Introduction
Network analysis of human neuroimaging data has contributed to a view of brain function in which groups of brain regions participate in functions rather than brain function relying on just regions operating in isolation (for influential early ideas, see Mesulam 1981; Rakic et al. 1986). Functional MRI data during the so-called “resting state” has been extensively investigated in order to characterize network structure. A central finding is that, at rest, brain regions can be grouped into a relatively small number of stable communities, also called clusters or subnetworks. For example, Yeo and colleagues (Yeo et al. 2011) described a seven-community parcellation of cortical areas based on a large sample of participants. Based on anatomical and functional considerations, the communities were labelled as “visual,” “frontoparietal,” “default,” and so on.
Much of the work employing modern network methods to study brain community structure and other network measures makes the assumption that each node (that is, brain region) belongs to a single community – thus, the overall network is partitioned into disjoint sets of clusters. However, the importance of understanding and characterizing overlapping structure has been discussed for some time in many disciplines, including sociology (Wasserman and Faust 1994) and biology (Gavin et al. 2002); for example, biologists exploring protein interactions have found that a substantial fraction of proteins interact with several communities at the same time (Gavin et al. 2002). As nicely summarized by Palla and colleagues (2005, p. 814): “actual networks are made of interwoven sets of overlapping communities.”
Large-scale analysis of functional MRI data indicates that brain networks are also overlapping. This is indicated, for example, by Independent Component Analysis (ICA) and other methods that allow community overlap (Smith et al. 2012). Indeed, there is increasing realization that brain regions may belong to several brain communities simultaneously (Cocchi et al. 2013; Cole et al. 2013; Pessoa 2014; see also Hilgetag et al. 1996; Mesulam, 1998). It is still unclear, however, whether network overlap is sparse or dense (Figure 1). In the former case, some key regions work as hubs that participate flexibly in multiple communities. In this scenario, network overlap is relatively limited and may be a property mainly of specific parts of the brain (say, prefrontal cortex; see Miller and Cohen, 2001). In the latter case, network overlap is extensive and many (possibly most) brain regions participate in multiple communities. For example, Yeo et al. (2014) reported that 44% of the vertices studied (away from clustering boundaries) participated in multiple networks.
Figure 1.
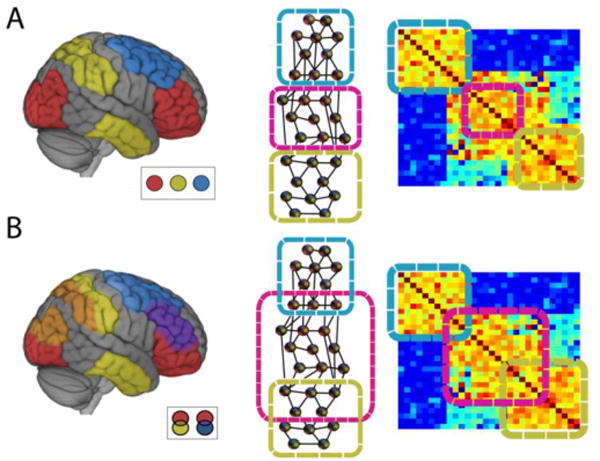
Community organization in the brain. (A) Standard communities are disjoint (inset: colors indicate separate communities), as illustrated via three types of representation. The representation on the right corresponds to a schematic correlation matrix. (B) Overlapping communities are interdigitated, such that brain regions belong to multiple communities simultaneously (inset: community overlap shown on the brain indicated by intersection colors).
One reason regions may belong to (or affiliate with) multiple communities is that they may participate in different “region assemblies” depending on task demands. Whereas evidence for regions with “flexible functional connectivity patterns” in frontal and parietal cortex has been recently described (Cole et al. 2013), the extent of such multiple-community participation, and its spatial distribution in the brain remains poorly understood. Moreover, the relationship of flexible affiliation and functional diversity (that is, the spectrum of tasks a region may participate in; see Anderson et al. 2013) is not understood.
At least since the work by Guimerà and Amaral (2005a,b) there has been increased appreciation that particularly well-connected nodes, often called hubs, can be grouped into several distinct sub-types: provincial hubs (well-connected nodes with almost all of their links within a single community), connector hubs (well-connected nodes with at least half of their links within a community), and kinless hubs (hubs with fewer than half of their links within a community). The different hub sub-types are useful for understanding the general functional organization of networks because each of the defining connectivity patterns lends itself to a “universal role” that does not depend on the type of network being studied (social, technological, or biological). By using overlapping communities, hub sub-types can be naturally defined by characterizing each node’s bridgeness (Nepusz et al. 2008), namely, the ability to participate with multiple communities simultaneously and “bridge” them together. Bridges are important because they have the potential to spread signals across multiple communities, thereby performing important roles in distributed processing.
The goals of the present study were several-fold. First, we sought to characterize the overlapping structure of brain communities during rest by using a state-of-the-art mixed-membership algorithm (Gopalan and Blei 2013; see also Airoldi et al. 2014; Airoldi et al. 2008; Lancichinetti et al. 2009). In particular, one of our goals was to quantify how much “information” is lost when large-scale networks are treated as disjoint compared to when overlapping structure is characterized. Standard, disjoint clustering assigns membership values of 0 or 1 (all or none), and in so doing dichotomizes measures that may be informative. In contrast, when overlapping structure is determined, a node’s participation is assigned across all communities, though with varying strengths; the strengths are summarized by the membership values (Figure 2). Specifically, in the framework adopted, each node has a probability-like membership value associated with each of the existing communities. This community membership vector specifies a node’s affiliation to all communities considered, with membership values between 0 and 1 (and summing to 1), with entries close to 1 indicating membership to essentially one community, and intermediate values indicating membership to multiple communities.
Figure 2.
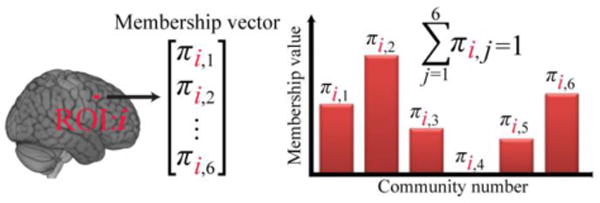
Overlapping communities and membership values. Each brain region affiliates with each community with varying strengths that are captured by the membership value. These probability-like values are between 0 and 1 and sum to 1 (for each region of interest, or ROI).
Second, we sought to investigate the relationship between functional diversity and community membership properties. Brain regions differ in terms of their functional diversity, namely, the repertoire of functions that engage them (Passingham et al. 2002; Anderson et al. 2013). Some regions are engaged by a wide variety of tasks (they have high functional diversity), whereas other regions are more narrowly tuned and are engaged by a limited range of paradigms (they have low functional diversity). Here, we asked the following question: Is functional diversity related to how brain regions affiliate with other regions in the absence of a task? In other words, is a region’s functional diversity related to its membership values? To estimate a region’s functional diversity, we employed the BrainMap database (Laird et al. 2005), which collates activation results across thousands of publications in the literature and organizes them in terms of a task taxonomy spanning perception, action, cognition, and emotion.
Third, we wished to characterize how network structure during rest is potentially altered by task execution. This is important because whereas the large-scale structure of brain networks at rest have been studied extensively, less is known about the organization during task performance. Critically, it is at times assumed that functional connectivity at rest is affected in minor ways by tasks (Cole et al. 2014). In this view, the activity covariation at rest is only mildly influenced by task execution. While some studies have indeed provided evidence in favor of this idea, an alternative proposal is that tasks alter patterns of functional connectivity more substantially (Buckner et al. 2013).
Fourth, our objective was to use the mixed-membership model to measure the “bridgeness” of each region and combine it with other network measures to extend our understanding of “universal roles” and identify key information processing nodes in the brain. Furthermore, we wished to determine how both hub and bridge properties changed during task execution relative to rest.
2. Materials and Methods
2.1 Dataset
The structural and functional MRI data for this study were obtained from the Human Connectome Project (HCP; Van Essen et al. 2013) dataset (N = 100) as accessed in June 2014. For completeness, we briefly describe the main aspects of the HCP data (for details, see Glasser et al. 2013; Smith et al. 2013; Van Essen et al. 2013).
Data were acquired on a Siemens Skyra 3T scanner using a standard 32-channel head coil. Functional data were collected using a multiband scanning protocol (multiband factor of 8) that allowed acquisition at higher temporal (TR = 720 ms; TE = 33.1 ms; FA: 52°) and spatial resolution (2 mm isotropic voxels in 72 slices; FOV= 208 × 180 mm). Here, we employed HCP’s so-called “minimally processed” functional data (Glasser et al. 2013), which included the following preprocessing steps: correction of spatial distortions, motion correction, functional to structural data alignment, bias field correction, and intensity normalization. Cortical data were mapped to the surface (using the Conte69, 32k standard mesh), and subcortical data were analyzed volumetrically. Surface data were spatially smoothed within the surface with a 2 mm kernel. For the resting-state data, HCP pipeline uses ICA to remove spatiotemporal components that purportedly corresponded to non-neural signals; the resulting data are referred to as the “ICA-fixed” dataset (Salimi-Khorshidi et al. 2014; Smith et al. 2013).
2.1.1 Resting-state data
Each run of resting-state data contained 1200 volumes (14 min and 33 s). Participants were instructed to look at a fixation crosshair for the duration of the run with their eyes open. We employed data from two runs acquired on each participants’ first visit. The only preprocessing step applied beyond the HCP ICA-fixed pipeline was to perform temporal filtering (between 0.01 and 0.08 Hz) via the 3dBandpass program of the AFNI package (Cox 1996).
2.1.2 Working memory task data
During the working memory task, participants performed an n-back memory task based on a series of centrally present pictures of places, tools, faces and non-mutilated body parts with no nudity. Participants performed two runs of the task, each of which contained four blocks of a 0-back memory task, four blocks of a 2-back memory task, and four blocks of fixation. On each trial, a stimulus was presented for 2 seconds, followed by a 500-ms interval. Here, we restricted our analysis to the 2-back condition. Each task block lasted 25 seconds; to account for the hemodynamic delay, we employed volumes from 10–25 seconds after block onset. In total, we employed 120 seconds (167 volumes) of data for each participant (2 runs × 4 blocks/run × 15 seconds/block). The only processing step applied beyond the HCP pipeline was to regress out (via the 3dDeconvolve program of the AFNI package) 12 motion-related variables: 6 motion parameters estimated from the rigid-body transformation to the reference image acquired at the beginning of the scan and their temporal derivatives (as provided with the HCP data).
2.1.3 Emotion task data
The emotion task was based on the original paradigm developed by Hariri and colleagues (2000). During each block, participants decided which of two faces (or shapes) on the screen matched the face (or shape) placed above. On each trial, stimuli appeared for two seconds followed by a one second interval. Here, we restricted our analysis to the emotion condition, during which angry or fearful faces were displayed. Each task block lasted 21 seconds; to account for the hemodynamic delay, we employed volumes from 10–21 seconds after block onset. In total, we employed 66 seconds (92 volumes) of data for each participant (2 runs × 3 blocks/run × 11 seconds/block). As in the case of the working memory task, the only processing step applied beyond the HCP pipeline was to regress out of the estimated motion parameters.
2.1.4 Data censoring
Because head motion can lead to spurious patterns of co-activation, it is important to preprocess and censor the data so as to minimize potential artifacts. Thus, we calculated the “temporal derivative of variance over voxels” (DVARs; Power et al. 2012) to gauge the rate of change in the functional MRI signal at each time sample. If DVARs exceeded a threshold of 0.35 at a time point, the data point was removed; for working memory 5.48% of the data were removed, and for emotion 4.32% of the data were removed. This procedure was applied to task data only because the ICA-fixed preprocessed resting-state data have motion parameters “aggressively regressed out” already (Smith et al. 2013). See Supplementary Material Section Error! Reference source not found. for further discussion of the impact of preprocessing steps on resting-state and task data.
2.1.5 Participant censoring
Data from six participants contained time points with DVARs greater than 0.35 in over half of their blocks in working memory or emotion datasets. We therefore dropped these participants (including resting state) from further analysis. Thus, the final analysis used data from 94 participants.
2.2 Regions of Interest
Cortical regions of interest (ROIs) were defined to cover the cortex, yet be small enough to minimize the mixing of signals from adjacent but (potentially) functionally heterogeneous regions. k-means (with “city block” or L1 distance; 1000 iterations; Duda et al. 2012) was used to cluster each cortical hemisphere into 500 target regions based on their xyz coordinates. Thus, ROIs were defined based on their spatial coordinates on the cortical mesh, not functional data. Because the medial surface of the hemisphere is naturally undefined for parts that are effectively subcortical, clusters with xyz coordinates in those locations (i.e., corresponding to subcortical locations) were not considered. Therefore, a total of 941 ROIs were defined (471 on the right hemisphere and 470 on the left hemisphere). The resulting clusters were further “eroded” so as to avoid ROIs from abutting one another to minimize signals from a given region from contributing to neighboring ROIs (on average, ROIs comprised 28 2×2×2 mm voxels). Subcortical regions of interest were defined anatomically based on Freesurfer’s subcortical segmentation (Fischl 2012). Each subcortical structure was considered as one region, resulting in a total 19 subcortical regions (9 in each hemisphere and one brainstem ROI), including the cerebellum.
2.3 Functional connectivity
Functional connectivity between every pair of regions was calculated using the Pearson correlation of regions’ mean time series, resulting in a 960-by-960 connectivity matrix (for each participant and condition [rest, working memory, emotion]). Here, we followed the strategy by Yeo, Buckner and colleagues (Yeo et al. 2011), Power and colleagues (Power et al. 2012), and Cole and colleagues (Cole et al. 2013) and binarized each participant’s connectivity matrix by setting the top 10% strongest correlations to 1 and all other entries of the correlation matrix to 0. This strategy has proved successful in producing stable community results. The binarized connectivity matrices were averaged across participants and binarized a second time; again, the top 10% strongest connections were set to 1 and all other values were set to 0. The latter binarization was used so that we could apply the Bayesian mixed-membership model (see below) to partition the correlation matrix, which requires a binary correlation matrix. Note that the two-step binarization used here is not typically employed by other investigators, as some prefer to threshold at the subject level and others at the group level; our approach simply combined subject-level and group-level thresholding (the present approach is nearly indistinguishable from using a single thresholding step at the group level; difference in only ~0.8% of the edges).
Note, furthermore, that negative correlations were converted to zero. While this practice is widespread in analysis of brain data, there is also increasing realization of the potential importance of negative weights (Rubinov and Sporns, 2011). Note, however, that our thresholding method would also eliminate all negative weights because these were relatively weak links (over 99% of the negative edges were in the bottom 20th percentile of correlation strengths).
2.4 Detecting disjoint communities
Clustering with k-means as implemented in Statistics and Machine Learning in MATLABR2012b (with “city block” or L1 distance; 1000 iterations) was applied to the averaged adjacency matrix to identify k disjoint communities. Although k-means is a very simple clustering method, we employed it here for consistency with the study by Yeo and colleagues (2011), whose results were based on a large number of participants.
2.5 Detecting overlapping communities
The approach to detecting overlapping communities adopted here was originally based on the mixed-membership stochastic blocks model (Airoldi et al. 2008) within the context of stochastic variational inference (Hoffman et al. 2013). The specific algorithm we employed was developed by Gopalan and Blei (Gopalan and Blei 2013), as implemented in https://github.com/premgopalan/svinet.
Briefly, the algorithm proceeds as follows. Initially, a membership matrix is estimated based on the adjacency matrix and the number of communities to extract, K. The membership matrix has size NROIs-by-K, where NROIs is the number of ROIs. Each column of the membership matrix defines a community. Each row of the membership matrix is a membership vector, πi = [πi,1, πi,2, …, πi,K], that indicates the extent to which a region i belongs to each of the K communities. Importantly, the sum of the membership values along a row sum to 1. Formally, element πi,k in the membership matrix is the membership value of region i to the k-th community and, for every region i, (Figure 2).
2.5.1 Mixed-membership algorithm
For completeness, a more complete description of the algorithm is provided here. The model by Gopalan and Blei (2013) can be considered to belong to a subclass of mixed-membership stochastic block models (Airoldi et al. 2008) that assumes assortativity (see below).
To understand the model, let us consider it from a generative standpoint (i.e., as an engine to generate data according to certain distributional assumptions). To generate a network, the model considers all pairs of nodes. An essential component of the model is that it implements assortative clustering: nodes with similar membership vectors are more likely to be connected to each other. To capture assortativity, for each node pair (i, j), the model specifies community indicator vectors zi→j and zi←j. Community vectors have dimensionality 1×K and have all entries set to zero, except for the entry that equals 1 and indicates which community the node is likely to belong to. If both indicators “point” to the same community (i.e., are 1 for the same entry of the vector), the model connects nodes i and j with higher probability; otherwise they are likely to be unconnected.
Each community is associated with a community strength, βk, which captures how connected its members are. The probability that two nodes are connected in the model is governed by the similarity of their community membership vectors and the strength of their shared communities (the latter via the parameters βk).
Formally, the model assumes the following generative model to define networks (Figure S1). The notation “~” stands for “distributed as”.
For each community k, sample community strength βk ∼ Beta(η)
For each node i, sample community membership vector πi ∼ Dirichlet(α)
- For each pair of nodes i and j, where i < j:
- Sample community indicator zi → j ∼ Multinomial(πi,1)
- Sample community indicator zi←j ∼ Multinomial(πj,1)
- Sample connection yij ∼ Bernoulli(r), where:
From the complementary standpoint of parameter estimation, given an observed network (the input to the algorithm), the model defines a posterior distribution that gives a decomposition of the nodes into K overlapping communities. Formally, the algorithm computes the posterior distribution, p(π, z, β |y, α, η), so that the community membership vectors can be estimated – these are the objects that define the membership values for every node, which define the overlapping structure of the overall graph. Exact inference of this posterior distribution is computationally intractable, so stochastic variational inference (Hoffman et al. 2013) is used to approximately estimate the posterior in an efficient iterative way (such that estimating the posterior becomes an optimization problem). Importantly, the algorithm is fast and scalable. Indeed, the method has been used to study a network of 575,000 scientific articles (nodes) from the arXiv preprint server and a network of 3,700,000 US patents (nodes) (Gopalan and Blei 2013).
Because the algorithm is based on a probabilistic generative model, the values of the membership values depend on the initialization of the random “seed.” Therefore, we ran the algorithm 100 times with different random initialization seeds. The average membership value across the 100 initializations was considered as the membership value for that community. Of course, across the 100 “runs,” the columns of the membership matrix (i.e., the communities) may be “shuffled” (for example, community 1 in one iteration may be community 5 in another iteration). Therefore, prior to averaging across the 100 initializations, a simple graph matching procedure was used to reorder the columns (i.e., communities). To do so, the 100K different communities were clustered into K groups using k-means clustering and ordered accordingly (for computational expediency, we used the algorithm’s version as implemented in Python’s scikit-learn package in http://scikit-learn.org/stable/ which uses Euclidean or L2 distance; 1000 iterations). Note that this step does not determine overlapping community structure, and simply matches community labels. We also tested other matching methods, for instance, using normalized mutual information, and these generated nearly identical results. In essence, the Bayesian mixed-membership model was fairly robust to seed initialization, leading to stable matching results. Importantly, by calculating the membership matrix based on 100 runs of the algorithm, we are able to mitigate the “degeneracy” problem (Good et al. 2010), namely, the fact that multiple community assignments lead to similar model fits (for further discussion, see Fortunato 2010; Pessoa 2014).
2.5.2 Choosing the number of communities
To determine the number of communities, for each condition, the Bayesian mixed-membership model fit to the data was computed for different numbers of communities, ranging between 2 and 25. To hold the value of k constant across all bootstrapping iterations, we computed the model fit to the data by considering the entire original dataset (N=94). Figure S2 depicts the model fit for rest, working memory and emotion tasks as a function of k. For the rest condition, we observed a slight peak at k = 6 (Figure S2). And given that the fit curves were fairly flat between 4–6 communities for both the working memory and the emotion tasks, we fixed k = 6 across conditions to facilitate comparison between rest and task conditions. We note, however, that this does not imply that the value is “correct,” as choices of k between 4 and 6 (across datasets) were quite similar; in addition, these values of k are specific to the model employed here, and other models could partition the data optimally with a different number of communities.
2.6 Reproducibility and reliability of the results
Instead of splitting the data into “discovery” and “replication” datasets, we applied a more computationally intensive strategy, which was possible given that the total sample was of intermediate size only (N=94). We applied bootstrapping (Efron 1979) to our data by randomly resampling subjects (with replacement) for a total of 5000 iterations. Overlapping network analysis was performed independently for each of the 5000 iterations (each sample of 94 participants defined its own functional connectivity matrix).
By estimating overlapping communities for 5000 randomly resampled datasets, we generated 5000 sets of results, which allowed us to estimate median results as well as determine confidence intervals for them. To match community labels across iterations, we employed the same method described above, namely, k-means clustering.
The bootstrapping samples were also employed to determine nodes with membership values that were reliably greater than zero. To do so, to determine its lower bound, we computed the 2.5th percentile of the membership values for a given community (Figure S3). We then sorted the regions based on their 2.5th percentile membership value, and found the “elbow” of the 2.5th percentile “curve” (the “elbow” was defined as the point at maximal distance from the line passing from the first to the last point of the curve). Importantly, our results were robust to different choices of threshold.
2.7 Functional diversity
Previously, we studied the functional diversity of brain regions, namely, the repertoire of tasks that regions are engaged in, by utilizing repositories of human neuroimaging data (Anderson et al. 2013). Following a similar approach, here we used task activations from the BrainMap database (Laird et al. 2005; http://www.brainmap.org) to estimate functional diversity for each region of interest. We employed activation coordinates from experiments in 47 task domains spanning perception, action, cognition, and emotion in healthy subjects (total of 124,211 activation coordinates, as accessed on November 12, 2014). Activations from clinical populations were not considered.
Details of our approach can be obtained in the original report (Anderson et al. 2013). Here, we briefly outline the main steps. The initial steps of data analysis were performed volumetrically (that is, voxelwise) because of the meta-analytic nature of the data. Initially, a “domain-frequency map” was computed by tallying the number of times an activation was observed for each voxel (2 mm isotropic voxels), for each of the 47 task domains. The 47 maps were then blurred with a 6-mm cube-shaped kernel, and normalized to have a sum equal to one across domains (per voxel). Thus, the values at each voxel in each domain-frequency map ranged between 0 and 1.
To compute functional diversity, we employed Shannon’s (1948) entropy measure, which is used across many disciplines (e.g., biology, economics) as a measure of “diversity” (e.g., Magurran 2004). Formally,
where Hi is the functional diversity of the i-th region, pi,j is the frequency of activation in the database in the j-th domain for that region, and D = 47 is the number of task domains. Thus, maximal diversity occurs when the region belongs equally to all communities, namely, pi,j = 1/D.
The final voxelwise diversity map was then mapped to the surface (by using HCP’s Workbench volume-to-surface-mapping function; Marcus et al. 2011). For each surface ROI, the pi,j values were defined as the average activation frequency across the vertices associated with the ROI. For subcortical regions, no mapping was necessary and pi,j values were defined as the average activation frequency across the voxels within the anatomical ROI.
2.8 Membership diversity
We computed the diversity of membership values for each ROI by employing Shannon’s (1948) entropy measure, in a manner that was analogous to how we computed functional diversity. But note that membership diversity measures the extent to which a region has diverse membership values (one value per community; see Figure 2); functional diversity (previous section) measures the extent to which a region activates to tasks across domains.
In terms of the entropy equation (previous section), if pi,j is the probability that the i-th region belongs to the j-th community, and D is the number of communities, Hi is the membership diversity for region i. Thus, maximal membership diversity occurs when the region belongs equally to all communities. Because each region has membership values πi,j (i indexes ROIs, j indexes communities) that take on values between 0 to 1, and membership values for each region sum to 1, we can use the πi,j as “probabilities” pi,j in the formula above. For each ROI, membership diversity was calculated for all conditions, separately (rest, working memory, and emotion).
2.9 Degree
Degree of a region is defined as the number of links attaching it to other regions. Because the mixed-membership utilized a binarized graph, the degree of i-th region was computed as the sum of the values in the i-th row of the binary adjacency matrix minus 1.
2.10 Modularity of overlapping networks
Network modularity is used in the literature to indicate how a network can be subdivided into communities. For example, in the modularity measure defined by Newman for disjoint communities (Newman 2006), if two regions are connected and belong to the same community, modularity increases, and if two regions are connected but belong to two different communities, modularity decreases. Several modularity methods have been defined for overlapping communities, too (Xie 2013). Here, based on Chen and colleagues (Chen et al. 2010), we extended modularity to the case of the mixed-membership model we employed as follows:
where m is the total number of links in the graph, Ai,j is the edge between node i and j (1 if edge present, 0 otherwise), ki is the degree of node i (based on the binarized group graph), and πi,c is the membership value of node i in community c. This extension of modularity is straightforward. The part of the equation prior to the product of the membership values, πi,c πj,c, implements the intuitive description of standard (disjoint) modularity provided above; the product of the membership values incorporates the “strengths” into the original formulation (which essentially consider membership as a binary value).
2.11 Defining Bridges
To identify ROIs acting as bridges, first we normalized both degree and membership diversity to have values between 0 and 1. Bottleneck bridges are regions with high membership diversity and low degree. Hub bridges are regions with high membership diversity and high degree. Thus, bridgeness scores can be defined as:
and computed for each bootstrapping iteration, when degree and membership diversity for each iteration are normalized between 0 and 1. z(·) computes the z score of the argument.
Power and colleagues (2013) argued that studies that use degree to identify hubs in resting-state functional networks are problematic because the identified hubs may be due to community size rather than their purported roles in “global” information processing. In other words, if degree is the only parameter used to determine if a region is a “hub,” the usage is potentially problematic. Note, however, that here the information processing role of nodes was also based on membership diversity. Thus, when membership diversity is low (say, a region is mostly affiliating with one or two communities), the bridgeness score will be low. In essence, therefore, degree played a role in labeling bridges as “hub bridges” or “bottleneck bridges,” which indicates if a bridge between communities is linked to multiple or a few other regions, respectively. In any case, further analyses revealed no evidence of a systematic effect of community size on node taxonomy (see Supplementary Section Error! Reference source not found.).
2.12 Cortical and Subcortical Visualization
To visualize cortical results we used SUMA (Saad and Reynolds 2012); http://afni.nimh.nih.gov/afni/suma), and to visualize the subcortical volumes we utilized the volume shapes in the CANlab 3dHeadUtility MATLAB toolbox by ((Wager et al. 2008); https://github.com/canlab/CanlabCore). To aid visualization, the right putamen is plotted behind other subcortical regions of the left hemisphere, and the left putamen is plotted behind other subcortical regions of the right hemisphere.
3. Results
Analysis of functional MRI data was performed on a sample of 100 unrelated subjects from the Human Connectome Project (Van Essen et al. 2013). We removed data from six participants due to scanning artifacts (Materials and Methods).
The cortical surface and subcortical volumes were subdivided into 960 regions. Whole-brain functional connectivity was measured for each participant by calculating the Pearson correlation between the time series from every pair of regions in each of three conditions (all from the Human Connectome Project): rest, working memory, and emotion. To decompose the functional connectivity matrix into a set of disjoint communities, we employed standard k-means (Materials and Methods), which identifies clusters of regions such that each region belongs to a single community.
For overlapping clustering, we employed a Bayesian mixed-membership model (Gopalan and Blei 2013; Materials and Methods) which identifies sets of regions such that each node can belong to multiple communities. The mixed-membership model assigns a continuous, probability-like membership value for each region of each community (Figure 2). Thus, a region belonging to a single community has a membership value of one for that community and membership values of zero elsewhere; a region belonging to multiple communities has intermediate membership values (between 0 and 1) across communities. To be able to assess the reliability of the results, the non-discarded datasets (N=94) were analyzed by a bootstrapping procedure (Materials and Methods) that allowed us to estimate the median of the parameter estimates reported below, as well as determine confidence intervals for the parameters.
In the next two sections, we report on the overlapping network structure as revealed by resting-state data. The subsequent sections then compare properties of overlapping networks of resting-state and task data. Both disjoint and overlapping clustering algorithms require the specification of the number of communities, K, to be extracted. We report here results based on K equal six for all conditions, which was determined by evaluating the model fit to the data (Materials and Methods; Figure S2).
3.1 Comparing disjoint and overlapping communities at rest
The six communities extracted with disjoint clustering (k-means; Figure 3) corresponded closely to previously identified large-scale communities (Yeo et al. 2011); but note that unlike most previous studies, we included subcortical regions, too. Here, we avoid using semantic labels for communities (for example, “visual”, “frontoparietal”, and “default”), and simply refer to the disjoint communities as DC1 through DC6.
Figure 3.
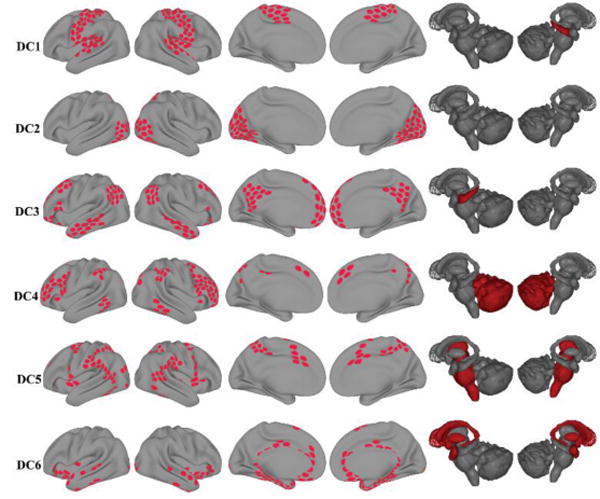
Disjoint communities (DC) detected during rest. Each row depicts one of the six disjoint communities extracted with k-means. Cortical and subcortical regions belonging to each of community are colored in red.
The six overlapping communities obtained with the Bayesian mixed-membership model, including membership values for every region, are depicted in Figure 4. The correspondence between each pair of disjoint and overlapping communities was measured using cosine similarity (i.e., the normalized dot-product). Four of the disjoint communities exhibited a fairly high degree of similarity with a single overlapping community (Figure 5). Two disjoint communities, DC5 and DC6, exhibited a less clear correspondence with a unique overlapping community: DC5 was similar to both OC5 and OC6; DC6 did not correspond strongly to any of the overlapping communities. From the perspective of the overlapping communities, OC5 corresponded most strongly with DC5, which is a network that includes fronto-parietal regions important for attention and executive function. Interestingly, OC5 was least similar to DC3, the network that is commonly denoted as “resting state” or “task negative.”
Figure 4.
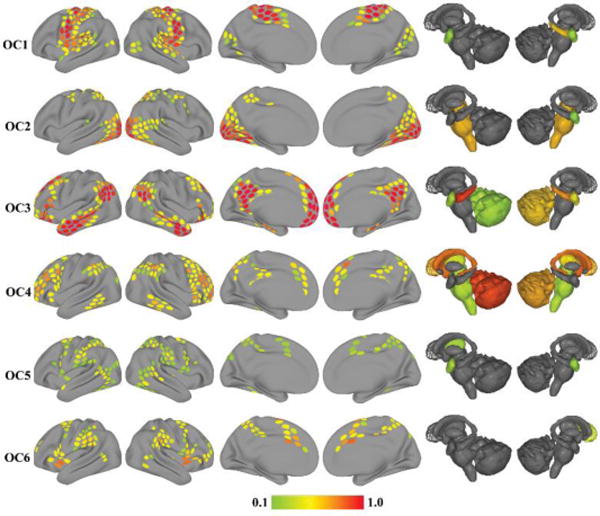
Overlapping communities (OC) detected during rest. Each row depicts one of the six overlapping communities extracted with the mixed-membership model. The color of cortical and subcortical regions reflects the median membership value of each region to each community across 5,000 iterations. Membership values are thresholded at 0.1 for illustration.
Figure 5.
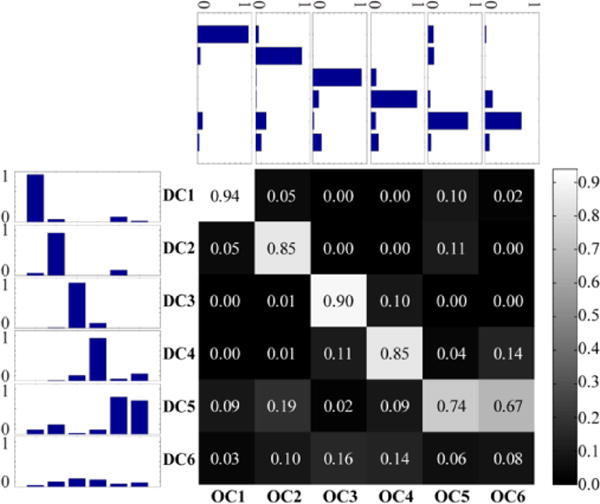
Cosine similarity between disjoint (DC1–DC6) and overlapping (OC1–OC6) communities during rest. The matrix displays the median cosine similarity between community pairs across 5,000 iterations. Given that community membership vectors do not contain negative values, the cosine similarity scores range from zero (orthogonal) to one (identical). Side and top insets represent similarity scores as bar plots across rows and columns, respectively.
To characterize the finer structure of the overlapping communities, we examined the distribution of membership values for each of the six communities (Figure 6). Communities OC1 through OC3 displayed peaks at the largest bin values, but also considerable probability mass below the bin with largest membership values. Interestingly, OC3, the community most similar to the standard task-negative network, showed the most skewed distribution, and the only community with a clear peak close to values of 1. In contrast to the increasing pattern of OC1-3, communities OC4 through OC6 showed distinct shapes. OC4 displayed a distribution of values that was relatively uniform (except for the first and last bins); both OC5 and OC6 exhibited negative skew, with OC5 showing particularly strong skew.
Figure 6.
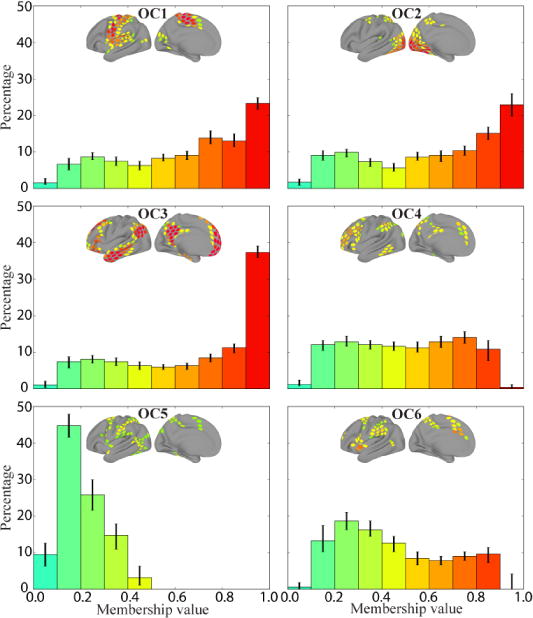
Frequency histograms of membership values for each of the six overlapping communities during rest. Each histogram depicts the median value in each bin for that community across 5,000 iterations (error bars show the of 25th–75th percentile range). The colors of the bars correspond to the range of membership values shown in the brain insets.
3.2 Relationship between functional diversity and membership diversity
Brain regions differ in terms of their functional diversity, namely, the repertoire of functions they are engaged in. By considering large datasets of neuroimaging studies (Anderson et al. 2013), we showed that some regions are engaged by a wide variety of tasks (they have high functional diversity), whereas other regions are more narrowly tuned and are engaged by a limited range of paradigms (they have low functional diversity). Here, we asked the following question: Is functional diversity related to how brain regions affiliate with other regions in the absence of a task (resting state)?
To study this question, we defined a new measure for overlapping communities, the membership diversity, which captures the extent to which a node participates in multiple communities. A node’s membership diversity was quantified by the Shannon entropy of the membership values (Materials and Methods). Intuitively, maximal diversity occurs when a region participates equally across all communities; naturally, minimal diversity occurs when a region participates in one and only one community. Separately, functional diversity was calculated for each region using our previous methods (Anderson et al. 2013) and based on neuroimaging data in the BrainMap database (Laird et al. 2005; see Materials and Methods; Figure S4). Robust regression revealed that functional diversity was positively related to membership diversity, indicating that regions activated by a wide variety of tasks (that is, functionally diverse) tended to participate in more communities at rest (median slope: 0.27, 95% confidence interval: 0.22–0.32).
3.3 Comparing overlapping communities during rest and task
Although network structure has been extensively studied during taskless states, less is known during task execution. In particular, how network structure is potentially altered by tasks is actively debated. To address this question, we investigated the overlapping network structure of functional MRI data collected during working memory and emotion tasks. Because our goal was to compare network properties during task execution to those found at rest, we did not employ the baseline tasks conditions; instead we used data for the active conditions alone (working memory: 2-back condition; emotion: matching emotional faces; see Materials and Methods). To aid in the comparison with the results at rest, a value of K = 6 was used for both cases.
Overlapping communities are shown in Figure 7 for working memory (WM1-6) and Figure 8 for emotion (EM1-6) (for additional analyses of the working memory dataset, see Supplementary Material, Section Error! Reference source not found.). Visually, several of the communities during the two tasks resembled communities found at rest. However, careful inspection of the similarity matrices (Figures 9 and 10) revealed that tasks altered the observed networks in important ways, too. Consider, for example, the working memory task. From the standpoint of the communities observed at rest, only OC2 displayed a substantial match to a single community during working memory (WM2), as evidenced by the bar plots (see insets). Likewise, for the emotion task, again, only OC1-2 displayed a substantial match to a single community during emotion (EM1-2, respectively).
Figure 7.
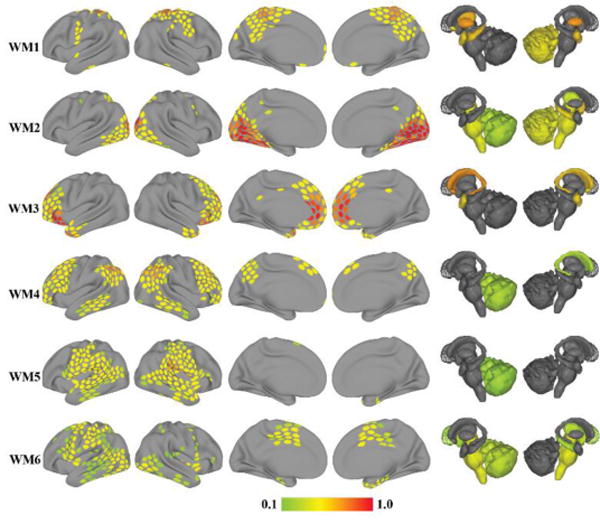
Overlapping communities (WM) detected during the working memory task. Each row depicts one of the six overlapping communities extracted with the mixed-membership model. The color of cortical and subcortical regions reflects the median membership value of each region to each community across 5,000 iterations. Membership values are thresholded at 0.1 for illustration.
Figure 8.
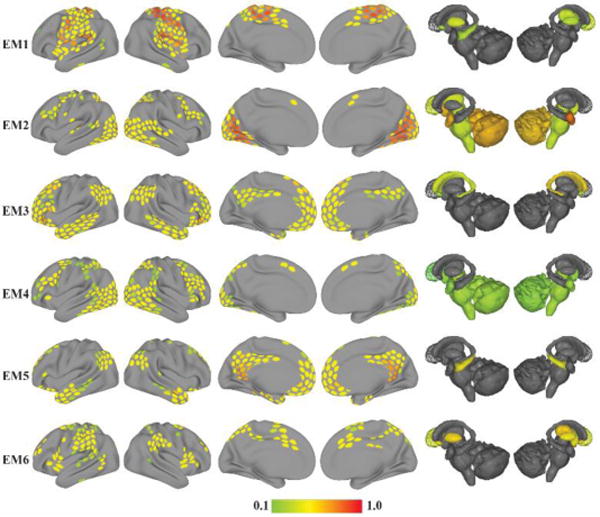
Overlapping Communities (EM) detected during the emotion task. Each row depicts one of the six overlapping communities extracted with the mixed-membership model. The color of cortical and subcortical regions reflects the median membership value of each region to each community across 5,000 iterations. Membership values are thresholded at 0.1 for illustration.
Figure 9.
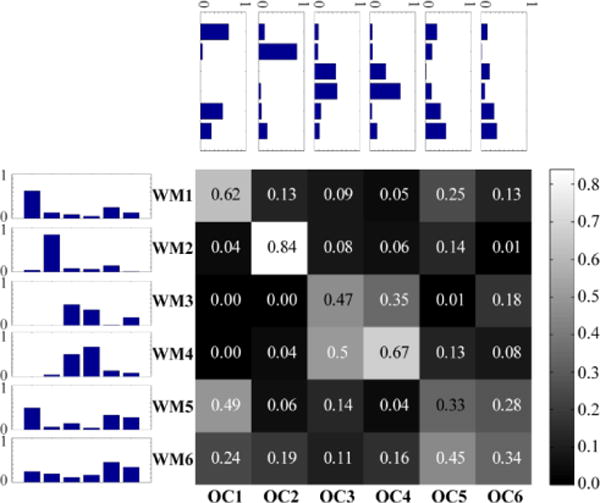
Cosine similarity between overlapping communities at rest (OC1–OC6) and during the working memory task (WM1–WM6). The matrix displays the median cosine similarity between each WM and OC network across 5,000 iterations. Given that the community membership vectors do not contain negative values, the cosine similarity scores range from zero (orthogonal) to one (identical). Side and top insets represent similarity scores as bar plots across rows and columns, respectively.
Figure 10.
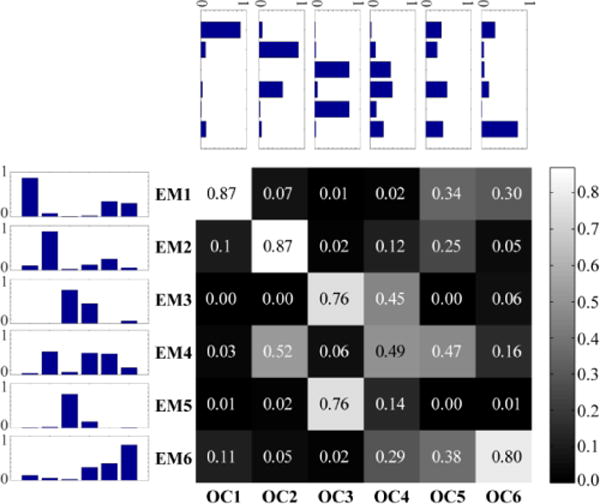
Cosine similarity between overlapping communities at rest (OC1–OC6) and during the emotion task (EM1–EM6). The matrix displays the median cosine similarity between each EM and OC network across 5,000 iterations. Given that the community membership vectors do not contain negative values, the cosine similarity scores range from zero (orthogonal) to one (identical). Side and top insets represent similarity scores as bar plots across rows and columns, respectively.
Examination of the distribution of membership values for individual communities provides further insight into overlapping information. For the working memory task (Figure 11), most communities exhibited small, intermediate, and large membership values. Community WM2 was the only one that showed a peak at the bin with largest values, and communities WM4-6 were negatively skewed. For the emotion task (Figure 12), no community exhibited a peak near 1, and communities EM4-6 showed negative skew.
Figure 11.
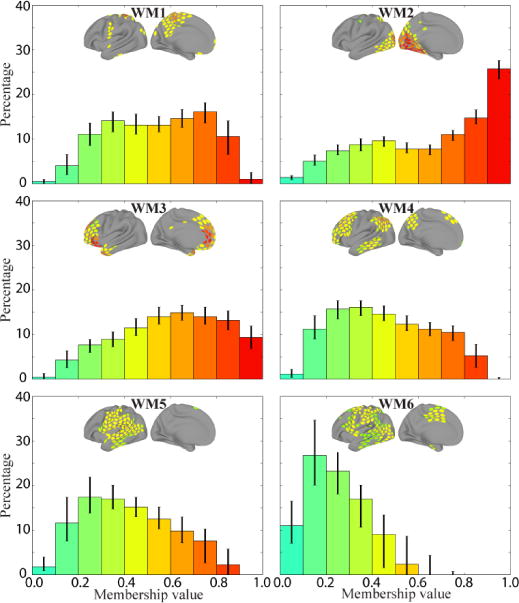
Frequency histograms of membership values for each of the six overlapping communities during the working memory task. Each histogram depicts the median value in each bin for that community across 5,000 iterations (error bars show the of 25th–75th percentile range). The colors of the bars correspond to the range of membership values shown in the brain insets.
Figure 12.
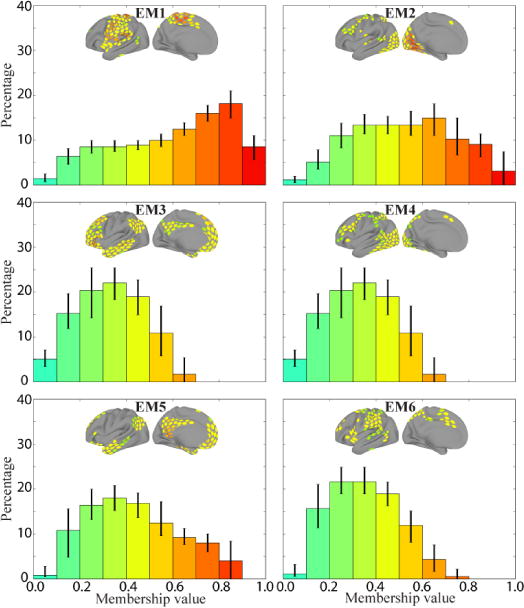
Frequency histograms of membership values for each of the six overlapping communities during the emotion task. Each histogram depicts the median value in each bin for that community across 5,000 iterations (error bars show the of 25th–75th percentile range). The colors of the bars correspond to the range of membership values shown in the brain insets.
3.4 Modularity of overlapping networks
Further insight into the changes in network structure linked to tasks states can be gained by studying modularity. Conceptualizing networks as inherently overlapping structures highlights their non-modular structure. Nevertheless, modularity is not all-or-none, so quantifying it provides a measure of the extent to which signals potentially can flow between communities. We defined a measure of overlapping community modularity based on membership values (Materials and Methods), and a modularity score was computed for each community during the rest, working memory, and emotion conditions. Modularity (Figure 13) was clearly highest during resting state (mean and standard deviation: 0.318 ± 0.016), and decreased for both tasks (working memory: 0.183 ± 0.018; emotion: 0.211 ± 0.015) for which modularity scores were fairly similar. Importantly, all modularity scores of individual communities during working memory and emotion were lower than values observed at rest, showing that the reduction was not driven by changes to one or a just a few communities. Additional analyses in Supplementary Material (Section Error! Reference source not found.) show that these findings also hold when the number of communities, K, varies across conditions.
Figure 13.
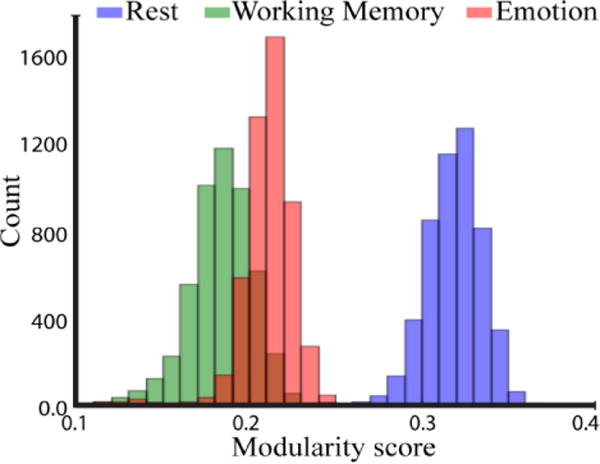
Modularity scores of overlapping communities for rest and both tasks. The histograms depict the whole-brain modularity scores across 5,000 iterations (each modularity score was obtained by summing modularity scores across communities).
3.5 Node taxonomy: hubs and bridges during rest and task conditions
An additional goal of this study was to understand how regions potentially participate in “signal communication” so as to better characterize the overlapping network structure of brain networks. More broadly, characterizing node properties within the overall network topology can help elucidate the information processing roles played by nodes (Guimerà and Amaral 2005a,b). The mixed-membership approach employed here is useful because each node is characterized with a set of probability-like values that characterize its participation across all networks simultaneously.
To characterize a node’s functional role, we employed the membership diversity measure for overlapping communities described above, which captures the extent to which a node participates in multiple communities. Our reasoning was that nodes with high membership diversity may function as important “bridges” by facilitating communication across multiple communities. As stated previously, a node’s membership diversity was quantified by the Shannon entropy of its membership values (Materials and Methods). We also considered the degree of a node, a standard graph measure that indicates how highly connected the node is to all other nodes (Materials and Methods).
Degree and membership diversity capture different aspects of node function. For example, a region with high degree is connected to many regions and a region with low degree is connected to a small number of regions. Membership diversity indexes a different aspect of network structure. For instance, a region with a high membership value for one community (it participates highly in that community) and low membership values elsewhere would have low membership diversity because it participates mostly within a single community; in contrast, a region with intermediate membership values across multiple communities would have high membership diversity because it participates in multiple communities. Thus, degree helps measure the extent to which a region is a “hub” (Guimerà and Amaral 2005a,b; see Section 4.2.4 for further discussion), and membership diversity indicates the extent to which a region is a cross-community “bridge” (Nepusz et al. 2008; Yu et al. 2007). Combining these two measures leads to four general classes of regions:
Locally connected regions (low degree/low diversity) are not highly connected and communicate primarily within a single community;
Local hubs (high degree/low diversity) are highly connected regions that communicate primarily within a community;
Bottleneck bridges (low degree/high diversity) are regions with few connections that span multiple communities;
Hub bridges (high degree/high diversity) are highly connected regions with connections that span multiple communities.
We were particularly interested in investigating the distribution of the last two types of node above for both rest and task datasets. For visualization, we sorted the regions based on their bridgeness score in each condition (Figures 14 and 15; Materials and Methods). Notably, several properties observed at rest were altered during task execution. See Discussion for further elaboration and Supplementary Section Error! Reference source not found. for additional analyses.
Figure 14.
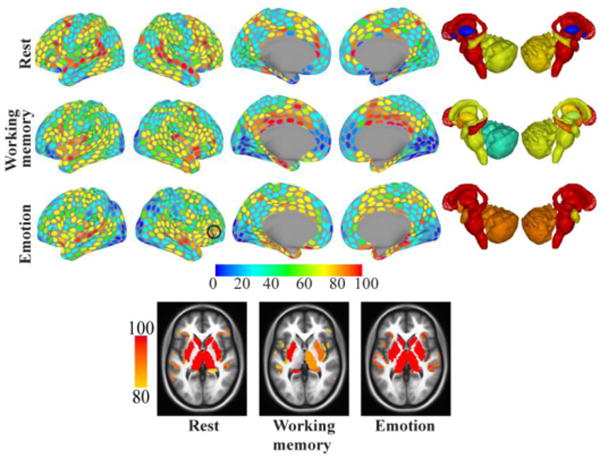
Bottleneck bridges. Bridgeness scores for each region and condition (top: resting state, middle: working memory, bottom: emotion). Colors indicate the percentile of the ROI’s median score across 5000 iterations (for example: regions colored red had bridgeness scores around the 90th percentile or above). Black contours indicate regions discussed in the text. Bottom row: Horizontal slices at illustrating strong bridges in the anterior insula.
Figure 15.
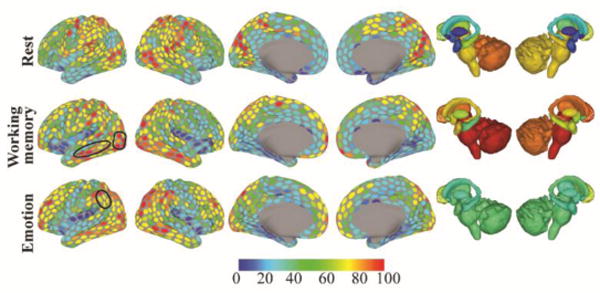
Hub bridges. Bridgeness scores for each region and condition (top: resting state, middle: working memory, bottom: emotion). Colors indicate the percentile of the ROI’s median score across 5000 iterations (for example: regions colored red had bridgeness scores around the 90th percentile or above). Black contours indicate regions discussed in the text.
3.6 Reliability of results
The above results were based on the median of the membership values across bootstrapping iterations. The bootstrapping results give us the ability to define confidence intervals on these estimates. For example, for Figures 6, 11 and 12, the frequency histograms were generated by considering all 5000 iterations. Each bin shows the median frequency across iterations and an interval around the median. Note that only ROIs with membership values consistently greater than zero were considered in the generation of the histograms.
In addition, for every ROI with nonzero membership value, and across all three conditions, we determined confidence intervals (see Figures S5–S7). For instance, consider community OC1 during rest in which approximately 250 ROIs exhibited membership values consistently greater than zero. Figure S5 shows the membership values as a function of ROI (reordered in ascending fashion for clarity) and the 95-percentile confidence interval around the median. This figure, as well as the ones for other communities and conditions, shows that although there was variability from sample to sample around the median, the estimates reported are reliable.
3.7 Does overlapping community structure at the group level reflect that at the participant level?
The results described thus far were based on a resulting group correlation matrix. It is possible, however, that the results were distorted by the implicit averaging associated with our approach. In the extreme, it is possible that each participant had disjoint community structure that differed spatially to some extent, so that the regions with high membership diversity at the group level were artifacts induced by averaging spatially variable subjects. This possibility is increased given recent studies illustrating individual variability in large-scale networks (Mueller et al. 2013; Gordon et al. 2015). To address this possibility, we performed a series of control analyses (the full analyses are described in the supplementary material, Section Error! Reference source not found.). We ran the mixed-membership algorithm on resting-state data for each of the 94 participants individually. For each participant, we employed data corresponding to two runs, which provided a sizeable amount of data (unlike the task data which in the Human Connectome Project is rather minimal).
The extracted communities of a few sample participants are shown in Figure 16 (for additional results, see Supplementary Material, Section Error! Reference source not found.). Informal visual comparison with the group results in Figure 4 shows very good agreement between the two. More quantitatively, the histograms of the estimated communities at the subject level confirmed the overlapping structure of the communities (Figure 17). Comparison with the group results (Figure 6) also illustrates very good agreement in the shape of the distributions.
Figure 16.
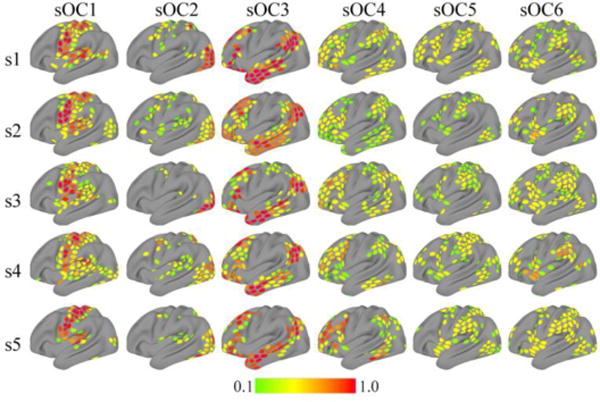
Overlapping community organization during rest at the individual level for sample participants. Each row depicts the six overlapping communities extracted with the mixed-membership model per subject (sOC). Membership values are thresholded at 0.1 for illustration.
Figure 17.
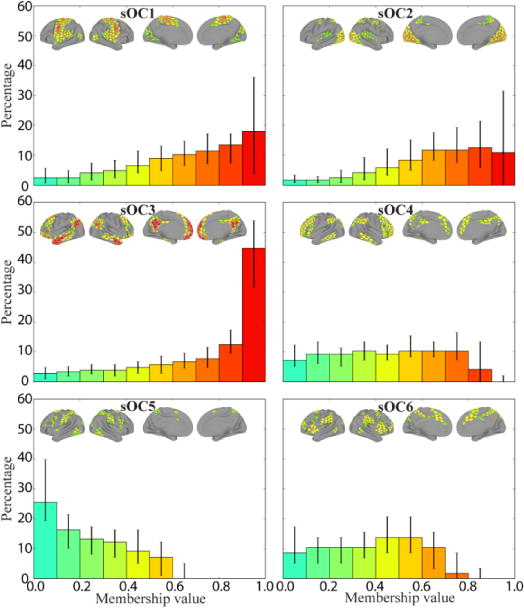
Frequency histograms of membership values for overlapping communities estimated at the individual level during rest. Bins show median values across 94 subjects (error bars show the of 25th–75th percentile range). Brain insets show median membership values across subjects (thresholded at 0.1 for illustration). The colors of the bars correspond to the range of membership values shown in the brain insets.
Taken together, for resting-state data, analyses at the participant level demonstrated that dense overlapping community structure is present at the level of individual participants, and that the group results did not unduly distort patterns observed at the individual level. In addition, we also observed individual variability in membership diversity values which will be important to consider in future studies (see Supplementary Material). Finally, although the present results are encouraging, the same approach needs to be employed for task data once longer time series are available.
4. Discussion
We employed a mixed-membership approach to unravel the structure of overlapping large-scale brain networks. Our aims were as follows: 1) compare the community structure of disjoint and overlapping networks; 2) determine the relationship between functional diversity and membership diversity; 3) characterize the overlapping community structure during rest and task states; and 4) study the distribution of “bridges” in the brain, including bottleneck and hub bridges, during both rest and tasks. Below, we discuss the implications of our main findings.
4.1 General issues
Yeo and colleagues (2014, p. 225) investigated overlapping brain networks during rest and suggested the following: “Our results suggest that segregation and interdigitation of networks in association cortex may be a true feature of cortical organization and not an artifact of the methods used to estimate their topography.” Our results corroborate their conclusions in that they revealed dense network overlap at both rest and task conditions. Thus, fully considering network overlap is important for unravelling the organization of brain networks.
Based on studies of perception, cognition, emotion, and motivation, we have proposed that brain networks are highly interdigitated (Pessoa 2013; Pessoa 2014). Conceptually, this view of brain networks stems from the argument that the mapping from structure to function is not one-to-one. Instead, the mapping is many-to-many, such that a brain region participates in many functions and similar functions are carried out by many regions.
Consider, briefly, the case of the amygdala. Even a simplified view of its anatomical connectivity shows that, minimally, it belongs to three networks. The first is a “visual network,” as the amygdala receives fibers from anterior parts of temporal cortex, and influences visual processing via a set of projections that reach most of ventral occipito-temporal cortex. The second is the well-known “autonomic network,” and via connections with the hypothalamus and periaqueductal gray (among many others), the amygdala participates in the coordination of many complex autonomic mechanisms. The third is a “value network,” as evidenced by its connectivity with orbitofrontal cortex and medial prefrontal cortex. Thus, the amygdala affiliates with different sets of regions (“communities”) in a highly flexible and context-dependent manner.
These ideas are related to the “flexible hub theory” by Cole and colleagues (2013). One component of this framework predicts that “some brain regions flexibly shift their functional connectivity patterns with multiple brain networks across a wide variety of tasks” (Cole et al. 2013; p. 1348). Cole and colleagues suggest that fronto-parietal regions are particularly important “flexible hubs.” They described a pattern of functional connectivity that was “representational,” where brain-wide functional connectivity patterns across a fronto-parietal community across 64 task states reflected the similarity relationships between tasks, and could be used to identify task states. Our findings are in agreement with their framework, but suggest a dense overlap organization that extends beyond fronto-parietal regions.
Given the discussion in the previous paragraphs, it is instructive to discuss the concept of modularity per se. Modularity is a term with multiple connotations in cognitive, brain, and network sciences (for example, see Shallice, 1988; Shallice and Cooper, 2011). Although we cannot provide a fuller account of the issues here (but see, Pessoa 2013, Chapter 8; Pessoa 2014), we briefly comment on the relationship between the presence of overlapping communities and modular structure. In particular, the presence of some overlapping organization in itself does not necessarily imply strong non-modular structure. For instance, as discussed, some nodes may be re-used across communities, particularly brain regions that act as bridges. More generally, systems (neural or otherwise) admit to different degrees of modularity insofar as their components admit to different degrees of isolability (Bechtel and Richardson, 1993). But we suggest that the distribution of network membership values revealed by our analysis, with the associated dense community overlap, reveals a substantial amount of non-modularity in large-scale brain networks at rest and task states.
Finally, we note that some techniques used to study functional connectivity, including ICA (e.g., Smith et al. 2012) and variants of Principal Component Analysis, generate overlapping activation maps. To decompose the adjacency matrix, a frequent assumption is that the communities are orthogonal. While there are methods which relax this orthogonality constraint, they all make assumptions about the nature of the underlying sources: for example, temporal ICA assumes that each component will be temporally independent; factor rotations make assumptions regarding “sparsity,” and so on. Methods based on ICA have made important contributions to the understanding of large-scale brain networks (Calhoun et al. 2001; Smith et al. 2009). Nevertheless, their assumptions are not without controversy (e.g., Friston 1998). In particular, application of temporal ICA is challenging in the context of functional MRI data because it requires a large number of samples to function well, and those are typically not available with standard “slow” sampling rates (~2 s; though faster sampling with newer pulse sequences reduces this problem).
4.1.1 Membership diversity and participation coefficient
The participation coefficient is a graph-theoretical measure that captures the distribution of edges of a node across all of the communities in a network, and has been used to characterize the type and distribution of hubs in networks (Guimerà and Amaral, 2005a,b; Power et al., 2013). It thus expresses a similar property as the membership diversity investigated here. At one level, the distinction between the two can be viewed as fairly subtle. Note, however, that in the case of the participation coefficient, the communities are typically conceptualized as disjoint, and have more or less clearly defined boundaries. The mixed-membership framework offers the possibility to view communities as intrinsically interwoven, such that there is no need to actually define boundaries. This approach may be particularly interesting in situations where dense overlap is present, and a more graded version of community organization is conceptually advantageous.
4.2 Specific issues
4.2.1 Community structure at rest
Extracting mixed memberships revealed network structure that matched many of the general features of disjoint networks. This was particularly the case for four of the communities (OC1–OC4) that exhibited strong matches (cosine similarity greater than 0.85) with specific disjoint communities (DC1–DC4, respectively). Networks OC5 and OC6 showed somewhat weaker matches to a single disjoint community. In addition to the strongest matching community, several of the mixed communities correlated non-trivially with other disjoint communities; for instance, OC2 and DC5 (0.19), OC3 and DC6 (0.16), and so on. This suggests that mixed communities are not fully captured by a single disjoint community, and that they contain information that is not well described by disjoint communities.
We gained a richer characterization of the networks by considering the distributions of membership values (Figure 6; note that the histograms already eliminated ROIs with membership values that were not reliably greater than 0). Data that would be well characterized by a single community would exhibit a membership distribution concentrated mostly with values close to 1. All mixed communities had non-trivial membership values contributions far from the peak of 1. Inspection of the distributions suggests that all mixed communities would not be well described by a single community. Even for OC3, most of the probability mass (>60%) was observed in the non-maximal bins. Thus, whereas the mixed-membership approach reproduced many of the general features of the disjoint communities, mixed communities contain information that is not captured by disjoint communities.
4.2.2 Functional diversity
Several groups have suggested that brain regions can be conceptualized via their functional repertoire which is inherently multidimensional (see Anderson et al. 2013; Bzdok et al. 2013; Lancaster et al. 2012; Passingham et al. 2002; Poldrack 2006; Poldrack et al. 2009). Accordingly, brain regions vary considerably in their functional diversity. In particular, regions such as the anterior insula, as well as parts of lateral and medial frontal cortex, are highly diverse. We conjectured that functional diversity would be linked with membership diversity observed at rest. In other words, regions with high functional diversity should participate in several networks, insofar as they may be engaged with a broad range of regions in the process of participating in diverse functions. Here, we found a positive association between functional and membership diversity, suggesting that the two properties are linked.
4.2.3 How do tasks alter the functional connectivity landscape?
Buckner and colleagues (2013) asked the following question: Do networks studied during the resting state capture fundamental units of organization or should “rest” be considered just another arbitrary task state? Both sides of this debate are represented in the literature (for discussion and references, see Cole et al. 2014). To investigate this question, we compared mixed networks observed during rest, as well as working memory and emotion tasks.
Although similarities were apparent between rest and task communities, important changes were observed. For example during the working memory task, only two communities that were associated with sensory and sensorimotor aspects (WM1 and WM2) were fairly well represented by a single community observed at rest (OC1 and OC2, respectively; this was particularly the case for WM2/OC2). The remaining communities correlated nontrivially with two or more communities observed at rest. Likewise, during the emotion task, several communities overlapped with multiple communities observed at rest. Our findings support the idea that considerable reorganization is observed during specific tasks, and that it may be prudent to consider “rest” as a particular task state.
The relationship between networks observed during the resting state and task states was also investigated by determining the modularity structure of the communities. Quantifying modularity provides a measure of the extent to which signals potentially can flow between communities. We can thus consider the inverse of modularity as an index of communicability. Communicability was lowest during resting state and increased for both tasks. Importantly, increases in communicability were observed across multiple communities, and were not limited to specific cases, such as decrease only in visual or sensorimotor communities. It thus appears that, during the two tasks studied here, coordinated activity between regions that is important for task execution shapes the observed networks by increasing inter-region integration – hence, decreasing modularity.
4.2.4 Characterizing different types of bridges
The framework of overlapping communities offers a natural way to discover nodes that participate across multiple communities – “bridges.” Here, we combined node membership diversity (which captures the extent to which a node participates in multiple communities) with node degree to investigate two types of bridges: bottleneck bridges, which are regions with relatively few connections that span multiple communities; and hub bridges, which are regions with relatively many connections that span multiple communities. Our approach was to determine bridgeness scores for all ROIs and not adopt an arbitrary threshold, so that the spatial distribution of bridgeness could be better appreciated.
At rest, several bottleneck bridges were found in the prefrontal cortex. These included regions in dorsolateral and more inferior prefrontal cortex. At rest, hub bridges were not prominently found in the prefrontal cortex. Notable changes were observed during task execution, some of which we comment on here. During the working memory task, several regions in occipital cortex showed high hub bridge scores. Whereas the same regions were also well connected at rest (they behaved as local hubs, which are highly connected regions that communicate primarily within a community), they diversified their participation across communities during the working memory task (and to some extent during the emotion task), thus increasing bridgeness. This is interesting in light of the fact that the task required participants to hold in mind information about multiple types of visual stimuli (places, tools, faces, and body parts), and suggests that working memory performance is characterized by the participation of visual cortex in multiple large-scale networks (see Sreenivasan et al. 2014). This is also evidenced by the stronger hub bridges observed in ventral temporal cortex (which were not prominent during rest).
During the emotion task, hub bridges in parietal cortex were stronger more inferiorly in the vicinity of the angular gyrus, whereas they were stronger more medially/superiorly during rest in the superior parietal lobule and the vicinity of the intraparietal sulcus. Furthermore, strong bottleneck bridges were not prominent in dorsal prefrontal regions, and were found instead more inferiorly (especially on the right hemisphere). These findings resonate with the roles attributed to the angular gyrus (Seghier 2013) and inferior frontal regions. Interestingly, sites in the inferior frontal gyrus have been consistently reported in many emotion tasks and implicated in “emotional salience,” and a recent meta-analysis has identified the inferior frontal gyrus (on the right hemisphere) as a “hub” for emotional processing (Kirby and Robinson 2015). Our findings suggest that this region may function as a bottleneck bridge, that is, a region that is not necessarily highly connected but one that participates across several communities. In addition, the anterior insula behaved as a strong bottleneck bridge, a role that was also observed at rest (but not during working memory).
Our analysis revealed that multiple subcortical areas play notable roles as bridges (but see next section for study limitations). Notably, the amygdala, caudate, putamen, thalamus, and hippocampus were found to be strong bottleneck bridges at rest. The cerebellum behaved as a strong hub bridge at rest (especially on the left), showing that it not only had high membership diversity but also high connectivity (degree) overall. During the emotion task, all subcortical regions behaved as strong bottleneck bridges. During the working memory task, the brainstem and the cerebellum, as well as the right caudate and right thalamus, behaved as strong hub bridges, while the putamen and hippocampus behaved as strong bottleneck bridges. Combined, these findings suggest that subcortical regions play important roles in the flow of information at both rest and during specific tasks (but see next section). Several previous studies of large-scale functional networks did not account for potential contributions of subcortical areas, an omission that has contributed to a cortico-centric view of networks. But it is well documented in the literature that many subcortical areas have massive connectivity with cortex and play part in important cortico-subcortical circuits, including areas such as the striatum, thalamus, amygdala, and cerebellum (Alexander et al. 1986; Amaral et al. 1992; Jones 2006; Middleton and Strick 2000; Sherman and Guillery 2013).
Finally, we note that nodes typically associated with the task-negative network did not have high hub bridgeness scores. This is in contrast to reports based on degree that suggest that they are “globally” connected regions (for example, Cole et al., 2010; Tomasi and Volkow, 2011). Here, degree played a role in the labeling of bridges as “hub bridges” or “bottleneck bridges,” which only indicates if a bridge between communities is linked to multiple or a few other regions, respectively.
4.2.5 Study limitations
In this section, we discuss some of the limitations of our study. For one, the choice of number of ROIs was somewhat arbitrary. For instance, Hagmann and colleagues (2008) employed 998 cortical regions, Power and colleagues (2012) used 264 cortical ROIs, and Yeo and colleagues (2011) used 1175 uniformly spaced vertices. In the present study (960 cortical and subcortical ROIs), we chose a relatively large number of regions (and consequently small in size in cortex) because our goal was to investigate overlapping communities; we thus did not want to favor the possibility of overlap by having regions that were large and potentially more functionally heterogeneous. We also note that the cortical ROIs defined here were solely based on the spatial coordinates of the respective surface vertices. Therefore, future work not only should investigate the role of ROI “granularity” (that is, size/number), but also the effect of functional homogeneity in the definition of ROIs. In addition, we did not subdivide subcortical regions into small parcels, which is suboptimal because subcortical regions are heterogeneous and contain subnuclei. Accordingly, future studies will need to re-investigate the overlapping community structure of subcortical regions at finer levels of parcellation.
Another limitation of the paper is that it investigated a single overlapping community algorithm. Research on this class of algorithms (Xie et al., 2013) has grown considerably since at least the impactful publication by Palla and colleagues (2005; over 3000 citations in Google Scholar). Therefore, it will be important to investigate overlapping community structure across a broader range of algorithms; for a different approach than the one adopted here, see Yeo et al. (2014). Some of the advantages of the method employed here include its scalability to massive networks given the new methods used for stochastic variational inference (these scale only linearly on the variables of interest, such as the number of node pairs and the number of communities). An important feature of the method is the ability to provide continuous membership values (from 0 to 1) that indicate the extent to which a node belongs to each community, which is in contrast to other methods that treat overlap as binary (present/absent). An important limitation of the present method is that the results depend on the parameter K, the number of communities. However, the probabilistic nature of the method enables the use of predictive methods to find the best model fit given the data, thereby assuaging this problem somewhat. Nevertheless, a more complete investigation of the overlapping community structure as a function of the number of communities is warranted. Another limitation of the method is that it does not accept weighted edges, thus requiring a binarization step. Here, we binarized the data with a thresholding method that identifies edges that are consistently among the strongest links for each participant. Nevertheless, in general, methods that avoid binarization may uncover important information in networks (Goulas et al., 2014), and the study of overlapping community structure with weighted networks should be pursued in future studies.
Finally, we note the large difference in the amount of data available for resting-state and task data. Because we used Human Connectome Project data, task data were limited to relatively short scans with less than 200 volumes. Therefore, the estimates for overlapping community structure are considerably more robust for the rest data, and additional evaluation of task data is required.
5. Conclusions
Our investigation was driven by the idea that large-scale brain networks will benefit from a mixed-membership or overlapping characterization. While much work has described the brain in terms of disjoint clusters, this type of characterization does not capture the flexible and task dependent mapping between brain regions and their functions. Work that emphasizes the important role of hubs that simultaneously participate in multiple networks is an important step in the direction of a richer description of brain networks. However, the present work suggests that an even more interwoven community organization may exist. Among others, our analysis of rest and task data revealed several properties of overlapping brain networks. 1) Overlapping brain networks exhibited general features that resemble those of standard disjoint clustering; however, community membership values spanned the whole range, from weak (closer to 0) to strong (closer to 1), showing that disjoint clustering discretizes important information regarding the association of brain regions to multiple networks – thus, disjoint communities do not capture the information that is present in mixed communities. 2) Functional diversity of brain regions (that is, the range of functions they participate in) was linearly associated with membership diversity (that is, the extent to which a brain region participates across multiple networks). 3) Task performance substantially altered the structure of functional connectivity across brain regions, and 4) enhanced communicability across the brain (that is, modularity decreased during tasks relative to rest). 5) We were also able to study the distribution of “bridge” nodes, including bottleneck and hub bridges. Task performance altered the role of regions in important ways. We conclude that overlapping network methods provide a promising framework to investigate the structure of large-scale brain networks during both rest and tasks states.
Supplementary Material
Acknowledgments
This work was supported in part by the National Institute of Mental Health (MH071589). We thank Srikanth Padmala for discussions and the reviewers for feedback. Data were provided by the Human Connectome Project, WU-Minn Consortium (Principal Investigators: David Van Essen and Kamil Ugurbil; 1U54MH091657) funded by the 16 NIH Institutes and Centers that support the NIH Blueprint for Neuroscience Research, and by the McDonnell Center for Systems Neuroscience at Washington University. The authors acknowledge the Behavioral and Social Sciences College, University of Maryland high performance computing resources (http://bsos.umd.edu/oacs/bsos-high-performance) made available for conducting the research reported in this paper.
Footnotes
Publisher's Disclaimer: This is a PDF file of an unedited manuscript that has been accepted for publication. As a service to our customers we are providing this early version of the manuscript. The manuscript will undergo copyediting, typesetting, and review of the resulting proof before it is published in its final citable form. Please note that during the production process errors may be discovered which could affect the content, and all legal disclaimers that apply to the journal pertain.
References
- Airoldi EM, Blei D, Erosheva EA, Fienberg SE. Handbook of Mixed Membership Models and Their Applications. CRC Press; 2014. [Google Scholar]
- Airoldi EM, Blei DM, Fienberg SE, Xing EP. Mixed Membership Stochastic Blockmodels. Journal of machine learning research : JMLR. 2008;9:1981–2014. [PMC free article] [PubMed] [Google Scholar]
- Alexander GE, DeLong MR, Strick PL. Parallel organization of functionally segregated circuits linking basal ganglia and cortex. Annual Review of Neuroscience. 1986;9:357–381. doi: 10.1146/annurev.ne.09.030186.002041. [DOI] [PubMed] [Google Scholar]
- Amaral DG, Price JL, Pitkanen A, Carmichael ST. Anatomical organization of the primate amygdaloid complex. In: Aggleton J, editor. The Amygdala: neurobiological aspects of emotion, memory, and mental dysfunction. Wiley-Liss; New York: 1992. pp. 1–66. [Google Scholar]
- Anderson ML, Kinnison J, Pessoa L. Describing functional diversity of brain regions and brain networks. Neuroimage. 2013;73:50–58. doi: 10.1016/j.neuroimage.2013.01.071. [DOI] [PMC free article] [PubMed] [Google Scholar]
- Bechtel W, Richardson RC. Discovering complexity: Decomposition and localization as strategies in scientific research. Princeton University Press; Princeton, NJ: 1993. [Google Scholar]
- Buckner RL, Krienen FM, Yeo BTT. Opportunities and limitations of intrinsic functional connectivity MRI. Nature neuroscience. 2013;16:832–837. doi: 10.1038/nn.3423. [DOI] [PubMed] [Google Scholar]
- Bzdok D, Laird AR, Zilles K, Fox PT, Eickhoff SB. An investigation of the structural, connectional, and functional subspecialization in the human amygdala. Human brain mapping. 2013;34:3247–3266. doi: 10.1002/hbm.22138. [DOI] [PMC free article] [PubMed] [Google Scholar]
- Calhoun VD, Adali T, Pearlson GD, Pekar JJ. Spatial and temporal independent component analysis of functional MRI data containing a pair of task-related waveforms. Human brain mapping. 2001;13:43–53. doi: 10.1002/hbm.1024. [DOI] [PMC free article] [PubMed] [Google Scholar]
- Chen D, Shang M, Lv Z, Fu Y. Detecting overlapping communities of weighted networks via a local algorithm. Physica A: Statistical Mechanics and its Applications. 2010;389:4177–4187. [Google Scholar]
- Cocchi L, Zalesky A, Fornito A, Mattingley JB. Dynamic cooperation and competition between brain systems during cognitive control. Trends in cognitive sciences. 2013;17:493–501. doi: 10.1016/j.tics.2013.08.006. [DOI] [PubMed] [Google Scholar]
- Cole MW, Bassett DS, Power JD, Braver TS, Petersen SE. Intrinsic and task-evoked network architectures of the human brain. Neuron. 2014;83:238–251. doi: 10.1016/j.neuron.2014.05.014. [DOI] [PMC free article] [PubMed] [Google Scholar]
- Cole MW, Reynolds JR, Power JD, Repovs G, Anticevic A, Braver TS. Multitask connectivity reveals flexible hubs for adaptive task control. Nature Neuroscience. 2013;16:1348–1355. doi: 10.1038/nn.3470. [DOI] [PMC free article] [PubMed] [Google Scholar]
- Cole MW, Pathak S, Schneider W. Identifying the brain’s most globally connected regions. Neuroimage. 2010;49:3132–3148. doi: 10.1016/j.neuroimage.2009.11.001. [DOI] [PubMed] [Google Scholar]
- Cox RW. AFNI: Software for analysis and visualization of functional magnetic resonance neuroimages. Computers and Biomedical Research. 1996;29:162–173. doi: 10.1006/cbmr.1996.0014. [DOI] [PubMed] [Google Scholar]
- Duda RO, Hart PE, Stork DG. Pattern classification. John Wiley & Sons; 2012. [Google Scholar]
- Efron B. Bootstrap methods: another look at the jackknife. The Annals of Statistics. 1979:1–26. [Google Scholar]
- Fischl B. FreeSurfer. Neuroimage. 2012;62:774–781. doi: 10.1016/j.neuroimage.2012.01.021. [DOI] [PMC free article] [PubMed] [Google Scholar]
- Fortunato S. Community detection in graphs. Physics Reports. 2010;486:75–174. [Google Scholar]
- Friston KJ. Modes or models: a critique on independent component analysis for fMRI. Trends in cognitive sciences. 1998;2:373–375. doi: 10.1016/s1364-6613(98)01227-3. [DOI] [PubMed] [Google Scholar]
- Gavin A-C, Bösche M, Krause R, Grandi P, Marzioch M, Bauer A, Schultz J, Rick JM, Michon A-M, Cruciat C-M. Functional organization of the yeast proteome by systematic analysis of protein complexes. Nature. 2002;415:141–147. doi: 10.1038/415141a. [DOI] [PubMed] [Google Scholar]
- Glasser MF, Sotiropoulos SN, Wilson JA, Coalson TS, Fischl B, Andersson JL, Xu J, Jbabdi S, Webster M, Polimeni JR. The minimal preprocessing pipelines for the Human Connectome Project. Neuroimage. 2013;80:105–124. doi: 10.1016/j.neuroimage.2013.04.127. [DOI] [PMC free article] [PubMed] [Google Scholar]
- Good BH, de Montjoye YA, Clauset A. Performance of modularity maximization in practical contexts. Physical review. E, Statistical, nonlinear, and soft matter physics. 2010;81:046106. doi: 10.1103/PhysRevE.81.046106. [DOI] [PubMed] [Google Scholar]
- Gopalan PK, Blei DM. Efficient discovery of overlapping communities in massive networks. Proceedings of the National Academy of Sciences. 2013;110:14534–14539. doi: 10.1073/pnas.1221839110. [DOI] [PMC free article] [PubMed] [Google Scholar]
- Gordon EM, Laumann TO, Adeyemo B, Petersen SE. Individual Variability of the System-Level Organization of the Human Brain. Cerebral Cortex. 2015:bhv239. doi: 10.1093/cercor/bhv239. [DOI] [PMC free article] [PubMed] [Google Scholar]
- Goulas A, Schaefer A, Margulies DS. The strength of weak connections in the macaque cortico-cortical network. Brain Structure and Function. 2014:1–13. doi: 10.1007/s00429-014-0836-3. [DOI] [PubMed] [Google Scholar]
- Guimera R, Amaral LAN. Cartography of complex networks: modules and universal roles. Journal of Statistical Mechanics: Theory and Experiment. 2005;2005:P02001. doi: 10.1088/1742-5468/2005/02/P02001. [DOI] [PMC free article] [PubMed] [Google Scholar]
- Guimera R, Nunes Amaral LA. Functional cartography of complex metabolic networks. Nature. 2005;433:895–900. doi: 10.1038/nature03288. [DOI] [PMC free article] [PubMed] [Google Scholar]
- Hagmann P, Cammoun L, Gigandet X, Meuli R, Honey CJ, Wedeen VJ, Sporns O. Mapping the structural core of human cerebral cortex. PLoS biology. 2008;6:e159. doi: 10.1371/journal.pbio.0060159. [DOI] [PMC free article] [PubMed] [Google Scholar]
- Hariri AR, Bookheimer SY, Mazziotta JC. Modulating emotional responses: effects of a neocortical network on the limbic system. Neuroreport. 2000;11:43–48. doi: 10.1097/00001756-200001170-00009. [DOI] [PubMed] [Google Scholar]
- Hilgetag CC, O’Neill MA, Young MP. Indeterminate organization of the visual system. Science. 1996;271:776–777. doi: 10.1126/science.271.5250.776. [DOI] [PubMed] [Google Scholar]
- Hoffman MD, Blei DM, Wang C, Paisley J. Stochastic Variational Inference. The Journal of Machine Learning Research. 2013;14:1303–1347. [Google Scholar]
- Jones E. The Thalamus Revisited. Cambridge University Press; Cambridge: 2006. [Google Scholar]
- Kirby LAJ, Robinson JL. Affective mapping: An activation likelihood estimation (ALE) meta-analysis. Brain and Cognition. 2015 doi: 10.1016/j.bandc.2015.04.006. [DOI] [PubMed] [Google Scholar]
- Laird AR, Lancaster JL, Fox PT. BrainMap: the social evolution of a human brain mapping database. Neuroinformatics. 2005;3:65–78. doi: 10.1385/ni:3:1:065. [DOI] [PubMed] [Google Scholar]
- Lancaster JL, Laird AR, Eickhoff SB, Martinez MJ, Fox PM, Fox PT. Automated regional behavioral analysis for human brain images. Frontiers in neuroinformatics. 2012;6 doi: 10.3389/fninf.2012.00023. [DOI] [PMC free article] [PubMed] [Google Scholar]
- Lancichinetti A, Fortunato S, Kertész J. Detecting the overlapping and hierarchical community structure in complex networks. New Journal of Physics. 2009;11:033015. [Google Scholar]
- Magurran AE. Measuring Biological Diversity. Blackwell; Oxford, United Kingdom: 2004. [Google Scholar]
- Marcus DS, Harwell J, Olsen T, Hodge M, Glasser MF, Prior F, Jenkinson M, Laumann T, Curtiss SW, Van Essen DC. Informatics and data mining tools and strategies for the human connectome project. Frontiers in neuroinformatics. 2011;5 doi: 10.3389/fninf.2011.00004. [DOI] [PMC free article] [PubMed] [Google Scholar]
- Mesulam MM. A cortical network for directed attention and unilateral neglect. Annals of Neurology. 1981;10:309–325. doi: 10.1002/ana.410100402. [DOI] [PubMed] [Google Scholar]
- Mesulam MM. From sensation to cognition. Brain. 1998;121:1013–1052. doi: 10.1093/brain/121.6.1013. [DOI] [PubMed] [Google Scholar]
- Middleton FA, Strick PL. Basal ganglia and cerebellar loops: motor and cognitive circuits. Brain research reviews. 2000;31:236–250. doi: 10.1016/s0165-0173(99)00040-5. [DOI] [PubMed] [Google Scholar]
- Miller EK, Cohen JD. An integrative theory of prefrontal cortex function. Annual Review of Neuroscience. 2001;24:167–202. doi: 10.1146/annurev.neuro.24.1.167. [DOI] [PubMed] [Google Scholar]
- Mueller S, Wang D, Fox MD, Yeo BT, Sepulcre J, Sabuncu MR, Shafee R, Lu J, Liu H. Individual variability in functional connectivity architecture of the human brain. Neuron. 2013;77:586–595. doi: 10.1016/j.neuron.2012.12.028. [DOI] [PMC free article] [PubMed] [Google Scholar]
- Nepusz T, Petróczi A, Négyessy L, Bazsó F. Fuzzy communities and the concept of bridgeness in complex networks. Physical Review E. 2008;77:016107. doi: 10.1103/PhysRevE.77.016107. [DOI] [PubMed] [Google Scholar]
- Newman ME. Modularity and community structure in networks. Proceedings of the National Academy of Sciences. 2006;103:8577–8582. doi: 10.1073/pnas.0601602103. [DOI] [PMC free article] [PubMed] [Google Scholar]
- Palla G, Derenyi I, Farkas I, Vicsek T. Uncovering the overlapping community structure of complex networks in nature and society. Nature. 2005;435:814–818. doi: 10.1038/nature03607. [DOI] [PubMed] [Google Scholar]
- Passingham RE, Stephan KE, Kotter R. The anatomical basis of functional localization in the cortex. Nature Reviews Neuroscience. 2002;3:606–616. doi: 10.1038/nrn893. [DOI] [PubMed] [Google Scholar]
- Pessoa L. The Cognitive-Emotional Brain: From Interactions to Integration. MIT Press; Cambridge: 2013. [Google Scholar]
- Pessoa L. Understanding brain networks and brain organization. Physics of Life Reviews. 2014;11:400–435. doi: 10.1016/j.plrev.2014.03.005. [DOI] [PMC free article] [PubMed] [Google Scholar]
- Poldrack RA. Can cognitive processes be inferred from neuroimaging data? Trends in Cognitive Sciences. 2006;10:59–63. doi: 10.1016/j.tics.2005.12.004. [DOI] [PubMed] [Google Scholar]
- Poldrack RA, Halchenko YO, Hanson SJ. Decoding the large-scale structure of brain function by classifying mental states across individuals. Psychological Science. 2009;20:1364–1372. doi: 10.1111/j.1467-9280.2009.02460.x. [DOI] [PMC free article] [PubMed] [Google Scholar]
- Power JD, Barnes KA, Snyder AZ, Schlaggar BL, Petersen SE. Spurious but systematic correlations in functional connectivity MRI networks arise from subject motion. Neuroimage. 2012;59:2142–2154. doi: 10.1016/j.neuroimage.2011.10.018. [DOI] [PMC free article] [PubMed] [Google Scholar]
- Power JD, Schlaggar BL, Lessov-Schlaggar CN, Petersen SE. Evidence for hubs in human functional brain networks. Neuron. 2013;79:798–813. doi: 10.1016/j.neuron.2013.07.035. [DOI] [PMC free article] [PubMed] [Google Scholar]
- Rakic P, Bourgeois JP, Eckenhoff MF, Zecevic N, Goldman-Rakic PS. Concurrent overproduction of synapses in diverse regions of the primate cerebral cortex. Science. 1986;232:232–235. doi: 10.1126/science.3952506. [DOI] [PubMed] [Google Scholar]
- Rubinov M, Sporns O. Weight-conserving characterization of complex functional brain networks. Neuroimage. 2011;56:2068–2079. doi: 10.1016/j.neuroimage.2011.03.069. [DOI] [PubMed] [Google Scholar]
- Saad ZS, Reynolds RC. Suma. Neuroimage. 2012;62:768–773. doi: 10.1016/j.neuroimage.2011.09.016. [DOI] [PMC free article] [PubMed] [Google Scholar]
- Salimi-Khorshidi G, Douaud G, Beckmann CF, Glasser MF, Griffanti L, Smith SM. Automatic denoising of functional MRI data: Combining independent component analysis and hierarchical fusion of classifiers. Neuroimage. 2014;90:449–468. doi: 10.1016/j.neuroimage.2013.11.046. [DOI] [PMC free article] [PubMed] [Google Scholar]
- Seghier ML. The angular gyrus multiple functions and multiple subdivisions. The Neuroscientist. 2013;19:43–61. doi: 10.1177/1073858412440596. [DOI] [PMC free article] [PubMed] [Google Scholar]
- Shallice T. From neuropsychology to mental structure. Cambridge University Press; New York: 1988. [Google Scholar]
- Shallice T, Cooper RP. The Organisation of Mind. Oxford University Press; Oxford: 2011. [Google Scholar]
- Shannon CE. A mathematical theory of communication. The Bell System Technical Journal. 1948;27:379–423. 623–656. [Google Scholar]
- Sherman SM, Guillery RW. Functional connections of cortical areas: a new view from the thalamus. MIT Press; 2013. [Google Scholar]
- Smith SM, Beckmann CF, Andersson J, Auerbach EJ, Bijsterbosch J, Douaud G, Duff E, Feinberg DA, Griffanti L, Harms MP, Kelly M, Laumann T, Miller KL, Moeller S, Petersen S, Power J, Salimi-khorshidi G, Snyder AZ, Vu AT, Woolrich MW, Xu J, Yacoub E, Kamil U, Essen DCV, Glasser MF, Consortium W-mHCP. Resting-state fMRI in the Human Connectome Project. 2013;80:144–168. doi: 10.1016/j.neuroimage.2013.05.039. [DOI] [PMC free article] [PubMed] [Google Scholar]
- Smith SM, Fox PT, Miller KL, Glahn DC, Fox PM, Mackay CE, Filippini N, Watkins KE, Toro R, Laird AR. Correspondence of the brain’s functional architecture during activation and rest. Proceedings of the National Academy of Sciences. 2009;106:13040–13045. doi: 10.1073/pnas.0905267106. [DOI] [PMC free article] [PubMed] [Google Scholar]
- Smith SM, Miller KL, Moeller S, Xu J, Auerbach EJ, Woolrich MW, Beckmann CF, Jenkinson M, Andersson J, Glasser MF, Van Essen DC, Feinberg DA, Yacoub ES, Ugurbil K. Temporally-independent functional modes of spontaneous brain activity. Proceedings of the National Academy of Sciences USA. 2012;109:3131–3136. doi: 10.1073/pnas.1121329109. [DOI] [PMC free article] [PubMed] [Google Scholar]
- Sreenivasan KK, Curtis CE, D’Esposito M. Revisiting the role of persistent neural activity during working memory. Trends in cognitive sciences. 2014;18:82–89. doi: 10.1016/j.tics.2013.12.001. [DOI] [PMC free article] [PubMed] [Google Scholar]
- Tomasi D, Volkow ND. Functional connectivity hubs in the human brain. Neuroimage. 2011;57:908–917. doi: 10.1016/j.neuroimage.2011.05.024. [DOI] [PMC free article] [PubMed] [Google Scholar]
- Van Essen DC, Smith SM, Barch DM, Behrens TEJ, Yacoub E, Ugurbil K. The WU-Minn human connectome project: an overview. Neuroimage. 2013;80:62–79. doi: 10.1016/j.neuroimage.2013.05.041. [DOI] [PMC free article] [PubMed] [Google Scholar]
- Wager TD, Barrett LF, Bliss-Moreau E, Lindquist K, Duncan S, Kober H, Joseph J, Davidson M, Mize J. The neuroimaging of emotion. Handbook of emotions. 2008;3:249–271. [Google Scholar]
- Wasserman S, Faust K. Social network analysis: Methods and applications. Cambridge university press; 1994. [Google Scholar]
- Xie J. Overlapping Community Detection in Networks : The State-of-the-Art. 2013;45 [Google Scholar]
- Yeo BT, Krienen FM, Chee MW, Buckner RL. Estimates of segregation and overlap of functional connectivity networks in the human cerebral cortex. Neuroimage. 2014;88:212–227. doi: 10.1016/j.neuroimage.2013.10.046. [DOI] [PMC free article] [PubMed] [Google Scholar]
- Yeo BT, Krienen FM, Sepulcre J, Sabuncu MR, Lashkari D, Hollinshead M, Roffman JL, Smoller JW, Zollei L, Polimeni JR, Fischl B, Liu H, Buckner RL. The organization of the human cerebral cortex estimated by intrinsic functional connectivity. Journal of neurophysiology. 2011;106:1125–1165. doi: 10.1152/jn.00338.2011. [DOI] [PMC free article] [PubMed] [Google Scholar]
- Yu H, Kim PM, Sprecher E, Trifonov V, Gerstein M. The importance of bottlenecks in protein networks: correlation with gene essentiality and expression dynamics. PLoS Comput Biol. 2007;3:e59. doi: 10.1371/journal.pcbi.0030059. [DOI] [PMC free article] [PubMed] [Google Scholar]
Associated Data
This section collects any data citations, data availability statements, or supplementary materials included in this article.


