

Abstract
Background and purpose
In treating glioblastoma (GB), surgical and chemotherapeutic treatment guidelines are, for the most part, independent of tumor location. In this work, we compiled imaging data from a large cohort of GB patients to create statistical atlases illustrating the disease spatial frequency as a function of patient demographics as well as tumor characteristics.
Materials and methods
Two-hundred-six patients with pathology-proven glioblastoma were included. Of those, 65 had pathology-proven recurrence and 113 had molecular subtype and genetic information. We used validated software to segment the tumors in all patients and map them from patient space into a common template. We then created statistical maps that described the spatial location of tumors with respect to demographics and tumor characteristics. We applied a chi-square test to determine whether pattern differences were statistically significant.
Results
The most frequent location for glioblastoma in our patient population is the right temporal lobe. There are statistically significant differences when comparing patterns using demographic data such as gender (p = 0.0006) and age (p = 0.006). Small and large tumors tend to occur in separate locations (p = 0.0007). The tumors tend to occur in different locations according to their molecular subtypes (p < 10− 6). The classical subtype tends to spare the frontal lobes, the neural subtype tend to involve the inferior right frontal lobe. Although the sample size is limited, there was a difference in location according to EGFR VIII genotype (p < 10− 4), with a right temporal dominance for EFGR VIII negative tumors, and frontal lobe dominance in EGFR VIII positive tumors.
Conclusions
Spatial location of GB is an important factor that correlates with demographic factors and tumor characteristics, which should therefore be considered when evaluating a patient with GB and might assist in personalized treatment.
Keywords: MRI, Glioblastoma, Statistical, Atlas, Spatial
Highlights
-
•
Atlases of spatial distribution of glioblastoma are created.
-
•
Atlases are specific to patient characteristics such as age and gender.
-
•
Atlases are specific to tumor characteristics such as size and molecule subtype.
-
•
Atlases are specific to tumor genetics.
-
•
Spatial location should be considered when evaluating a patient with glioblastoma.
1. Introduction
Glioblastoma (GB) is the most aggressive adult primary brain neoplasm and accounts for 54% of all glial tumors. Despite recent diagnostic and therapeutic advances, the prognosis remains poor with a reported median survival of only about 14 months (Van Meir et al., 2010). The current standard of care for newly diagnosed GB is maximal safe resection and concurrent temozolomide (TMZ) and radiation therapy. The persistent unfavorable prognosis has prompted continued efforts to better understand the behavior of this neoplasm, particularly in terms of recurrence. Although there is evidence that tumor location correlates with prognosis, surgical and chemotherapeutic treatment guidelines are, for the most part, independent of tumor location, except for the attention given to surrounding eloquent structures at surgery.
Probabilistic atlases have become a key component of structural and functional analysis in image-based neurosciences (Lee and Lee, 2005). Benefiting from the development of spatial normalization techniques, they allow for meaningful assessments of brain anatomical or pathological features due to several advantages. First, they provide a population-based standard foundation for comparing a subject’s brain characteristics to that of his or her peers in the same population (Thompson et al., 2000). Second, by construction, statistical atlases are more accurate in their representation of a particular population than models built on a single subject or other type of general knowledge. Third, statistical atlases integrate information on individual variability and can reveal important population trends that might be difficult to appreciate otherwise (Bilello et al., 2006).
In this work, we compiled imaging data from a large cohort of GB patients to create statistical atlases illustrating the tumoral spatial frequency as a function of several demographic factors, such as age and gender. In addition, we constructed atlases related to spatial location of GB tumor recurrence, molecular mutation, and molecular class using a subset of these patients with pathologically confirmed neoplastic recurrence. Other investigators have created similar atlases for low-grade gliomas (Parisot et al., 2016).
We investigated whether these tumors are distributed uniformly or whether certain brain regions are relatively more vulnerable to tumor formation in certain patient sub-populations. We hypothesize that spatial localization of tumor will be specific to site of tumor origin or molecular features of the tumor. Further delineation of such spatial patterns may increase understanding of underlying tumor pathophysiology and can inform diagnosis and treatment, especially as it relates to the likelihood of tumor occurrence at a given location.
2. Materials and methods
2.1. Subjects
Two hundred and six patients with newly diagnosed, pathology-proven GB were included in this retrospective, HIPAA-compliant, IRB-approved study. All patients underwent imaging at time of diagnosis utilizing the brain tumor MRI protocol of the Hospital of the University of Pennsylvania between 2006 and 2013. All patients underwent maximal safe resection, radiotherapy, and concomitant and adjuvant chemotherapy with temozolomide, according to standard of care. Surveillance MRI scans were obtained as clinically warranted. Of those 206 patients, 65 had disease recurrence, which was pathology-proven after re-resection. The time to recurrence was the time elapsed between the initial MRI scan and the follow-up MRI scan that preceded the re-resection, with recurrence demonstrated on pathology.
2.2. MRI protocol
All images were acquired on a Siemens TrioTim 3.0 Tesla scanner and included the following sequences: pre- and post-gadolinium axial high-resolution, 1-mm isotropic T1, 3D MPRAGE (magnetization-prepared gradient echo), axial 2D T2-FLAIR (fluid-attenuated inversion recovery), axial 2D T2-weighted.
2.3. Image processing
To construct the brain tumor atlas that captures the statistics of the spatial distribution of GB in the population, we have employed Glioma Image Segmentation and Registration (GLISTR) software developed in our lab (Gooya et al., 2012). The program uses the T2-FLAIR, T2, and pre- and post-gadolinium T1 sequences. In this scheme, the tumor segmentation includes both enhancing and non-enhancing necrotic components. The segmented tumor of each patient is then registered into the common atlas space.
GLISTR simultaneously registers a probabilistic atlas of a healthy population to the MR images with glioblastoma and segments the images into enhancing and non-enhancing tumor, peritumoral edema, and healthy tissue labels. This method uses the Expectation Maximization (EM) algorithm, and incorporates a tumor growth model, a process which modifies the original atlas into an image with tumor and edema adapted to best match a given set of patient images. The modified atlas is registered into the patient images, and then GLISTR utilizes this process for estimating the posterior probabilities of various tissue labels. EM iteratively refines the estimates of the posterior probabilities of tissue labels, the deformation field, and the tumor growth model parameters. The deformation field takes into account the mass effect produced by the tumor. Therefore, GLISTR has a framework for joint segmentation and non-linear registration that is guided by the atlas. The inverted deformation field warps the patient images into the common atlas space. The mass effect was relaxed in the atlas-normalized images, hence the ventricles seem to be decompressed compared to the original patients’ scans. This method thus incorporates a tumor growth model to adapt the normal atlas into the anatomy of the patient brain (Gooya et al., 2012).
2.4. Statistical atlases
The statistical atlases are constructed by superimposing all warped label maps over the patient population based on different groups, including entire population, age, gender, size of tumor, and tumor recurrence, and computing the spatial frequency of tumor occurrence at each voxel in the template space. The frequency is then color coded for easier visualization. For a group of tumors (T1, T2, …, TN), where a tumor Tn is defined here as the cluster of voxels corresponding to enhancing and necrotic components. The statistical atlas at voxel i is computed as the number of tumors that intersect voxel i divided by N, the total number of tumors used to build the atlas.
To visualize age-related distributions, we divided the subjects into two age groups, younger or older than the median age. Similarly, to display the effect of tumor volume on spatial distribution, we separated the lesions into 2 groups, i.e., smaller or larger than the median of tumor volumes. We used the median time to recurrence (6.7 months) to divide patients according to time to recurrence. For survival, the patients were divided into two groups based on the median (14.6 months), and the chi-square statistical test was performed. Then, to enhance the difference in the short survival patients, these patients were divided again based on their median (6 months). Therefore, short, intermediate, and long survival times were determined relative to 6 months and 14.6 months.
2.5. Statistical analysis
Distribution pattern analysis is employed in this study to demonstrate spatial relationships among subjects in the dataset. We examine the spatial relationship among the location of the tumors in the template brain, which has been parcellated into several regions of interests (ROI). The spatial analysis method of describing the dataset pattern is performed through frequency of tumor occurrence in each ROI. One of the most common and useful ways to examine differences between two sets with categorical variables is the Pearson’s chi-square test, which evaluates the likelihood that any observed difference between the sets arises by chance (Agresti and Kateri, 2011).
The null hypothesis is that the number of tumors in each ROI is spatially random (Poisson distribution). A spatial Poisson process or complete spatial randomness (CSR) describes a point distribution process within a given study area that is completely random. The process is modeled using only one parameter, i.e., the number of tumors in each ROI, normalized by the ROI size. The expected and observed point distribution is calculated using the Poisson distribution, and then the statistical chi-square test is used to infer properties about the dataset, i.e., whether the spatial point patterns are random, clustered or dispersed. Thus, the chi-square test is used to determine whether we should reject or fail to reject the spatial randomness hypothesis. Then, all patients were divided to two groups based on median of age, size of tumor, survival, time to recurrence, gender, and EGFR VIII status. Each pair of tumor distributions was separately compared through Pearson’s chi-square test to identify whether or not the distributions of tumors between two groups are different. The median was selected as the threshold to divide the patients to two groups to have almost equal number in each group. A p value less or equal to 0.05 was considered statistically significant.
3. Results
3.1. Patient population
Table 1 contains details about subject demographics, tumor characteristics, such as volume and molecular subtype, and time to recurrence. The most frequent tumor location in our patient population was the frontotemporal region, perisylvian region, around the temporal horns, with slightly higher probability on the right, with other significant clusters in the frontal lobes and left frontoparietal region (Fig. 1). The highest probability is associated with the subcortical white matter with extension to the grey matter for tumors in the temporal lobe. There is otherwise a diffuse distribution, bilateral occipital lobes being relatively spared, while the posterior fossa is completely uninvolved. The frequency distribution is different from a Poisson’s distribution (p = 8.5 × 10− 18).
Table 1.
Subject demographics and tumor characteristics.
| Gender |
EGFR VIII |
Subtype |
|||||
|---|---|---|---|---|---|---|---|
| Male | Female | Negative | Positive | M | N | PN | CL |
| 116 | 90 | 49 | 15 | 30 | 34 | 28 | 21 |
| Survival (Months) | Less than 6 | Between 6 & 14.6 | More than 14.6 | ||||
| Number | 47 | 49 | 102 | ||||
| Max | Min | Mean | Median | Std | |||
| Age (Years) | 88 | 22 | 62 | 62 | 12.3 | ||
| Volume (cm3) | 62.2 | 1.9 | 13.1 | 11.1 | 8.42 | ||
| TTRa (Months) | 34.5 | 1.0 | 8.2 | 6.7 | 6.37 | ||
Abbreviations: EGFR = epidermal growth factor receptor, M = mesenchymal, N = neural, PN = proneural, CL = classical, std = standard deviation, TTR = Time to Recurrence.
65 subjects with recurrence.
Fig. 1.
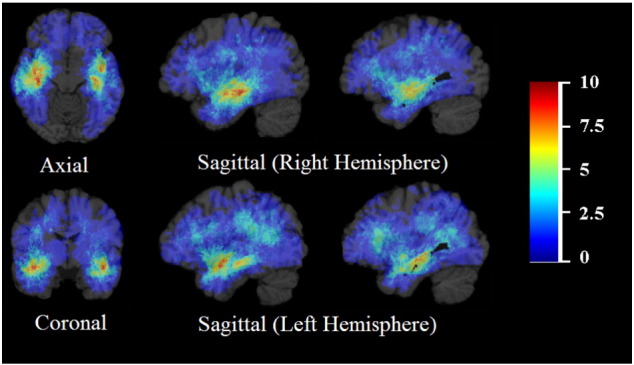
Frequency distribution of tumor (all subjects). The color look-up table shows the frequency in percent. All images were displayed in the radiological convention orientation.
3.2. Age
When subjects are stratified by age, as in Fig. 2, the tumors localize to the bilateral frontotemporal lobes in older patients, and involve more the periventricular frontal lobes in younger patients. There is more frequent involvement of the superior, subcortical frontal lobes in older patients, as well as complete sparing of the occipital lobes. No tumors were found in the cerebellum. The tumor distribution in younger patients (< 62 years) is significantly different from that in older patients (> 62 years) (p = 0.006).
Fig. 2.

Frequency distribution of tumor by age, gender, size of tumor, time to recurrence (TTR), and EGFR VIII status. The color look-up table shows the frequency in percent. All images were displayed in the radiological convention orientation.
3.3. Gender
Fig. 2 displays the distribution of tumors by gender. In women, there is a strong, asymmetric right temporal cluster, whereas in men, the left temporal lobe is more involved. These differences extend to the periventricular frontal regions (right for women, left for men). There is a statistically significant difference between the distributions of tumors in women and men (p = 0.0006).
Additionally, t-test was utilized to evaluate the size of tumors in men and women. There was a statistically significant (p = 0.005) difference in size of tumor between men and women. The mean tumor size was 11.701 cm3 for men vs. 15.021 cm3 for women. The size of enhancing tumor was also found to be significantly different (p = 0.01) between the genders, 6.790 cm3 for men vs. 8.649 cm3 for women.
There was also a statistically significant (p = 0.01) difference in size of necrotic tumor between women and men, 4.9 cm3 for men vs. 6.4 cm3 for women. However, the size of enhancing and necrotic tumor was larger in women because the total tumor size is larger. In other words, there was no statistically significant difference in the relative proportion of enhancing or necrotic components. Moreover, the difference of size of surrounding T2-FLAIR signal abnormality between men and women was not significantly different.
3.4. Tumor volume
In Fig. 2, the distributions with respect to volume of tumors are displayed. There is a clear distinction with regards to localization in the frontotemporal regions, where large tumors tend to occur on the right side, and small tumors on the left. These differences extend to the periventricular frontal regions. Other important clusters include the right frontal lobe and right thalamus. The distribution of large tumors differs significantly to that of small tumors (p = 0.0007).
3.5. Time to recurrence
Among the cases with documented recurrence, we divided the tumors in two groups, by the median time to recurrence (6.7 months). The atlas is shown in Fig. 2. There is a high likelihood cluster of short time to recurrence tumors in the left frontal lobe, while long time to recurrence tumors appear to occur with high probability in the right temporal lobe. The distribution of the tumors with short time to recurrence differs significantly to that of long time to recurrence tumors (p = 0.001).
3.6. Survival
Tumors associated with short survival tend to occur in the left frontotemporal region, whereas tumors associated with long survival occur more frequently in the right frontotemporal region, as well as in the frontal lobes, as shown in Fig. 3. The distribution of the tumors with short survival differs significantly to that of long survival (divided by median) with p = 0.0008.
Fig. 3.

Frequency distribution by survival. The color look-up table shows the frequency in percent. All images were displayed in the radiological convention orientation.
3.7. EGFR VIII status
As shown in Fig. 2, there is a strong right frontotemporal cluster of tumor occurrence in subjects with EGFR VIII negative tumors, which is absent in the subgroup with EGFR VIII positive tumors. There is also frontal lobe dominance in EGFR VIII positive tumors. The distribution of the tumors with positive EGFR VIII status differs significantly to that of negative EGFR VIII negative tumors (p = 0.00009).
3.8. Molecular subtype
There was a statistically significant difference in the distribution of tumors according to molecular subtype (p = 3.4 × 10− 7) as shown in Fig. 4. The distribution for the classical was particularly different from the others, probably because of its lack of anterior frontal lobe involvement. In addition, there is distinct inferior right frontal lobe involvement in the neural subtype.
Fig. 4.

Frequency distribution by molecular subtype. All images were displayed in the radiological convention orientation.
4. Discussion
Based on MR images from a large cohort of patients with de novo GB, we created distinct spatial maps of tumor location as a function of several patient, tumor, and molecular features. Enhancing and non-enhancing tumor regions on MR images were segmented and then registered to a normalized atlas in order to generate statistical maps specific to age, gender, tumor volume, time to recurrence, survival, and tumor molecular status. Differences between maps were then compared using distribution pattern analysis. Such population-based MRI atlases represent the imaging phenotype for GBs in relation to multiple variables.
4.1. Tumor location
The spatial distribution of GBs in our study is consistent with findings of related studies and with the presumed sites of tumor cell origin. The detection of cancer stem cells within GBs has fueled the notion that GBs arise from altered precursor neural stem cells (Lim et al., 2007, Sanai et al., 2005), which are located primarily in a region along the walls of the lateral ventricles known as the subventricular zone (SVZ). Consequently, several studies have documented the frequent occurrence of GBs in the posterior SVZ (Kimura et al., 2013, Wang et al., 2015). Although we noted tumor in a frontoparietal periventricular white matter distribution less frequently than other groups (Ellingson et al., 2013), we found a strong bilateral frontotemporal distribution of GB, similar to a prior study (Lee et al., 2010). A SVZ exists around the temporal horns, making our findings consistent with the notion that tumor location may represent the contribution of region-specific precursor cells. Still, not all tumors in our study were intimately related to the SVZ, as we found clusters in the perisylvian area, as well as in subcortical white matter with extension to grey matter. Neural stem cells have been found in other regions of the brain, such as the dentate gyrus (Hagg, 2009). Furthermore, other studies have demonstrated that cycling progenitors distributed throughout the subcortical white matter may contribute to GB tumor growth (Bohman et al., 2010). Such cells may give rise to tumors noted away from the SVZ. Additionally, access to blood supply from large branches of the middle cerebral arteries may be an important factor in glioblastoma spatial distribution.
In our study we did not find any tumors in the cerebellum. Primary cerebellar GBM is considered a rare tumor in adults and reportedly accounts for just 1% of all cases of GBM. Due to their rarity, the exact pathogenesis and prognosis of cerebellar GBMs is not yet completely understood. It is proposed that cerebellar astrocytes have lesser tendency to become malignant (Hur et al., 2008).
4.2. Age and gender
Tumor spatial localization among GB patients differs based on age and gender. Several studies have shown a higher incidence of frontal lobe tumors in younger patients (Dunn et al., 2012, Ellingson et al., 2013, Lai et al., 2011), which is thought to be related to the co-localization of IDH1 mutant tumors to the bifrontal regions (Lai et al., 2011). The IDH1 gene encodes a metabolic enzyme called isocitrate dehydrogenase, and IDH1 mutant occurs more commonly in younger patients. Although we also noted frontal lobe involvement more frequently in younger patients, GB was more common in the periventricular frontal white matter in our cohort rather than subcortical frontal white matter in other studies (Ellingson et al., 2013). In older patients, GB was more frequently found in bilateral temporal lobes. Wang et al. noted increased frequency of bilateral temporal lobe GB among patients with advanced age, especially at the posterior region of the SVZ (Wang et al., 2015). Based on the correlation between tumor location and age, the authors hypothesized that GB has a different site of origin in younger vs. older patients.
Aside from the observation that GB occurs more frequently in males, the impact of gender on tumorigenesis in GB has not been thoroughly investigated. In an animal model of GB, MR images of male rats with high grade gliomas showed increased cell proliferation, vasogenic edema, and necrosis compared to females (Pérez-Carro et al., 2014). Furthermore, in humans, transcription factor analysis was used to show that cell death in female GB patients occurs via a signaling pathway associated with MYC, whereas it occurs in association with TP53 in male patients (Colen et al., 2015). Such gender difference may apply to other pathways within GB tumors and manifest as varying imaging phenotypes.
The differences of distribution observed between genders may be attributed to hormonal physiology, which may have spatial specificity. Sex steroids have been implicated in “gender-neutral” cancers (Folkerd and Dowsett, 2010), although no current evidence indicates that glial tumors are affected. There is, however, evidence that sex hormones are able to cross the blood-brain barrier (Brodal, 2004). The strong lateralization observed between genders is certainly intriguing, and to our knowledge, has not been reported in prior studies. In addition, our study confirms a previously reported result that tumors in women have larger areas of necrosis, perhaps accounting for a larger overall cross sectional size of the tumor (Colen et al., 2015). We also found that tumors in women are larger, but with larger enhancing components as well.
4.3. Tumor volume, time to recurrence, and survival
Differences in spatial maps of tumor size likely relate to the function of surrounding cortex. For instance, tumors in eloquent areas of the brain, even small ones, are more likely to be symptomatic and prompt medical attention earlier as compared to similarly sized tumors in non-eloquent regions. Left frontotemporal tumors, the most common site for smaller tumors in our study, may affect language centers and therefore be detected sooner. Similar reasons may explain why lesions occurring in the right thalamus are relatively small, as tumors in that location are expected to cause elevated intracranial pressure, by obstructing cerebrospinal fluid drainage, and motor deficits (Tonn et al., 2010).
Our time to recurrence atlas shows a strong cluster in the left frontal subcortical and deep white matter that was associated with rapid recurrence, whereas other authors found a periventricular distribution of GB to be associated with early recurrence (Ellingson et al., 2013). Our pattern associated with long time to recurrence was similar to results of another population-based statistical atlas in GB that showed clusters in the right temporal and left perisylvian regions (Ellingson et al., 2013). Shorter time to recurrence in some areas may be the result of limited surgical resection (e.g., to spare nearby eloquent structures, such as the language centers of the left frontotemporal lobes in most patients) or tendency for tumors in those locations to be more aggressive. However, the marked differences in spatial distribution between short and long recurrence subgroups indicates that spatial location can potentially be a valuable predictor of time to recurrence.
There are similarities between the recurrence and the survival atlases, which probably reflect the fact that early recurrence correlates with shorter survival. There is a higher frequency of periventricular tumors associated with short and medium survival, a finding that confirms results reported in a study of GB assessing the association between tumor distance to the ventricle and survival (Chaichana et al., 2008). Shorter survival was associated with a left frontotemporal cluster, whereas right-sided frontotemporal tumors had a longer survival. This appears to contradict results reported in a related study (Ellingson et al., 2013); however, the difference may be in part related to the chosen definition of short vs. long survival. The authors used < 12 months or > 36 months to define overall survival, whereas we divided survival to < 6 months, between 6 and 14.6 months, and > 14.6 months. Another study found frontal location of tumors in general to be associated with improved survival, although the study was not restricted to patients undergoing gross total resection (Simpson et al., 1993). These observations are consistent with GBs being commonly located near the SVZ and this location being associated with decreased survival (Adeberg et al., 2014, Jafri et al., 2013). It is postulated that tumors originating from this region are innately more invasive or are near a high density of subcortical fibers along which they can track.
4.4. EGFR VIII status and molecular subtype
We found a strong cluster of EGFR VIII negative tumors in the right frontotemporal region; however, our results differ from a predominance of EGFR VIII positive tumors in the left temporal lobe, as reported in a related study (Ellingson et al., 2013). The discrepancy may be due to the relatively low number of EGFR VIII positive glioblastomas in our patient population. Although there was suggestion of a bifrontal propensity in the proneural tumor distribution, as reported in the same study (Ellingson et al., 2013), we did not find a right-sided predominance in mesenchymal tumors.
The use of population-based spatial localization maps in GB, when taken together, demonstrates a complex interplay between individual patient, tumor, and molecular characteristics. For example, the EGFR mutation is a main driver of the classical subgroup; however, we found that the EGFR VIII positive map is different from the classical subtype map. In our patient cohort, EGFR VIII positive tumors were most likely to occur with frontal lobe dominance, whereas GBs of the classical subtype lacked anterior frontal lobe involvement. Similarly, the mesenchymal subtype is associated with shorter survival. Although this subtype was found mainly in the right temporal location in our study, the right temporal location was found to be more commonly associated with longer, rather than shorter survival. Other groups showed concordance with the left temporal lobe being associated with mesenchymal gene expression, IDH 1 wild type, and decreased survival (Ellingson et al., 2013). These results emphasize the complexity between molecular subtypes, defined by numerous mutations, and spatial localization.
Several patient features were lateralized based on the spatial maps. Although the exact mechanism is unclear, there are several instances of lateralization of function and genetic signature in the human brain, including hemispheric lateralization of language and spatial representations (Sun and Walsh, 2006). In terms of GB tumor genetic expression, related studies have shown the O6-methylguanine DNA methyltransferase (MGMT) promoter methylation is lateralized to the left temporal lobe while MGMT unmethylated GBs are more commonly found in the right hemisphere (Ellingson et al., 2012). Thus, our lateralized phenotypes noted for several of the molecular subtype maps, as well tumor size and recurrence maps, have multiple precedents in the human brain, although the exact mechanism is unknown. Nonetheless, such findings would not be recognized without the use of population-based MR statistical atlases.
4.5. Limitations
Our study has several limitations. One of the limitations of our work stems from the relative low number of cases on which the atlases were drawn, especially cases with genetic information. By essence, statistical atlases become more meaningful as the cases used for their construction increases. Besides the relatively small number of cases, the atlas of location frequency may be biased by disease severity. For instance, fulminant disease in certain locations may be lethal even before the patient gets imaging, although this is not supported by collective experience. Alternate methods for atlas construction exist. In the most significant similar work in the literature, (Ellingson et al., 2013) generated spatial maps using affine transformations for registration of subject data to template space. However, such an approach could considerably limit spatial localization accuracy in the presence of significant distortion and mass effect, which are typical in glioblastoma. Our method uses validated tumor growth-driven nonlinear registration to warp the patients’ scans into the template space, and hence it offers much higher localization accuracy.
Finally, as stated, more genetic information regarding the patients could have enhanced the atlases. Just like genetics probably does not explain all tumor behavior, it is not expected that the parameters we used can do that either. A multifactorial combination of genetics, demographics, physiology, including hormonal status, and lifestyle parameters is probably required, but this would necessitate significant effort in screening subject history.
5. Conclusions
The population-based MRI atlases generated in this study offer evidence that the spatial location of GB is an important factor that correlates with gender, age, tumor size, time-to-recurrence, survival, EGFR VIII genotype, and molecular subtype, and should therefore be considered along with other imaging and non-imaging variables when evaluating a GB patient. For instance, a patient with a tumor that occurs in a specific region strongly associated with early recurrence or short survival may be a candidate for more aggressive adjuvant therapy, such as radiation therapy, or early re-operation for recurrence. Although we have put forth theoretical explanations for the statistical links revealed by comparisons of spatial GB maps in this study, such mechanisms remain unproven. It is our hope that the findings of this study will generate new hypotheses on tumor pathophysiology with regard to tumor location, molecular profile, cells of origin, and the influence of surrounding brain regions.
Acknowledgments
This work was partially supported by NIH grants # R01 NS042645 and # U24 CA189523.
References
- Adeberg S., König L., Bostel T., Harrabi S., Welzel T., Debus J., Combs S.E. Glioblastoma recurrence patterns after radiation therapy with regard to the subventricular zone. Int. J. Radiat. Oncol. Biol. Phys. 2014;90:886–893. doi: 10.1016/j.ijrobp.2014.07.027. [DOI] [PubMed] [Google Scholar]
- Agresti A., Kateri M. Springer; 2011. Categorical Data Analysis. [Google Scholar]
- Bilello M., Lao Z., Krejza J., Hillis A.E., Herskovits E.H. Statistical atlas of acute stroke from magnetic resonance diffusion-weighted-images of the brain. Neuroinformatics. 2006;4:235–242. doi: 10.1385/NI:4:3:235. [DOI] [PubMed] [Google Scholar]
- Bohman L.-E., Swanson K.R., Moore J.L., Rockne R., Mandigo C., Hankinson T., Assanah M., Canoll P., Bruce J.N. Magnetic resonance imaging characteristics of glioblastoma multiforme: implications for understanding glioma ontogeny. Neurosurgery. 2010;67:1319. doi: 10.1227/NEU.0b013e3181f556ab. [DOI] [PMC free article] [PubMed] [Google Scholar]
- Brodal P. Oxford University Press; 2004. The Central Nervous System: Structure and Function. [Google Scholar]
- Chaichana K.L., McGirt M.J., Frazier J., Attenello F., Guerrero-Cazares H., Quinones-Hinojosa A. Relationship of glioblastoma multiforme to the lateral ventricles predicts survival following tumor resection. J. Neuro-Oncol. 2008;89:219–224. doi: 10.1007/s11060-008-9609-2. [DOI] [PubMed] [Google Scholar]
- Colen R., Wang J., Gutman D., Singh S., Zinn P. Imaging genomic mapping reveals gender-specific oncogenic determinants of cell death in glioblastoma. J. Nucl. Med. 2015:5. doi: 10.1148/radiol.14141800. Soc Nuclear Medicine Inc. 1850 Samuel Morse Dr, Reston, VA 20190–5316 USA. [DOI] [PubMed] [Google Scholar]
- Dunn G.P., Rinne M.L., Wykosky J., Genovese G., Quayle S.N., Dunn I.F., Agarwalla P.K., Chheda M.G., Campos B., Wang A. Emerging insights into the molecular and cellular basis of glioblastoma. Genes Dev. 2012;26:756–784. doi: 10.1101/gad.187922.112. [DOI] [PMC free article] [PubMed] [Google Scholar]
- Ellingson B., Lai A., Harris R., Selfridge J., Yong W., Das K., Pope W., Nghiemphu P., Vinters H., Liau L. Probabilistic radiographic atlas of glioblastoma phenotypes. Am. J. Neuroradiol. 2013;34:533–540. doi: 10.3174/ajnr.A3253. [DOI] [PMC free article] [PubMed] [Google Scholar]
- Ellingson B.M., Cloughesy T.F., Pope W.B., Zaw T.M., Phillips H., Lalezari S., Nghiemphu P.L., Ibrahim H., Naeini K.M., Harris R.J. Anatomic localization of O6-methylguanine DNA methyltransferase (MGMT) promoter methylated and unmethylated tumors: a radiographic study in 358 de novo human glioblastomas. NeuroImage. 2012;59:908–916. doi: 10.1016/j.neuroimage.2011.09.076. [DOI] [PubMed] [Google Scholar]
- Folkerd E.J., Dowsett M. Influence of sex hormones on cancer progression. J. Clin. Oncol. 2010;28:4038–4044. doi: 10.1200/JCO.2009.27.4290. [DOI] [PubMed] [Google Scholar]
- Gooya A., Pohl K.M., Bilello M., Cirillo L., Biros G., Melhem E.R., Davatzikos C. GLISTR: glioma image segmentation and registration. IEEE Trans. Med. Imaging. 2012;31:1941–1954. doi: 10.1109/TMI.2012.2210558. [DOI] [PMC free article] [PubMed] [Google Scholar]
- Hagg T. From neurotransmitters to neurotrophic factors to neurogenesis. Neuroscientist. 2009;15:20–27. doi: 10.1177/1073858408324789. [DOI] [PMC free article] [PubMed] [Google Scholar]
- Hur H., Jung S., Jung T.-Y., Kim I.-Y. Cerebellar glioblastoma multiforme in an adult. J. Korean Neurol. Soc. 2008;43:194–197. doi: 10.3340/jkns.2008.43.4.194. [DOI] [PMC free article] [PubMed] [Google Scholar]
- Jafri N.F., Clarke J.L., Weinberg V., Barani I.J., Cha S. Relationship of glioblastoma multiforme to the subventricular zone is associated with survival. Neuro-Oncology. 2013;15:91–96. doi: 10.1093/neuonc/nos268. [DOI] [PMC free article] [PubMed] [Google Scholar]
- Kimura M., Lee Y., Miller R., Castillo M. Glioblastoma multiforme: relationship to subventricular zone and recurrence. Neuroradiol. J. 2013;26:542–547. doi: 10.1177/197140091302600507. [DOI] [PMC free article] [PubMed] [Google Scholar]
- Lai A., Kharbanda S., Pope W.B., Tran A., Solis O.E., Peale F., Forrest W.F., Pujara K., Carrillo J.A., Pandita A. Evidence for sequenced molecular evolution of IDH1 mutant glioblastoma from a distinct cell of origin. J. Clin. Oncol. 2011;29:4482–4490. doi: 10.1200/JCO.2010.33.8715. [DOI] [PMC free article] [PubMed] [Google Scholar]
- Lee J.W., Wen P.Y., Hurwitz S., Black P., Kesari S., Drappatz J., Golby A.J., Wells W.M., Warfield S.K., Kikinis R. Morphological characteristics of brain tumors causing seizures. Arch. Neurol. 2010;67:336–342. doi: 10.1001/archneurol.2010.2. [DOI] [PMC free article] [PubMed] [Google Scholar]
- Lee S.L., Lee D.S. 2005. Analysis of Functional Brain Images Using Population-Based Probabilistic Atlas; pp. 81–87. (Current Medical Imaging Reviews). [Google Scholar]
- Lim D.A., Cha S., Mayo M.C., Chen M.-H., Keles E., VandenBerg S., Berger M.S. Relationship of glioblastoma multiforme to neural stem cell regions predicts invasive and multifocal tumor phenotype. Neuro-Oncology. 2007;9:424–429. doi: 10.1215/15228517-2007-023. [DOI] [PMC free article] [PubMed] [Google Scholar]
- Parisot S., Darlix A., Baumann C., Zouaoui S., Yordanova Y., Blonski M., Rigau V., Chemouny S., Taillandier L., Bauchet L. A probabilistic atlas of diffuse WHO grade II glioma locations in the brain. PLoS One. 2016;11 doi: 10.1371/journal.pone.0144200. [DOI] [PMC free article] [PubMed] [Google Scholar]
- Pérez-Carro R., Cauli O., López-Larrubia P. Multiparametric magnetic resonance in the assessment of the gender differences in a high-grade glioma rat model. EJNMMI Res. 2014;1:1–13. doi: 10.1186/s13550-014-0044-4. [DOI] [PMC free article] [PubMed] [Google Scholar]
- Sanai N., Alvarez-Buylla A., Berger M.S. Neural stem cells and the origin of gliomas. N. Engl. J. Med. 2005;353:811–822. doi: 10.1056/NEJMra043666. [DOI] [PubMed] [Google Scholar]
- Simpson J., Horton J., Scott C., Curran W., Rubin P., Fischbach J., Isaacson S., Rotman M., Asbell S., Nelson J. Influence of location and extent of surgical resection on survival of patients with glioblastoma multiforme: results of three consecutive Radiation Therapy Oncology Group (RTOG) clinical trials. Int. J. Radiat. Oncol. Biol. Phys. 1993;26:239–244. doi: 10.1016/0360-3016(93)90203-8. [DOI] [PubMed] [Google Scholar]
- Sun T., Walsh C.A. Molecular approaches to brain asymmetry and handedness. Nat. Rev. Neurosci. 2006;7:655–662. doi: 10.1038/nrn1930. [DOI] [PubMed] [Google Scholar]
- Thompson P., Mega M.S., Toga A.W. Disease-specific probabilistic brain atlases. Proc. IEEE Conf. Comput. Vis. Pattern Recognit. 2000;2000:227–234. doi: 10.1109/MMBIA.2000.852382. [DOI] [PMC free article] [PubMed] [Google Scholar]
- Tonn J.-C., Westphal M., Rutka J.T. 2010. Oncology of CNS Tumors. Springer Science & Business Media. [Google Scholar]
- Van Meir E.G., Hadjipanayis C.G., Norden A.D., Shu H.K., Wen P.Y., Olson J.J. Exciting new advances in neuro-oncology: the avenue to a cure for malignant glioma. CA Cancer J. Clin. 2010;60:166–193. doi: 10.3322/caac.20069. [DOI] [PMC free article] [PubMed] [Google Scholar]
- Wang Y., Liu S., Fan X., Li S., Wang R., Wang L., Ma J., Jiang T., Ma W. Age-associated brain regions in gliomas: a volumetric analysis. J. Neuro-Oncol. 2015;123(2):299–306. doi: 10.1007/s11060-015-1798-x. [DOI] [PubMed] [Google Scholar]