Abstract.
Many pulse-echo imaging systems use focused beams to improve lateral resolution. The beam width is determined by the choice of source and apodization function, the frequency, and the physics of focusing. Postprocessing strategies to improve lateral resolution can be limited by the need for conditioning the mathematics of inverse filtering, due to instabilities. We present an analysis that defines key constraints on sampled versions of lateral beampatterns. Within these constraints are useful symmetric beampatterns, which, when properly sampled, can have a stable inverse filter. A framework for analysis and processing is described and applied to phantoms and tissues to demonstrate the improvements that can be realized.
Keywords: super-resolution, ultrasound images, lateral resolution enhancement, deconvolution, Z-transform, stable inverse filters
1. Introduction
The topic of super-resolution imaging is a longstanding area of research across many imaging systems including still images, movies or dynamic images, and special areas such as fluorescent microscopy.1 A variety of mathematical models and techniques have been applied to achieve better resolution than would otherwise be expected from the nominal limitations of the imaging systems. An important subset of imaging is the class of pulse-echo systems used in radar, sonar, and ultrasound scanners. There are methods that utilize special imaging sequences to enhance the resolution, e.g., the classical synthetic aperture imaging.2 Other theories such as the time reversal and multiple signal classification3–5 based on decomposition of the time-reversal operator6,7 have been used to resolve the scatterers or extended targets, e.g., breast microcalcifications.8,9
In many practical systems, some key approximations are found to be useful, including a Fourier transform relationship between a source apodization function and a resulting focal pattern, and a convolution model for the interaction of the propagating pulse and the scatterers or reflectors.10–15 Blind deconvolution algorithms16–22 improve resolution by estimating the point spread function (PSF) together with the reflection coefficients of tissue. On the other hand, nonblind deconvolution approaches utilize more prior information and are thus generally more specific for the imaging system and have better performance.23,24 Under the framework of nonblind deconvolution, a specific approach to super-resolution imaging for pulse-echo systems was previously described for stabilized asymmetric pulses.25 We defined stabilized pulses as those which, when sampled, have an exact inverse filter. Stabilized pulses, in this context, are realizable focal patterns and beampatterns that are modeled as continuous functions in the axial and transverse directions, that when sampled have their -transform zeros lying away from the unit circle. This corresponds to inverse filters that are stable such that they are limited in time with bounded output. Such inverse filters are bounded and well behaved in the presence of noise, and proper design of the stabilized pulse, analyzed with the help of the -transform, can be an important part of a super-resolution strategy. However, the previous paper was directed to using an asymmetric pulse shape for generating stabilized pulses.
In this paper, we extend the work to circumstances where stabilized “symmetric” beampatterns, e.g., Gaussian shapes, can be produced and sampled so as to have a stable and useful inverse filter. We also explicitly treat the problem of scatterers positioned at subinteger shifts, between the nominally sampled locations. Examples are provided from Field II26,27 and ultrasound B-scans. Only lateral deconvolution is considered, as the first part of a separable (lateral and axial) deconvolution. Axial deconvolution can be treated in a similar framework, but a full description is left for a later paper. Furthermore, lateral resolution is, by itself, of interest since in many applications the lateral resolution is poor compared with the axial resolution.
2. Theory
2.1. Pulse-Echo Convolution Model
In conventional B-mode ultrasound imaging, if the transmitting pulse is narrowband, then the classical convolution model gives us the relationship of Fourier transform between the beampattern [radio frequency (RF) data] and the apodization weights on the transducer face, which is derived by Prince and Links10 as
| (1) |
where , , and are the coordinates in the lateral, the elevational, and the axial directions, is the wave number, is the reflection coefficient of the scatterers, is the Fourier transform of the apodization function , is the envelope of the axial propagating pulse with as its wavelength, is the resulting image, which is the estimation of , and the operator “***” represents the three-dimensional convolution. Recall that is a pure Fourier transform because the quadratic phase term inside the integral is canceled by focusing, which means that the above equation only holds when the scatterer being imaged is at the focus of the system.
Under some conditions, a number of simplifications can apply. Let us assume that all scatterers lie in the plane; this reduces the problem to a two-dimensional (2-D) model. Further, under the paraxial approximation, we neglect the quadratic phase term. Finally, we assume that the beampattern is relatively constant for some depth near the focus. Under these assumptions, the received signal is modeled as a simple convolution
| (2) |
where is the focus, “**” represents the 2-D convolution, and the system effects and are separable functions. Thus, we can examine the Fourier and sampled discrete transforms as separable functions.28 Denoting the lateral beam width term as and its inverse filter as , let
| (3) |
If there is some bounded input/output function , where
| (4) |
then the lateral deconvolution can be made and maximum resolution will be achieved as
| (5) |
The functions and calculations in the convolution model discussed here are in the “continuous” domain. However, in digital imaging systems, signal processing is completed in the “discrete” domain. For that reason, we examine the -transform requirements for a stable inverse filter.
2.2. Review of Z-Transforms of Simple Functions
For double-sided functions, the region of convergence (ROC) for a stable system with an inverse will be an annulus that includes the unit circle.29 For example, let
| (6) |
This is a double-sided function and its -transform is
| (7) |
with an ROC of , which includes the unit circle. This function has an exact inverse filter that is given as
| (8) |
Thus, a long function can be deconvolved with a short, finite impulse response, inverse filter to produce a discrete delta function, assuming the stability criteria are met. Unfortunately, stabilized pulses are not generally found for typical symmetric functions and beampatterns, as previously described.25 Criteria for stability do exist and these are examined in Sec. 2.3.
2.3. Stability Constraints for Symmetric Functions
In theory, let us consider a discrete function , symmetric about a maximum at , where , and . This has a -transform
| (9) |
The roots of are the poles of the inverse filter of the discrete samples {, }. In order to have a stable inverse filter, the roots cannot be located on the unit circle to avoid singularity. Note that there are an odd () number of discrete samples for simplicity, with . Because of the symmetry of such a function, , thus the above equation is the same with
| (10) |
where items with the same coefficients have been combined, which can always be formulated in the form of
| (11) |
where and {}, the new coefficients, are related to the original {} by the binomial theorem.
Focusing now on the zeros of , suppose that there is some root with , then obviously can be represented as . If that is true, will correspondingly have a zero
| (12) |
Note that the above process from to is necessary and sufficient. Therefore, in order to have all the zeros of excluded from the unit circle, the zeros of must be outside the range of []. Here, the range [] only applies to the real part, which means that all of the complex zeros of with a nonzero imaginary part meet the requirement.
Thus, the “master constraint” for symmetric, stabilized beampatterns is: , where , which enables the use of many classical root-testing methods. These additional theoretical considerations to further access the zeros of include
-
1.
The Eneström–Kakeya theorem,30 which states a relationship between the range of the roots and the ratios between the coefficients. However, this criterion is quite loose.
-
2.
The Jury stability criterion31 that can be used here to test whether all the zeros are outside the circle of in the -plane, where a substitution of should be made before the test.
Within these constraints lie some subset of sampled lateral beampatterns that have stable inverses. However, the achievable beampatterns are constrained by practical considerations on the apodization function and its Fourier transform . These issues include12
-
1.
Absolute limits on support of the apodization function.
-
2.
The need for high-energy transmission across the apodization function.
-
3.
Compact transform (narrow beam width for high lateral resolution with sidelobes below ).
Within these multiple constraints, candidate beampatterns can be assessed for producing stabilized inverse filters.
3. Examples
The Gaussian function, which is commonly used to apodize the transducers, is considered first.
3.1. Narrowband Point Spread Function
In ultrasound imaging, if the source apodization
| (13) |
where denotes the standard deviation, is applied at the transducer face for both transmit and receive, then according to Eq. (3), the two-way lateral PSF is calculated as
| (14) |
where the Fourier transform is evaluated at the spatial frequency of .10 Note that in reality, the apodization function will be a windowed Gaussian function because of the limited aperture size of the transducer.12 However, if the aperture covers , specifically if , where is the number of active transducer elements and is the pitch, the PSF will sufficiently approximate Eq. (14).
Written in the standard form of a Gaussian function, Eq. (14) can be formalized as
| (15) |
with a standard deviation
| (16) |
Since is a scaling factor, it does not influence the -transform of the samples, nor the stability of the inverse filter, so it can be disregarded. If a Gaussian lateral beampattern is sampled at a spacing of over a spatial extent of , then the number of samples inside the truncation window is calculated as
| (17) |
In practice, this is rounded to the nearest odd number for the sake of symmetry.
3.2. Constraint
Now that the function of the PSF is calculated [Eq. (15)] and the sampling process is clear [Eq. (17)], the discrete coefficients {} in Sec. 2.3 can be determined from samples of , and a numerical solution for the roots of -transform, guided by the Jury criterion.
Following the variable convention in Sec. 2.3, define
| (18) |
where is the discrete sampling interval. If nine samples are sampled symmetrically within the truncation range of , then is given as
| (19) |
Substituting Eqs. (18) into (19), and introducing
| (20) |
yields
| (21) |
Substituting Eqs. (21) into (10) and following Eq. (11) gives
| (22) |
Recall that for to have a stable inverse filter, zeros of should be outside the range of [] according to the master constraint. By solving that constraint, the stability criterion is reduced as , and hence
| (23) |
See Appendix A for more details. Since the samples have nine points, this result means that as long as the truncation window at focus is wider than , the samples symmetrically discretized within the truncation range always have a stable inverse filter.
As an example, a nine-point discrete function sampled from a Gaussian function with is analyzed in the -plane in Fig. 1, where all zeros in the -plane diagram are located away from the unit circle, thus generating an inverse filter that is stable. Similarly, stable inverse filters are also found for the five- and the seven-point samples from well-truncated Gaussian.
Fig. 1.
(a) A nine-point discrete function sampled from a Gaussian function. (b) The zeros of the -transform are away from the unit circle, resulting in (c) a stable inverse filter.
3.3. Stability of the Practical Point Spread Function: the Broadband Gaussian Model
The discussion prior to this point is based on the assumption of narrowband transmitted pulses, which leads to the PSF in Eq. (14). Practically, however, broadband pulses are used for enhanced axial resolution and the PSF will be modified. More generally, every frequency component from the wideband pulse has its own contribution to the beampattern; the individual contribution can be computed using Eq. (3), where the frequency variable is contained in the wavelength . If the previous Gaussian apodization is used, then based on Eq. (15) and using the concept of superposition, the resulting PSF for a broadband pulse can be modeled more practically as
| (24) |
where is the frequency, is the frequency-dependent standard deviation of the Gaussian focal pattern, and is the spectral weighting. Since the width of the focal beampattern is inversely proportional to the operating frequency, can be computed as
| (25) |
where is calculated using Eq. (16) with and . As for the weighting , assuming the impulse response of the transducer is a sinusoidal pulse modulated by a Gaussian function envelope, its positive frequency spectrum can be approximated as a Gaussian function symmetric at the center frequency . Therefore, is modeled as
| (26) |
where a factor of 2 typically together with term is canceled because both transmit and receive are considered; the convolution of the impulse response leads to the squaring of the Gaussian envelope. is the standard deviation of Gaussian envelope of the transmitting pulse, directly related to the bandwidth (in percentage) of the pulse in the way that
| (27) |
Solving for gives
| (28) |
Now that we have the expressions of and , Eqs. (26) and (25) are substituted into Eq. (24), yielding
| (29) |
where the broadband Gaussian model is formulated as a function of parameterized by (or the bandwidth ), , and the focus . This integration is calculated using Mathematica (Wolfram Research, Champaign, Illinois) as
| (30) |
where is the error function. Note that has been replaced by using Eq. (28), leaving functioning as an ignorable scaling factor. Thus, the PSF is now parameterized only by and .
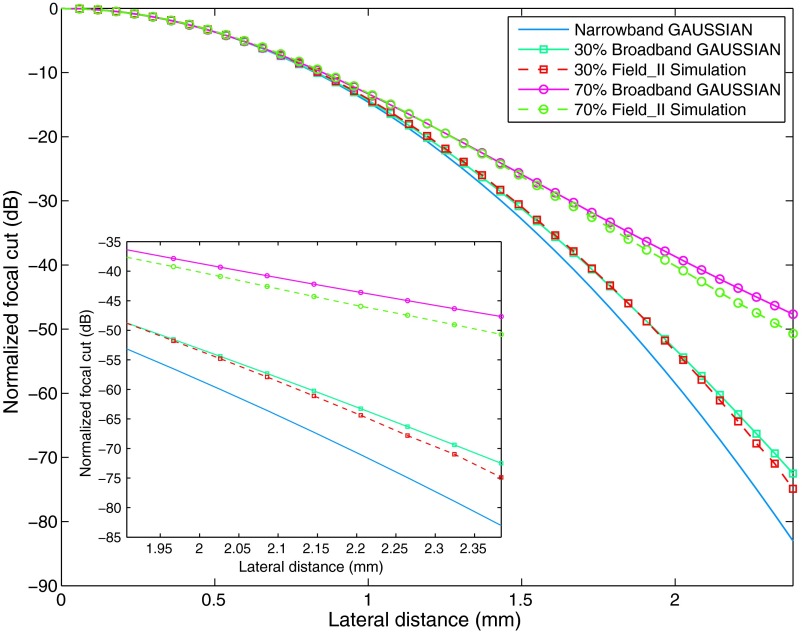
To verify the accuracy of this model, the PSF computed from Eq. (30) is compared with the focal beampattern of the -mode image of a point target simulated by Field II. The simulation models a 5-MHz ATL L7-4 transducer with 64 active elements to focus on the depth of 50 mm. The apodization is a Gaussian function for both transmit and receive. Figure 2 compares the focal beampatterns under bandwidths of 30% and 70%. The simulated focal beampatterns are also fitted into the broadband model [Eq. (30)] to show the resemblance. From the figures, it is observed that the broadband Gaussian model is very close to the Field II simulation for both bandwidths tested, illustrating the effectiveness of such a model.
Fig. 2.
Lateral beampatterns, theory, and simulation. The broadband Gaussian model formula is very close to those simulated in Field II for different bandwidths, while the narrowband Gaussian model becomes invalid as the bandwidth increases. The comparison is shown in log scale, and details of the small differences are displayed in the bottom-left insert.
The same logic in Sec. 3.2 is applied here to investigate the “stable” way of sampling the broadband Gaussian function. As the expression of the broadband Gaussian model is no longer a polynomial function, the exact roots require numerical solutions. Solving the Jury criterion, a tighter condition is found as the constraint that ensures that the nine-point discrete function, sampled from the broadband Gaussian model with 50% bandwidth, has an inverse filter that is stable. Note that the counterpart of such a condition is , for the narrowband Gaussian (see Appendix A). The comparison shows that the condition is more difficult to satisfy for the broadband Gaussian than the narrow one, which is explained by the increased width of the broadband Gaussian as seen in Fig. 2. An example can be found in Fig. 3, showing the stable inverse filter of a nine-point discrete function sampled at from a broadband Gaussian model with 50% bandwidth.
Fig. 3.
(a) A nine-point discrete function sampled from a broadband Gaussian beampattern with 50% bandwidth. (b) The -transform has all zeros away from the unit circle, resulting in (c) a stable inverse filter.
4. Practical Filtering Issues
Now given a model of the PSF, and given a zone of stability of its inverse filter, deconvolution can be performed. However, some additional practical issues still need to be addressed.
4.1. Depth-Dependent Nature of Ultrasound Imaging Systems
In ultrasound imaging systems, the PSF becomes wider as the focus is set deeper. Therefore, the ultrasound image may be divided into multiple zones, with different inverse filters applied to each zone. Considering this, processing of images with a limited range of depth is considered, and inverse filters designed for only one depth within that range are used for the purpose of this paper.
4.2. Over-Sampled Beampatterns
In case of a finely sampled, broad beampattern, we can down-sample by some factor to satisfy Eqs. (17) and (23). This divides the image into several subimages with fewer samples in each group, allowing us to generate stable inverse filters for every subgroup. The inverse filtering is thus done in the down-sampled domain for each subgroup, and all the results are interleaved to form the final results. The factor of downsampling is termed as the downsampling ratio (DSR).
4.3. Coherent Deconvolution with Inverse Filter Banks for Subinteger Shifts
If a scatterer is located between the sampled positions, then the designed inverse filter will not produce an exact discrete impulse. Such a mismatch, together with a low spatial sampling frequency, can cause undesired residual sidelobes after the inverse filtering. To deal with this issue, multiple inverse filters, instead of only one, are considered.
For multiple inverse filters, the PSF is sampled at subinteger shifts, namely for , where is an odd number, distributed uniformly within the sampling spacing , and for each shift, one inverse filter is designed. To be specific, set the number of shifts to be three as an example. The PSF is sampled at , , giving three sets of samples for or , from which three inverse filters can be generated. Practically, can be any number that works, although limited by the hardware of the scanner and also the requirement for the frame rate. In our work, is selected for simplicity.
To utilize such a bank of inverse filters, the following strategy is proposed. For a given image, the five designed inverse filters are applied in parallel, producing five deconvolution results, of which for every position, the result with the minimal absolute value is chosen. The reason for this strategy is based on the observation that the inverse filter that matches the shifted PSF yields the most compact result.32 We refer to this procedure as “coherent deconvolution.” This can also be followed by an optional subtraction of the standard deviation among the deconvolution results to suppress the sidelobes while maintaining the mainlobes.
Regarding the stability of the multiple inverse filters, while it is guided by the theory in Sec. 2.3 for the case , other inverse filters for focal samples with are not symmetric due to the shifting of the sampling positions on the PSF and must be assessed individually. Fortunately, we have found that these inverse filters are typically stable given a well-stabilized centered , and this is shown in Fig. 4 as an example using a -shifted version of the nine-point discrete function sampled from the broadband Gaussian model with 50% bandwidth that was discussed previously, for which a stable inverse filter is found.
Fig. 4.
(a) A nine-point discrete function sampled at positions shifted by from a broadband Gaussian model with 50% bandwidth (the same as that in Fig. 3). (b) Its -transform has zeros away from the unit circle, resulting in (c) a stable inverse filter.
Although stability is achievable for most of the subinteger shifts, the “flat top” sampling situation of should always be avoided. Such a circumstance occurs when, instead of being symmetric about only one unique peak, the samples have two peaks with the same amplitude in the center, forming a flat top in the middle of the focal beampattern. The mathematical proof can be found in Appendix B. To avoid this situation, should always be odd, i.e.,
| (31) |
4.4. Robustness and Parameterization
Another issue is the sensitivity of the deconvolution result to small perturbations of the inverse filter parameters. This problem can be caused by the mismatch between the true PSF and the designed inverse filters due to various reasons, including the shift-varying nature of the system and the distortion of the pulse during propagation. To deal with this, inverse filters are parameterized based on the broadband Gaussian model in Eq. (30), where and can be perturbed to form new inverse filters for assessment of image quality.
4.5. Noise
It should be noted that although the inverse filters are stable, they will still amplify noise due to the high-pass-filtering nature of deconvolution. Specifically, for a Gaussian apodization, or any other typical apodization functions such as Hamming, Hann, and , or prolate spheroidal functions,12,13 the resulting inverse filter is a high-pass filter peaking near Nyquist frequencies.
To condition this, a simple [1, 1] kernel is convolved with the inverse filters before they are used for deconvolution. This operation improves the deconvolution quality, but doubles the width of the theoretical discrete delta function peak after deconvolution. This can be mitigated by relaxing to broaden the estimated PSF during the design of the inverse filters. A median filter with small window size can also be applied before the final envelope detection to further remove the residuals.
4.6. Quadratic Phase Compensation
In Sec. 2.1, it was assumed that the quadratic phase term can be ignored using the paraxial approximation condition. Such a condition, however, is not always true, especially when the focus is deeper, which means that the beampattern will be mismatched to the designed inverse filters, giving rise to imperfect deconvolution results. To compensate this quadratic phase term, apodization can be redesigned such that the new focal beampattern is with the opposite quadratic phase term to cancel the original one. This new apodization is applied on transmit and requires an extra time delay function applied to the transducer elements.
4.7. Final Procedures
To summarize, the processing steps are as follows:
-
1.
Estimate the PSF by substituting the parameters with the imaging settings into the broadband Gaussian model as in Eq. (30), or by experiment.
-
2.
Design a bank of stable inverse filters from the centered PSF and from subinteger shifts with appropriate DSR.
-
3.
Acquire B-mode RF data using a Gaussian apodization (with quadratic phase compensated if necessary).
-
4.
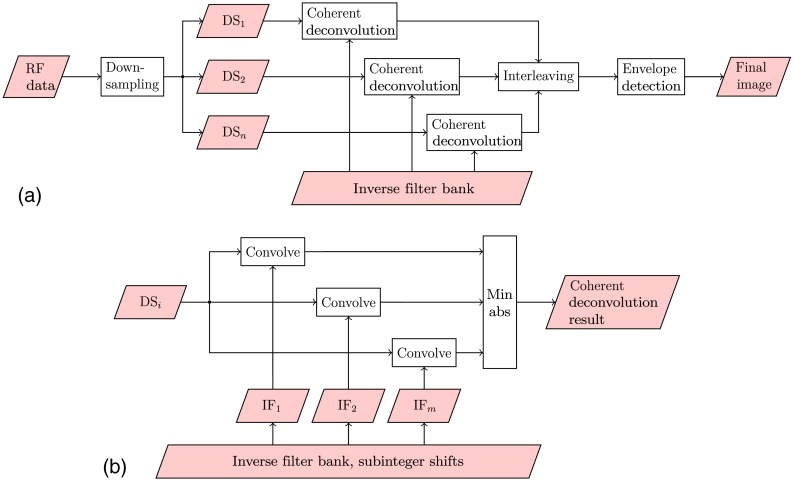
To perform deconvolution, first down-sample the RF data using the same DSR that is used for the design of the inverse filters. Then for each subgroup of RF data, perform the coherent deconvolution in the lateral dimension using the designed bank of inverse filters with the conditioning kernel if necessary. After that, interleave the partial results.
-
5.
Optionally, apply median filtering on the interleaved data to further reduce noise and any residuals of deconvolution.
-
6.
Perform Hilbert transform in the axial direction for envelope detection, if desired.
The procedures are also shown in Fig. 5.
Fig. 5.
Flow charts showing (a) overview of the processing procedures and (b) the details of each coherent deconvolution box. is the ’th downsampled RF data; the inverse filter bank contains inverse filters (IF) for discrete function sampled with subinteger shifts; and MinAbs chooses the convolution result with the minimum absolute values.
5. Results and Discussion
The proposed method is first implemented using Field II in simulation, and then using the Verasonics V1 scanner (Verasonics, Inc., Kirkland, Washington) for imaging both the tissue-mimicking phantom and the in vivo carotid artery. All the experiments are done using an ATL L7-4 transducer (Philips Healthcare, Andover, Massachusetts) at 5 MHz with 64 active elements. The same transducer is modeled in the Field II simulation. The transducer is apodized by a Gaussian function on transmit and receive, with the quadratic phase compensated on transmit. Single focusing and dynamic focusing are used on transmit and on receive, respectively. The RF data are set to 16 samples per wavelength in the axial direction; for our Verasonics scanner, which has a maximum sampling rate of four samples per wavelength, this requires an upsampling factor of 4. In the lateral direction, the pixel spacing of the RF data is one-fifth of the pitch width based on denser pulse sequencing. Such a high density is not necessary; it is performed only to enable finer lateral pixels for better display. In all cases, a bank of five stable inverse filters are designed in advance using the broadband Gaussian model based on the imaging parameters with a proper relaxation of . The conditioning kernel in the downsampled domain is used when necessary and a small median filter is applied twice in the interleaving domain before the envelope detection as a simple noise reduction step. All the ultrasound images are shown in the 50-dB dynamic range.
5.1. Field II Simulation
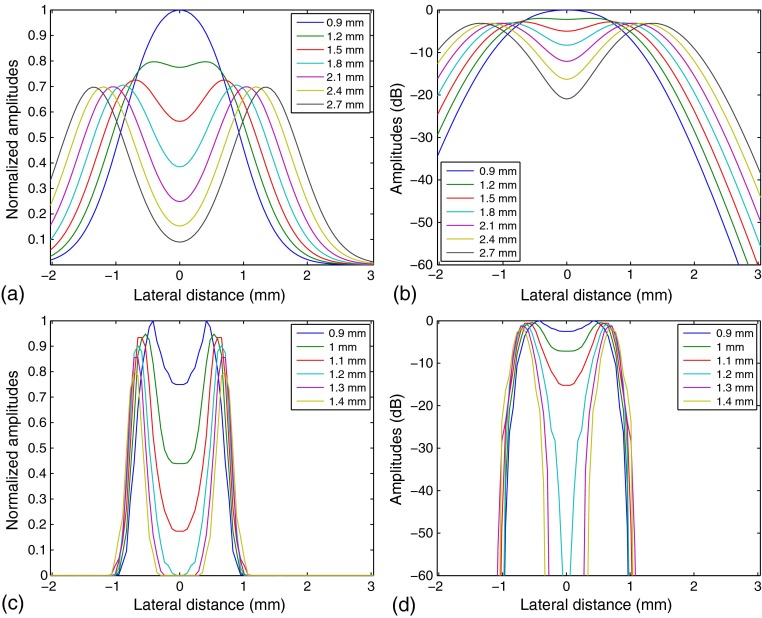
To assess enhancement of lateral resolution, images of two scatterers at the same depth (50 mm) with different lateral separation distances are simulated using Field II. For the depth of 50 mm, the DSR is 10 while . The focal beampatterns before and after deconvolution are shown in Fig. 6. The figure shows that the inverse filtering process reduces the widths of the main lobes and deepens the gap between the two scatterers. The center void declines to at a distance of 1.1 mm, compared to 2.7 mm for the original B-scan. The gap continues to drop below very quickly for distances greater than 1.2 mm, while the two scatterers in the original B-scan are separated more gradually.
Fig. 6.
Lateral beampattern simulated by Field II for two scatterers at focus, 50-mm deep, separated laterally by distances from 0.9 to 2.7 mm for the original B-scan: (a) linear scale and (b) 60-dB dynamic range. After the inverse filtering process, the width of the beampattern is narrowed, and the scatterers are separated in increments between 0.9 mm and only 1.4 mm in (c) linear scale and (d) 60-dB dynamic range. In each case (a)–(d), the amplitude in the center (0 mm lateral distance) is highest for the 0.9 mm separation and decreases in the same order as the legends.
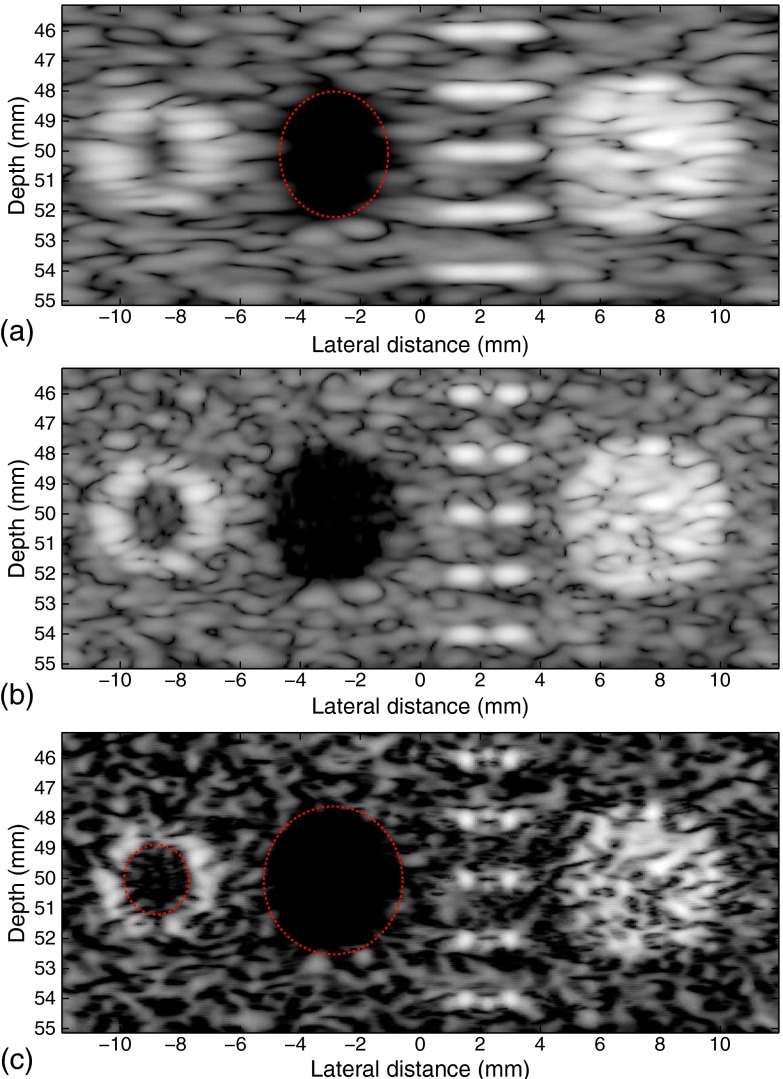
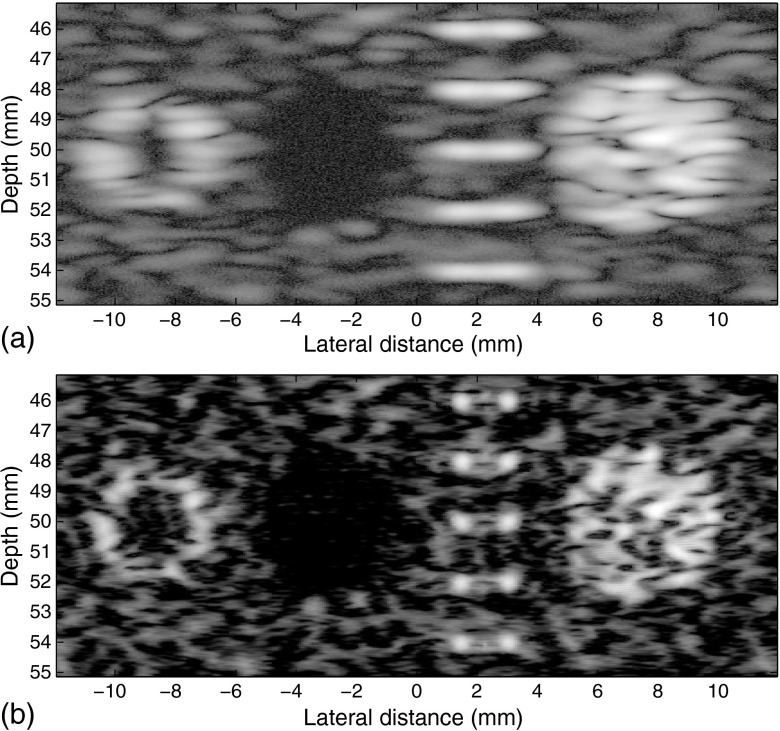
The method is also applied onto the image for a phantom at around 45 to 55 mm deep simulated with the ATL transducer with 50% bandwidth. The phantom consists of, from left to right, a blood vessel, an anechoic cyst, 10-point target pairs at 5 depths, and a hyperechoic lesion. Specifically, the diameters of the inner and the outer walls of the blood vessel are 3 and 3.5 mm, respectively; the distance between the two scatterers at the same depth is 1.5 mm; and both the cyst and the lesion share the same diameter of 5 mm. The speckle signal-to-noise ratio (SNR) of Fig. 7(a) is 1.84, which is close to the theoretical value of 1.91 for fully developed speckle with Rayleigh statistics.33 Only one bank of inverse filters, based on a 50-mm focal depth, is used for the entire image, while the standard deviation is relaxed by a factor of 0.95. The images before and after the procedures, together with a comparison image simulated using a rectangular apodization window with the same number of active elements, are shown in Fig. 7, where the resolution is seen enhanced by the increase of the diameter of the cyst, the decrease of the diameter of the lesion, and the separation of the scatterers. The sidelobes of the sinc function due to the rectangular apodization are clearly seen inside the artery of Fig. 7(b), although clutter is less visible in the cyst because of the limited dynamic range. Specifically for Figs. 7(a) and 7(c), the lateral diameter of the cyst is increased from 3.7 to 4.7 mm, and the blood vessel wall is seen much more clearly than that in the original image. The diameter of the inner blood vessel wall, which is designed to be 3 mm, is opened from barely visible to about 2.1 mm. The scatterer pairs are joined in the original B-scan but are separated after inverse filtering, although the performance of the scatterers above and below the focus is not as good as the on-focus ones. This, together with the fact that only one bank of inverse filters is used, suggests the tolerance of the inverse filters for depths that are off-focus to some extent.
Fig. 7.
Field II simulated images of a phantom. Conventional B-scan using (a) Gaussian and (b) rectangular apodization with focus at about 50 mm. (c) Enhanced result. The lateral diameter of the cyst is increased from 3.7 to 4.7 mm, and the blood vessel wall (left) is seen much more clearly than that in the original image. The diameter of the inner blood vessel wall, which is designed to be 3 mm, is opened from barely visible to about 2.1 mm. The scatterer pairs are separated after inverse filtering.
The noise tolerance of the inverse filters is demonstrated in Fig. 8, where 20-dB Gaussian white noise is added onto the original simulated RF data. A median filter is applied onto the original RF data before the deconvolution to reduce the noise. A conditioning kernel of [1, 1], together with a relaxation of 1.15 for is used to further reduce amplification of the noise. The result shows enhancements seen in Fig. 8(b), confirming the ability of the proposed method to perform in the presence of noise.
Fig. 8.
Field II simulated images of a phantom. (a) Conventional B-scan using Gaussian apodization with focus at about 50 mm with 20-dB additive Gaussian white noise of a phantom and (b) enhanced result. The result is similar to that of Fig. 7, showing the noise tolerance of the process.
5.2. Imaging of a Tissue-Mimicking Phantom
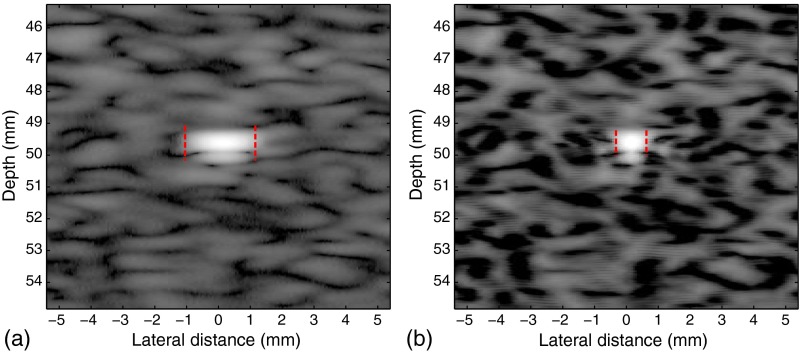
The ATS 535 QA ultrasound phantom (ATS Laboratories, Inc., Bridgeport, Connecticut) with a monofilament line target at 50-mm deep is imaged as shown in Fig. 9, where the width of pattern is reduced from 2.26 to 1.19 mm as shown by the red bars in the figures, reflecting the enhancement of resolution. The [1, 1] conditioning kernel is used and is relaxed by 1.05.
Fig. 9.
Images of (a) a line target 50-mm deep in the ATS phantom and (b) the processed result. The −20-dB lateral width of pattern is reduced from 2.26 to 1.19 mm as shown by the red bars in the figures, reflecting the enhancement of resolution.
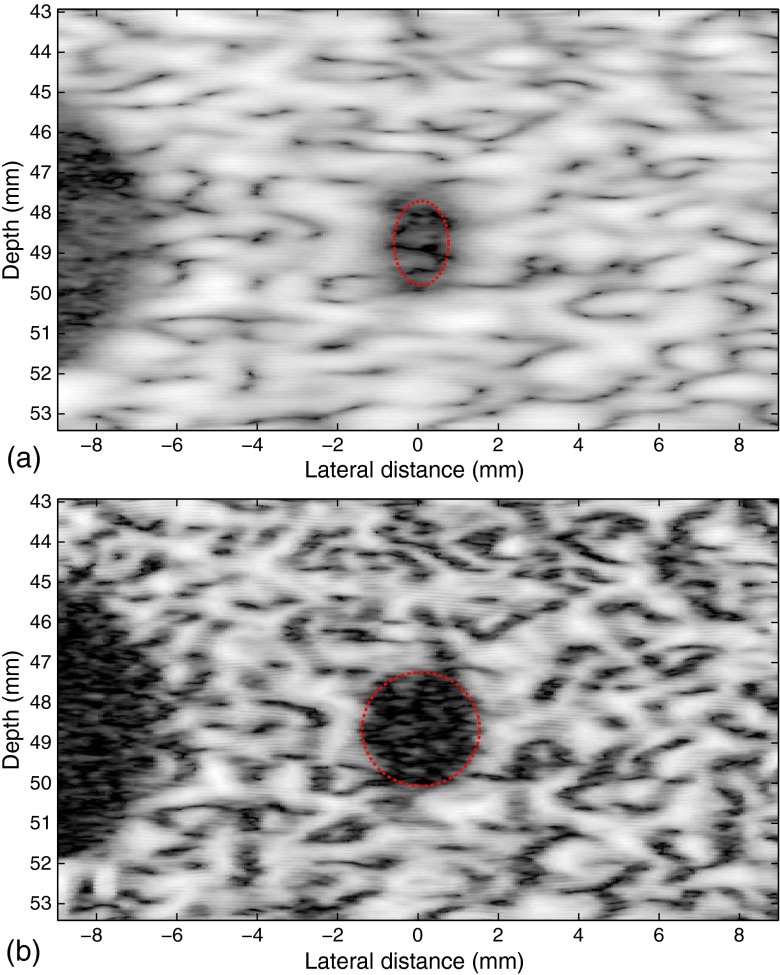
A cyst with a nominal diameter of 4 mm in the same ATS phantom is also imaged and processed under high noise conditions (minimal transmit voltage, 11 volts, and high receiver gain). A conditioning kernel is used together with the 1.15 relaxation of . From Fig. 10, the lateral opening of the small cyst is doubled, increasing from 1.4 to 3.0 mm as illustrated by the red ellipses, with the SNR of the image increased from 20.3 to 30.5 dB.
Fig. 10.
High noise B-scan images of (a) the cyst with a 4-mm diameter in the ATS phantom and (b) the processed result. The lateral opening of the small cyst is doubled, increasing from 1.4 to 3.0 mm as illustrated by the red ellipses.
5.3. In Vivo Imaging of the Carotid Artery
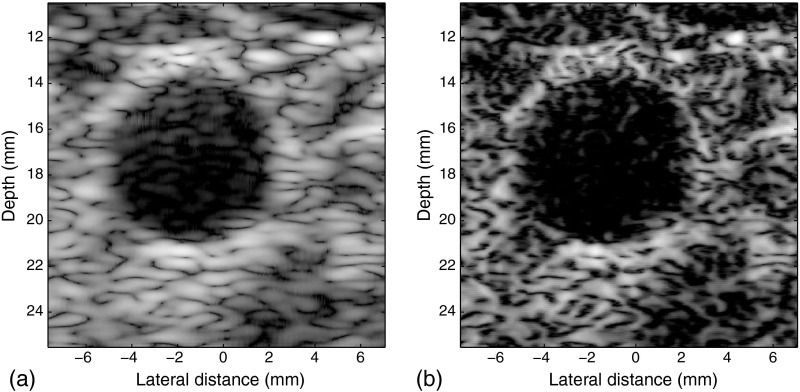
The carotid artery of a healthy adult was imaged under the requirements of informed consent and the University of Rochester Institutional Review Board. The data were processed using the same settings discussed at the beginning of Sec. 5, except that the number of active transducer elements is decreased from 64 to 32 to maintain the -number near 2 at shallow depth. Because of the change mentioned earlier, the DSR is set as 7, and correspondingly, 11-point samples are used for the design of the inverse filter. A conditioning kernel is used along with a 1.15 relaxation of . The results are shown in Fig. 11, where the opening of the arterial lumen is observed. Furthermore, the arterial wall is better defined.
Fig. 11.
(a) In vivo image of the carotid artery and (b) the processed result.
5.4. Further Discussion
Some limitations of the approach are now considered. In our examples, an point sampled, stabilized lateral focal beampattern is shown to have an exact inverse producing a discrete delta function upon convolution. From this point of view, resolution should increase by a factor of 9 in subsequent examples, but gains are more modest. The major factors that lessen the improvements include the presence of scatterers at subinteger locations, the deviation of beampatterns from the simplified convolution model, and of course the presence of noise, which can require additional filtering steps at the cost of degraded resolution. In addition, any downsampling of the lateral samples reduces final resolution. Nonetheless, the improvements in resolution can enhance the visualization of small objects such as cysts, vessels, and calcifications that would otherwise be blurred in conventional B-scan imaging.
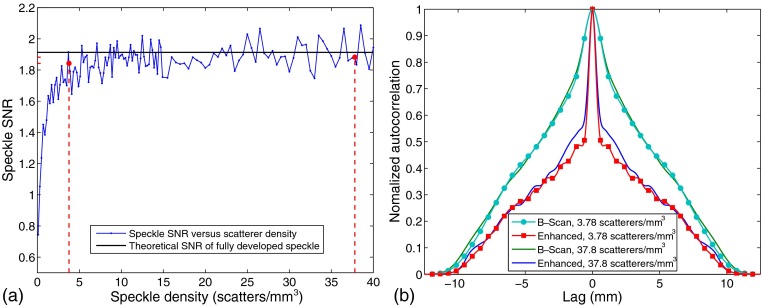
It is observed from the results that some speckle regions appear eroded after the super-resolution processing. This is because the coherent deconvolution chooses the output result with the minimum absolute value. This rule could be modified depending on local statistics. The simulated B-scan images and the enhanced resolution results can depend on the scatterer density employed in the simulation. To examine this parameter, Fig. 12 compares first- and second-order statistics of independent images of pure speckle phantoms () simulated in Field II as a function of scatterer density. The first-order statistics are evaluated by calculating the SNR of the speckle envelope, which is shown in Fig. 12(a), where speckle SNR as a function of scatterer densities from 0.1 to are plotted. A black line provides the theoretical SNR of fully developed speckle (1.91)33 and red-dashed lines highlight the cases of 3.78 and . These represent the parameters used to construct the examples of Figs. 7 and 8, and then a density that is deeply within the zone of fully developed speckle. The second-order statistics are shown by the lateral slice through the peak of the normalized 2-D autocorrelation of the envelope. In Fig. 12(b), the lateral slices from both the original and the processed images demonstrate the sharpening of the resolution, but with a subtle difference in the “shoulder” range of 2 to 5 mm lag of the enhanced results depending on scatterer density. This is consistent with a slightly more “filled in” subjective appearance of the speckle before and after processing for the higher density (37.8) case.
Fig. 12.
Comparison between (a) first- and (b) second-order statistics of independent images of pure speckle phantoms simulated in Field II as a function of scatterer density (). In (a), speckle envelope SNRs for the cases of 3.78 and are highlighted using red dash lines, compared to the theoretical value of 1.91 expected for fully developed speckle. In (b), the normalized autocorrelation functions for the envelopes of both the original B-scan and the processed, enhanced signals are shown.
The inverse filters are predesigned based on the parameterized PSF model, therefore, distortion of the PSF in practice will give rise to a mismatch. This is a general weakness of nonblind approaches. However, as long as the parameters used in Eq. (30) are reasonable, e.g., a sound speed near in the soft tissue, the inverse filters demonstrate improvement, as shown in our result for the carotid artery images. If enhancement in resolution is not seen in the processed image, the inverse filters can always be modified by changing the parameters, within the limits of stability. In fact, the examples of Figs. 7–10 can be processed with [Eqs. (16) and (30)] varied between and with stable output. If one chooses an image quality or sharpness metric, the “final” value of can be selected accordingly.
Finally, we note that axial deconvolution can be implemented within a similar framework, however, this is the subject of a future paper.
6. Conclusion
In the context of the -transform and the deconvolution model, an inverse filter approach has been designed to improve resolution. The apodization function, the physics of focusing, and the -transform theorems of stability all place constraints on candidates for lateral beampatterns with stable inverses. These constraints for generating stable inverse filters are derived. Examples are shown by applying the methods to both Field II simulation and the Verasonics scanner, where resolution improvement is achieved from either the opening of the lesion or blood vessel or the narrowing of the lateral width of the PSF, which is decreased by as much as 50%.
Acknowledgments
This work was supported by the University of Rochester and the Hajim School of Engineering and Applied Sciences.
Biographies
Shujie Chen is a PhD candidate in the Department of Electrical & Computer Engineering at the University of Rochester.
Kevin J. Parker is the William F. May Professor of Engineering (Electrical & Computer Engineering, Biomedical Engineering, Imaging Sciences) and Dean Emeritus of the School of Engineering & Applied Sciences at the University of Rochester.
Appendix A: Solving q for the Gaussian Example
A.1. Using the Jury Criterion
Equation (22) is copied here as
In order to have all the zeros of staying away from the unit circle, a stronger constraint is that all the zeros of , no matter real or complex, are required to stay outside the range of []. This can be solved using the Jury criterion. By substituting for as suggested in Sec. 2.3 and using Mathematica, the numerical result is solved as , referred to as the “Jury range.” Combining such a range with Eq. (20) we have
| (32) |
Although the previous result is derived from the Jury criterion, it is totally acceptable, as it will be seen that this is close to the exact solution for the master constraint (solved in Appendix A.2), where the real and complex zeros of are treated separately.
A.2. Exact Solution
If the roots of an equation are real or complex can be known from its discriminant, and for , the discriminant is
| (33) |
whose real roots are found numerically as , , , and , respectively. Since there is a stable inverse filter for the Jury range of , we only have to investigate the range of . Based on the relationship between the roots of a quartic equation and the discriminant and some other polynomials relative to the nature of the roots,34 such a range is treated separately for the following cases:
-
Case 1:
.
The roots are all complex numbers in this range, therefore, this range automatically satisfies the master constraint (recall that the [] range requirement is only for the real roots), leading to inverse filters that are stable.
-
Case 2:
.
In this case, there are two real roots and two complex conjugate roots for . Since the to 2 restriction is not necessary for the complex roots, the Jury criterion will be too tight for this case if used. However, since is a quartic function, its zeros can be solved analytically, and the real root can be picked out for testing of the constraint. Using Mathematica, it turns out that the absolute values of both real roots are smaller than 2 for this range of . Hence, such a range does not provide stability for the inverse filter.
-
Case 3:
.
In this case, has only real roots, which means that Jury stability criterion can be applied directly without harm. However, there is no overlapping between this range and the Jury range, so no stable inverse filter is found in this range.
Combining cases 1, 2, and 3, the solution for the master constraint is , extending the Jury range. Combining with Eq. (20) again, we come up with
| (34) |
which is the same as Eq. (23).
Appendix B: Instability of Flat-Top Functions
In Sec. 2.3, discrete functions with an odd number of samples symmetric about a sole peak point are discussed. However, it is possible for the focal beampattern to be sampled symmetrically with the true peak at a half-integer location, producing a flat-top sampled function. This alternative sampling will always yield unstable results. Such a function, denoted as , is in the form of
| (35) |
from which the flat top appears at . Using the similar technique for deriving Eq. (11), we have
| (36) |
where there is no constant term, which is its only difference from a nonflat-top symmetric function. Due to the absence of the constant term, has a root of
| (37) |
regardless of . Recall that , from Eq. (9) has a zero of
| (38) |
which locates on the unit circle, meaning that the inverse filter for such a flat-top symmetric discrete function is unstable.
Note that in the context of this paper, there should always be an odd number of samples, while it is even for a theoretical flat-top function. As a result, a practical flat-top function has an extra sample on either side of its tails. Practically, so long as this extra sample is relatively close to zero, the sampled function will have a zero that is very close to . Therefore, the flat-top function should still always be avoided.
References
- 1.Chaudhuri S., Super-Resolution Imaging, Kluwer Academic Publishers, New York: (2002). [Google Scholar]
- 2.Jensen J. A., et al. , “Synthetic aperture ultrasound imaging,” Ultrasonics 44(Suppl. 1), e5–e15 (2006). 10.1016/j.ultras.2006.07.017 [DOI] [PubMed] [Google Scholar]
- 3.Devaney A. J., “Super-resolution processing of multi-static data using time reversal and music,” http://www.ece.neu.edu/fac-ece/devaney/preprints/paper02n_00.pdf (2000).
- 4.Devaney A. J., Marengo E. A., Gruber F. K., “Time-reversal-based imaging and inverse scattering of multiply scattering point targets,” J. Acoust. Soc. Am. 118(5), 3129–3138 (2005). 10.1121/1.2042987 [DOI] [PubMed] [Google Scholar]
- 5.Lehman S. K., Devaney A. J., “Transmission mode time-reversal super-resolution imaging,” J. Acoust. Soc. Am. 113(5), 2742–2753 (2003). 10.1121/1.1566975 [DOI] [PubMed] [Google Scholar]
- 6.Prada C., Fink M., “Eigenmodes of the time reversal operator: a solution to selective focusing in multiple-target media,” Wave Motion 20(2), 151–163 (1994). 10.1016/0165-2125(94)90039-6 [DOI] [Google Scholar]
- 7.Prada C., et al. , “Decomposition of the time reversal operator: detection and selective focusing on two scatterers,” J. Acoust. Soc. Am. 99(4), 2067–2076 (1996). 10.1121/1.415393 [DOI] [Google Scholar]
- 8.Huang L., et al. , “Detecting breast microcalcifications using super-resolution ultrasound imaging: a clinical study,” Proc. SPIE 8675, 867510 (2013). 10.1117/12.2007065 [DOI] [Google Scholar]
- 9.Labyed Y., Huang L., “Ultrasound time-reversal MUSIC imaging of extended targets,” Ultrasound Med. Biol. 38(11), 2018–2030 (2012). 10.1016/j.ultrasmedbio.2012.07.008 [DOI] [PubMed] [Google Scholar]
- 10.Prince J. L., Links J. M., “Ultrasound imaging systems,” in Medical Imaging Signals and Systems, Pearson Prentice Hall, Upper Saddle River, New Jersey: (2006). [Google Scholar]
- 11.Cobbold R. S. C., Foundations of Biomedical Ultrasound, Oxford University Press, New York: (2007). [Google Scholar]
- 12.Parker K. J., “Correspondence: apodization and windowing functions,” IEEE Trans. Ultrason. Ferroelectr. Freq. Control 60(6), 1263–1271 (2013). 10.1109/TUFFC.2013.2691 [DOI] [PubMed] [Google Scholar]
- 13.Parker K. J., “Correspondence: apodization and windowing eigenfunctions,” IEEE Trans. Ultrason. Ferroelectr. Freq. Control 61(9), 1575–1579 (2014). 10.1109/TUFFC.2014.3071 [DOI] [PubMed] [Google Scholar]
- 14.Macovski A., “Basic ultrasonic imaging,” in Medical Imaging Systems, Prentice Hall, Englewood Cliffs, New Jersey: (1983). [Google Scholar]
- 15.Szabo T. L., Diagnostic Ultrasound Imaging: Inside Out, Elsevier Academic Press, Burlington, Massachusetts: (2004). [Google Scholar]
- 16.Campisi P., Egiazarian K., Blind Image Deconvolution: Theory and Applications, CRC Press, Boca Raton: (2007). [Google Scholar]
- 17.Abeyratne U. R., Petropulu A. P., Reid J. M., “Higher order spectra based deconvolution of ultrasound images,” IEEE Trans. Ultrason. Ferroelect. Freq. Contr. 42(6), 1064–1075 (1995). 10.1109/58.476550 [DOI] [Google Scholar]
- 18.Taxt T., Strand J., “Two-dimensional noise-robust blind deconvolution of ultrasound images,” IEEE Trans. Ultrason. Ferroelect. Freq. Contr. 48(4), 861–866 (2001). 10.1109/58.935701 [DOI] [PubMed] [Google Scholar]
- 19.Michailovich O., Tannenbaum A., “Blind deconvolution of medical ultrasound images: a parametric inverse filtering approach,” IEEE Trans. Image Process. 16(12), 3005–3019 (2007). 10.1109/TIP.2007.910179 [DOI] [PMC free article] [PubMed] [Google Scholar]
- 20.Michailovich O. V., Adam D., “A novel approach to the 2-D blind deconvolution problem in medical ultrasound,” IEEE Trans. Med. Imaging 24(1), 86–104 (2005). 10.1109/TMI.2004.838326 [DOI] [PubMed] [Google Scholar]
- 21.Yu C., Zhang C., Xie L., “A blind deconvolution approach to ultrasound imaging,” IEEE Trans. Ultrason. Ferroelectr. Freq. Control 59(2), 271–280 (2012). 10.1109/TUFFC.2012.2187 [DOI] [PubMed] [Google Scholar]
- 22.Jensen J. A., “Real time deconvolution of in-vivo ultrasound images,” in 2013 IEEE Int. Ultrasonics Symp. (IUS), pp. 29–32 (2013). 10.1109/ULTSYM.2013.0008 [DOI] [Google Scholar]
- 23.Ng J., et al. , “Modeling ultrasound imaging as a linear, shift-variant system,” IEEE Trans. Ultrason. Ferroelect. Freq. Control 53(3), 549–563 (2006). 10.1109/TUFFC.2006.1610563 [DOI] [PubMed] [Google Scholar]
- 24.Ng J., et al. , “Wavelet restoration of medical pulse-echo ultrasound images in an EM framework,” IEEE Trans. Ultrason. Ferroelect. Freq. Control 54(3), 550–568 (2007). 10.1109/TUFFC.2007.278 [DOI] [PubMed] [Google Scholar]
- 25.Parker K. J., “Superresolution imaging of scatterers in ultrasound B-scan imaging,” J. Acoust. Soc. Am. 131(6), 4680–4689 (2012). 10.1121/1.4714341 [DOI] [PubMed] [Google Scholar]
- 26.Jensen J. A., “Simulation of advanced ultrasound systems using Field II,” in IEEE Int. Symp. on Biomedical Imaging: Nano to Macro, 2004, Vol. 631, pp. 636–639 (2004). 10.1109/ISBI.2004.1398618 [DOI] [Google Scholar]
- 27.Jensen J. A., “Field: a program for simulating ultrasound systems,” in 10th Nordibaltic Conf. on Biomedical Imaging, pp. 351–353 (1996). [Google Scholar]
- 28.Bracewell R. N., The Fourier Transform and Its Applications, 1st ed., McGraw-Hill, New York: (1965). [Google Scholar]
- 29.Jackson L. B., “Signals, systems, and transforms,” in Addison-Wesley Series in Electrical Engineering, p. 314, Addison-Wesley, Reading, Massachusetts: (1991). [Google Scholar]
- 30.Prasolov V. V., Leites D., Polynomials, Springer, Berlin: (2004). [Google Scholar]
- 31.Shinners S. M., Advanced Modern Control System Theory and Design, Wiley, New York: (1998). [Google Scholar]
- 32.Stankwitz H. C., Dallaire R. J., Fienup J. R., “Nonlinear apodization for sidelobe control in SAR imagery,” IEEE Trans. Aerosp. Electron. Syst. 31(1), 267–279 (1995). 10.1109/7.366309 [DOI] [Google Scholar]
- 33.Burckhardt C. B., “Speckle in ultrasound B-mode scans,” IEEE Trans. Sonics Ultrason. 25(1), 1–6 (1978). 10.1109/T-SU.1978.30978 [DOI] [Google Scholar]
- 34.Rees E. L., “Graphical discussion of the roots of a quartic equation,” Am. Math. Mon. 29(2), 51–55 (1922). 10.2307/2972804 [DOI] [Google Scholar]


