Figure 4.

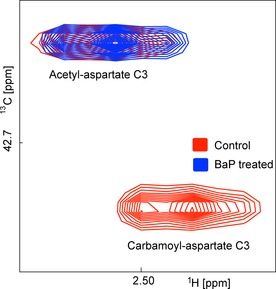
Overlay to compare the effect of BaP treatment on resonances from N‐acetylaspartate (top left peak) and N‐carbamoylaspartate (bottom right peak). Red: control sample grown in [3‐13C]glutamine; blue: BaP‐treated sample.

Overlay to compare the effect of BaP treatment on resonances from N‐acetylaspartate (top left peak) and N‐carbamoylaspartate (bottom right peak). Red: control sample grown in [3‐13C]glutamine; blue: BaP‐treated sample.