Abstract
Importance
Disease severity of childhood Charcot-Marie-Tooth disease (CMT) has not been extensively characterised, either within or between CMT types.
Objective
To assess the variability of disease severity in a large pediatric cohort of CMT.
Design
Cross-sectional study.
Setting
Conducted at eight universities and hospitals involved in the Inherited Neuropathies Consortium between August 2009 and July 2014 in Australia, Italy, UK and USA.
Participants
520 children and adolescents with CMT aged 3–20 years.
Main Outcome and Measure(s)
The CMT Pediatric Scale (CMTPedS) which is a well-validated unidimensional clinical outcome measure to assess disease severity. It includes 11 items assessing fine and gross motor function, sensation and balance to produce a total score ranging from 0 (unaffected) to 44 (severely affected).
Results
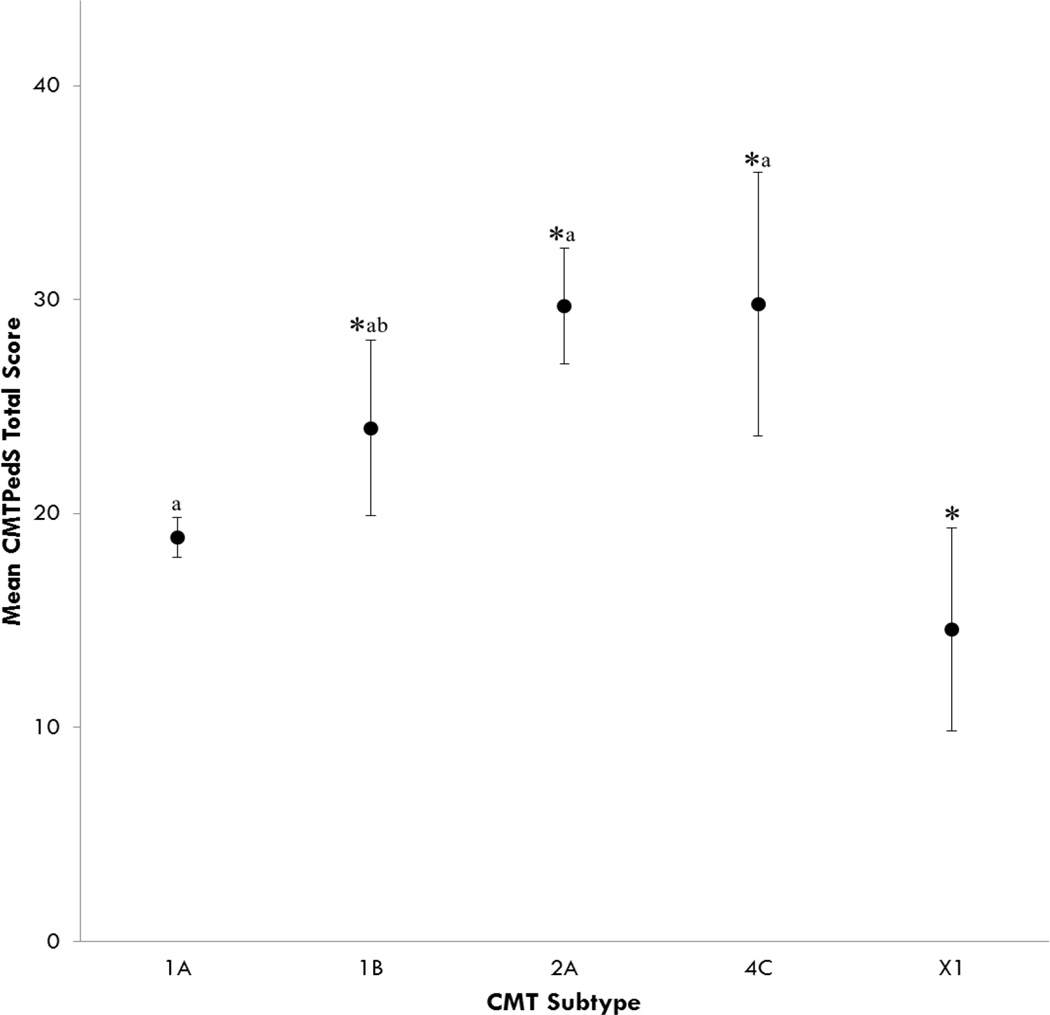
CMT1A (54%), CMT2A (6%), CMT1B (3%), CMT4C (3%) and CMTX1 (2%) were the most prevalent CMT subtypes. Disease severity ranged from 1–44 CMTPedS points (mean 21.5±8.9) with ankle dorsiflexion strength and functional hand dexterity test items being most affected. Participants with CMT1B (24.0±7.4, range 13–42), CMT2A (29.7±7.1, range 14–44) and CMT4C (29.8±8.6, range 15–40) were more severely affected than CMT1A (18.9±7.7, range 1–40) and CMTX1 (males:15.3±7.7, range 4–27; females:13.0±3.6, range 9–16) (p<0.05). CMTPedS tended to worsen principally during childhood (3–10 years) for CMT4C and CMTX1, and worsen predominantly during adolescence for CMT1B and CMT2A (11–20 years), while CMT1A worsened consistently throughout childhood and adolescence. At an item level, participants with CMT4C recorded more affected functional dexterity test scores than all other types (p<0.05). Participants with CMT1A and CMTX1 performed significantly better in the nine hole peg test and balance than all other types (p<0.05). Participants with CMT2A had the weakest grip strength (p<0.05), while CMT2A and CMT4C exhibited the weakest ankle plantarflexion and dorsiflexion strength, as well as the lowest long jump and six minute walk distances (p<0.05). Multiple regression modelling identified increasing age, height, self-reported hand weakness and foot pain as independent predictors of disease severity.
Conclusions and Relevance
These results highlight the phenotypic variability within CMT genotypes and mutation-specific manifestations between types. This study has identified distinct functional limitations and self-reported impairments to target in future therapeutic trials.
Introduction
Characterising the variability of disease severity within and between Charcot-Marie-Tooth disease (CMT) types is important to increase genotype-phenotype association knowledge and improve our understanding of the prognosis of this disorder. CMT is the most common inherited neuropathy with an estimated prevalence of 1 in 25001. Next generation sequencing has resulted in a rapid expansion of gene discovery with more than 80 genes identified and many more still to be discovered.2 CMT is often characterised by distal weakness, foot deformity, sensory loss, areflexia and difficulties with gait,2,3 however the frequency of these disease manifestations and the variability within and between CMT types is poorly understood. Whilst the prevalence of each type of CMT is becoming clearer, there is less known about the clinical characteristics of each of these genetic subtypes in childhood.
CMT Type 1A is the most common form of CMT accounting for approximately 60% of those with a genetic diagnosis.4 Although CMT1A has been reported to be slower in progression when compared to other forms of CMT, and most participants remain ambulant through their lifetime, variability exists in the severity and rate of progression.4 CMTX1 and CMT2A are generally the next most common types,4,5 however some geographic variability exists. Although disease severity of some of the rarer forms of CMT has been described, none have directly compared CMT types in childhood.4,6–8 The development of the CMT Pediatric Scale (CMTPedS) has provided the opportunity to compare types of CMT objectively and reliably in children and young adults across multiple centers.3 The CMTPedS was developed through the Inherited Neuropathies Consortium (INC), which is a member of the NIH Rare Disease Clinical Research Network (http://www.rarediseasesnetwork.org/). The INC was established to conduct international collaborative research and natural history studies on adults and children with CMT. The CMTPedS is a linearly-weighted and responsive clinical outcome measure to assess disease severity, and includes measures of hand dexterity, strength, sensation, gait, balance, power and endurance. It provides an overall age-adjusted disability score allowing comparison within and between participants with different CMT types. The aim of this study was to characterise the range of disease severity both within and between CMT types of children and young adults enrolled in the INC.
Materials and Methods
A total of 520 children and young adults aged 3–20 years were enrolled across 8 sites in the INC between August 2009 and July 2014. The 8 sites included: Children’s Hospital at Westmead, Sydney, Australia (n=113); University of Iowa Health Care, Iowa, USA (n=92); Wayne State University, Detroit, USA (n=85); Children’s Hospital of Philadelphia, Pennsylvania, USA (n=72); C. Besta Neurological Institute, Milan, Italy (n=66); National Hospital of Neurology and Neurosurgery and Great Ormond Street Hospital, London, UK (n=56); Nemours Children’s Hospital, Florida, USA (n=20); University of Rochester, New York, USA (n=16). Ethics approval was obtained at all institutions and written informed consent was obtained from all participants and/or their parents/guardians as required.
Demographic and physical characteristics
Demographic information, clinical features and genetic diagnosis were collected from all participants. Demographic information included age, height, weight, BMI percentile. A diagnosis of CMT was made using clinical features, nerve conduction studies, family history and genetic testing. Self-reported symptoms of foot pain, leg cramps, unsteady ankles, daily trips and falls, hand pain, hand weakness, hand tremor and sensory symptoms including tingling, numbness or burning were obtained from all participants. Symptoms were reported as being either present or absent. Foot deformity was assessed using the validated Foot Posture Index (FPI)9 and ankle flexibility was assessed using the highly-reliable weight-bearing lunge test.10 The angle was measured using a digital inclinometer.
Disease severity
The CMTPedS was performed on all children and young adults by trained evaluators at each site. The CMTPedS measures hand dexterity (functional dexterity test and 9 hole peg test), strength (hand grip, ankle plantarflexion and dorsiflexion), sensation of the lower limbs (pinprick and vibration), gait (difficulty heel walking, difficulty toe walking and presence of foot drop), balance (Bruininks-Oseretsky Test), and function (long jump and 6 minute walk test).3 All items were assessed and raw scores compared to age- and sex-matched normative reference values to obtain a z-score. The z-scores are then converted to CMTPedS category scores ranging from 0–4 (0 being unaffected and 4 being severely affected). A category score of 0 indicates a z-score ±1SD from the normative reference value mean. A category score of 1, 2 or 3 represents a z-score of 1–2, 2–3 or 3–4 SDs below normal, respectively. A score of 4 represents >4 SDs below normal. Participants unable to perform an item due to disease severity received a score of 4. Participants unable to perform an item for other reasons (e.g. acute injury, post-surgery, behavioural issues) were not scored and a total score was not calculated. The 11 item category scores are summed to obtain a disease severity score out of 44 with 0 being unaffected and 44 being severely affected.
Statistical analysis
Data were analysed using SPSS v. 22.0 (IBM Corp. Armonk, NY). All data were assessed for normality and the appropriate parametric or non-parametric test subsequently employed. Frequency of CMT types and self-reported symptoms were calculated as percentages. A one-sample t-test was employed to compare foot alignment between children and young adults with CMT and the average normative reference values for unaffected children and young adults.11 A 2×17×5 (sex × age [years] × CMT type [1A, 1B, 2A, 4C, X1]) way ANOVA was performed to evaluate differences in CMTPedS total scores as well as individual item z-scores. Significant interactions were examined with Tukey's post hoc tests. A bivariate correlation matrix was conducted to determine the influence of age, height, weight, BMI percentile, symptoms, foot alignment and ankle flexibility on CMTPedS total scores. Significantly correlated items were entered into a stepwise multiple regression model which was reduced to the most parsimonious model to determine if the CMTPedS total score could be explained by these factors. Only one factor from highly correlated variables (such as height, weight, BMI) was included to avoid multicolinearity. Standardized β weights were calculated. An alpha level of 0.05 was used for statistical significance.
Results
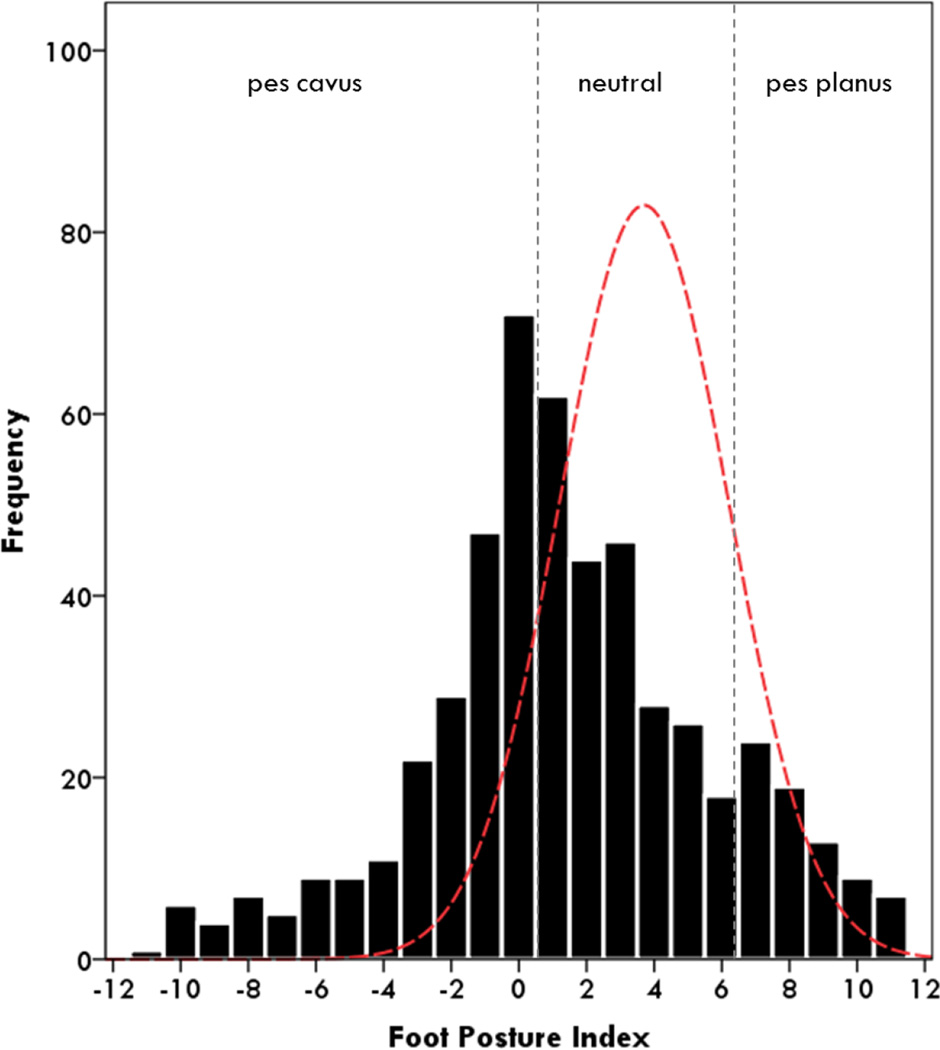
This study included 520 children and young adults (274 male) aged 3–20 years (Table 1). An extensive number of CMT types were represented with the most prevalence types being: CMT1A (54%), CMT2A (6%), CMT1B (3%), CMT4C (3%) and CMTX1 (2%) (Table 2). There were no significant differences in age between the 5 most common types (p<0.05). Foot alignment of participants with CMT was more cavovarus than unaffected children and young adults (p<0.001), however there was a wide range of planus-cavus foot postures (Figure 1). Unsteady ankles, daily trips and falls and hand weakness were the most frequently reported symptoms for the entire cohort, however when split for CMT type the frequencies varied significantly between types (Table 3). Participants with CMT2A reported a significantly higher frequency of unsteady ankles, daily trips/falls and hand tremor than CMT1A (p<0.05), while CMT1B reported significantly more hand weakness than CMT1A (p<0.05) (Table 3).
Table 1.
Physical characteristics of the sample (n=520)
| Mean ± SD | Min | Max | |
|---|---|---|---|
| Age (yrs) | 10.9 ± 4.4 | 3 | 20 |
| Height (m) | 1.44 ± 0.24 | 0.90 | 1.98 |
| Weight (kg) | 42.2 ± 19.7 | 11.2 | 120.6 |
| BMI (kg/m2) | 19.1 ± 4.9 | 11.0 | 58.2 |
| BMI Percentile | 53.2 ± 32.5 | 0.0 | 99.9 |
| Foot Posture Index | 1.4 ± 4.4 | −12 | 12 |
| Ankle Lunge Test (deg) | 22.3 ± 8.3 | 0.0 | 50.0 |
| CMTPedS Total Score | 21.5 ± 8.9 | 1 | 44 |
yrs, years; m, metres; kg, kilograms; BMI, body mass index.
Table 2.
Frequency of CMT types (n=520)
| CMT type | N | Percent of sample |
|---|---|---|
| 1A | 252 | 54.2 |
| 1B | 15 | 2.9 |
| 1C | 1 | 0.2 |
| 1E | 9 | 1.7 |
| 1F | 2 | 0.4 |
| 1, unknown subtype | 12 | 2.3 |
| 2A | 31 | 6.0 |
| 2C | 1 | 0.2 |
| 2D | 4 | 0.8 |
| 2E | 3 | 0.6 |
| 2, unknown subtype | 30 | 5.8 |
| 4A | 3 | 0.6 |
| 4B | 2 | 0.4 |
| 4C | 13 | 2.5 |
| 4F | 1 | 0.2 |
| 4H | 1 | 0.2 |
| 4J | 4 | 0.8 |
| CMTX1 | 10 | 1.9 |
| CMTX3 | 6 | 1.2 |
| HNPP | 5 | 1.0 |
| HMN | 2 | 0.4 |
| HSN | 2 | 0.4 |
| Unknown | 81 | 15.6 |
Figure 1.
Foot alignment frequency measured by the Foot Posture Index (FPI).
Dashed curve indicates normative values for unaffected children and young adults11. FPI significantly more pes cavus for children and young adults with CMT than normative reference values (p<0.001).
Table 3.
Frequency of self-reported symptoms amongst the sample (n=520)
| Symptom | Total sample | CMT1A | CMT1B | CMT2A | CMT4C | CMTX1 |
|---|---|---|---|---|---|---|
| Foot pain | 40% | 38% | 27% | 39% | 39% | 40% |
| Leg cramps | 35% | 34% | 47% | 45% | 31% | 20% |
| Unsteady ankles | 52% | 45% | 47% | 68%* | 54% | 60% |
| Daily trips and falls | 42% | 36% | 60% | 58%* | 62% | 30% |
| Hand pain | 22% | 22% | 7% | 29% | 8% | 30% |
| Hand weakness | 42% | 35% | 60%* | 48% | 54% | 40% |
| Hand tremor | 34% | 33% | 27% | 55%* | 15% | 40% |
| Sensory symptoms | 28% | 27% | 13% | 26% | 39% | 20% |
significantly different to participants with CMT1A (p<0.05)
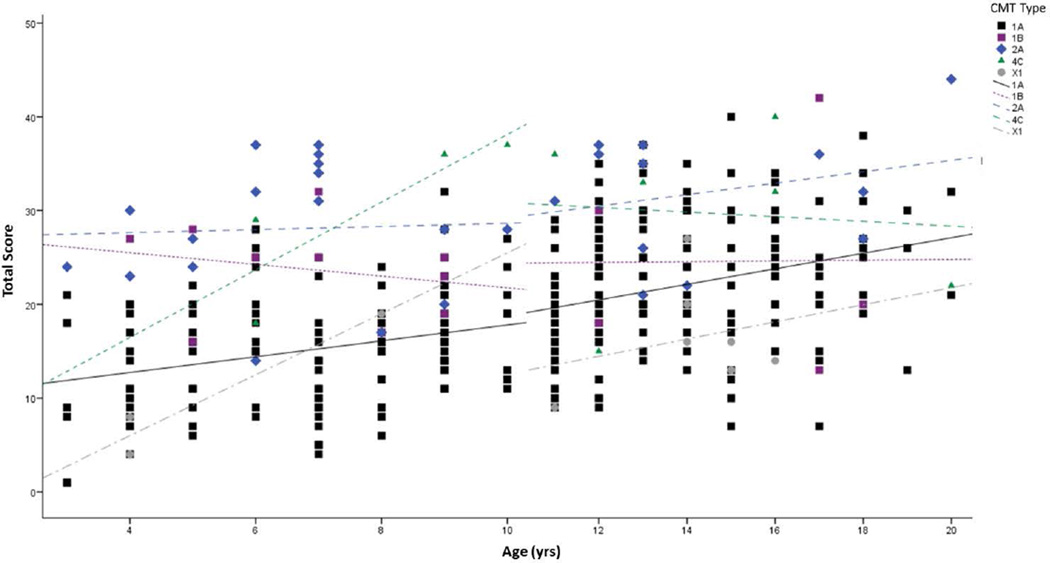
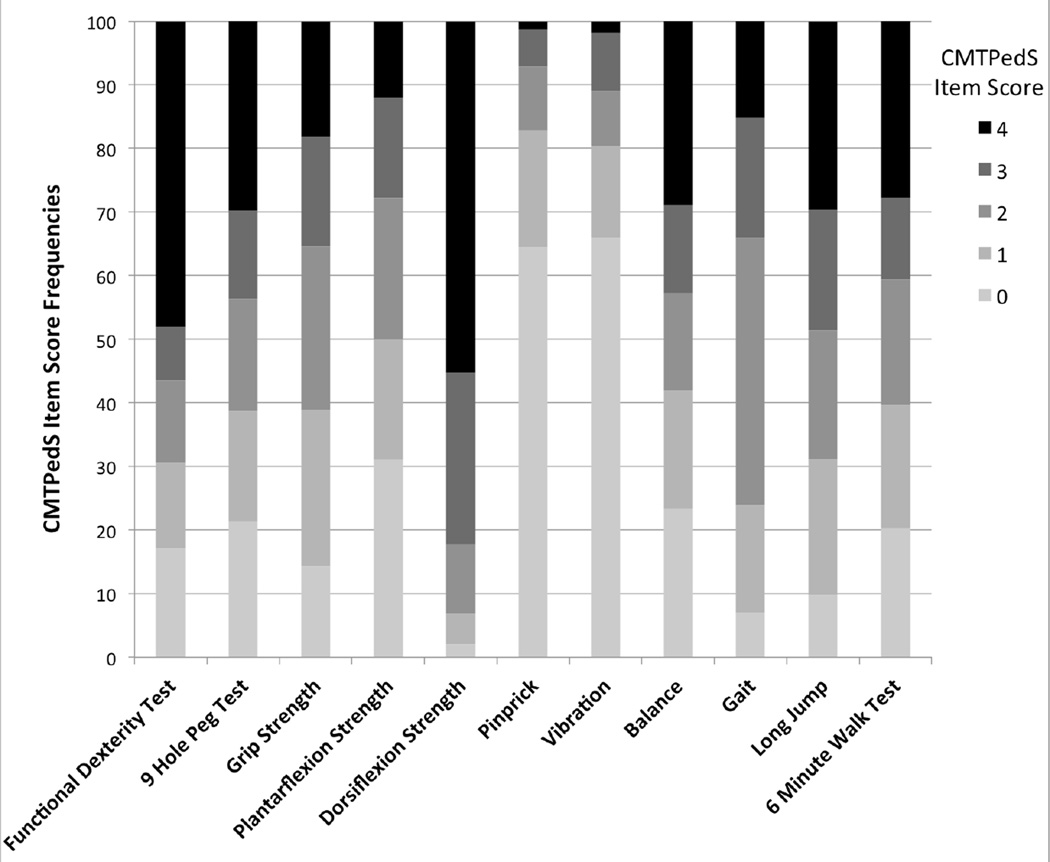
A total of 474 children and young adults were able to complete all 11 items of the CMTPedS to obtain a total disease severity score. The mean CMTPedS total score for the entire sample was 21.5±8.9 (range 1–44) (Figure 2). The most affected items were dorsiflexion strength of the ankle and functional dexterity test of the hand with respectively 82% and 56% of cases >3 SDs below normal (Figure 3). ANOVA indicated a significant interaction between age and CMT type on the CMTPedS score (F(33,245)=1.836, p=0.005) whereby the CMTPedS score worsened with age (F(17,245)=2.334, p=0.003). CMTPedS tended to worsen principally during childhood (3–10 years) for CMT4C and CMTX1, and worsen predominantly during adolescence for CMT1B and CMT2A (11–20 years), while CMT1A worsened consistently throughout childhood and adolescence (Figure 4).
Figure 2.
CMTPedS total score differences between CMT subtypes
Values are mean ± 95% CI. *Significantly different to CMT1A (p<0.05); aSignificantly different to CMTX1 (p<0.05); bSignificantly different to CMT2A (p<0.05).
Figure 3.
CMTPedS item score frequencies
A score of 0 indicates <1 SD below normative reference values (unaffected); 1 indicates a score between 1 and 2 SDs below normal (mildly affected); 2 indicates a score between 2 and 3 SDs below normal (moderately affected); 3 indicates a score between 3 and 4 SDs below normal (severely affected); 4 indicates a score > 4 SDs below normal (very severely affected).
Figure 4.
CMTPedS scores during childhood and adolescence for CMT subtypes. Individual data points are plotted with linear correlation best fit lines indicating change during childhood (3–10 years) and adolescence (11–20 years).
CMT type also significantly influenced the CMTPedS score (F(4,245)=17.582, p<0.001) (Figure 2). Participants with CMT1A and CMTX1 demonstrated a significantly better CMTPedS score than CMT1B (p=0.016; p<0.001), CMT2A (p<0.001; p<0.001) and CMT4C (p<0.00; p<0.001) while participants with CMT1A had a significantly worse CMTPedS score than CMTX1 (7 male, 3 female) (p=0.015). Participants with CMT1B exhibited a significantly better CMTPedS scores than CMT2A (p=0.018) and CMT4C (p=0.03). There was no significant effect for sex for any CMT type (p=0.774). Of note, males (15.3±7.7) with CMTX1 were marginally more affected than females (13.0±3.6) however this was not significant (p=0.65).
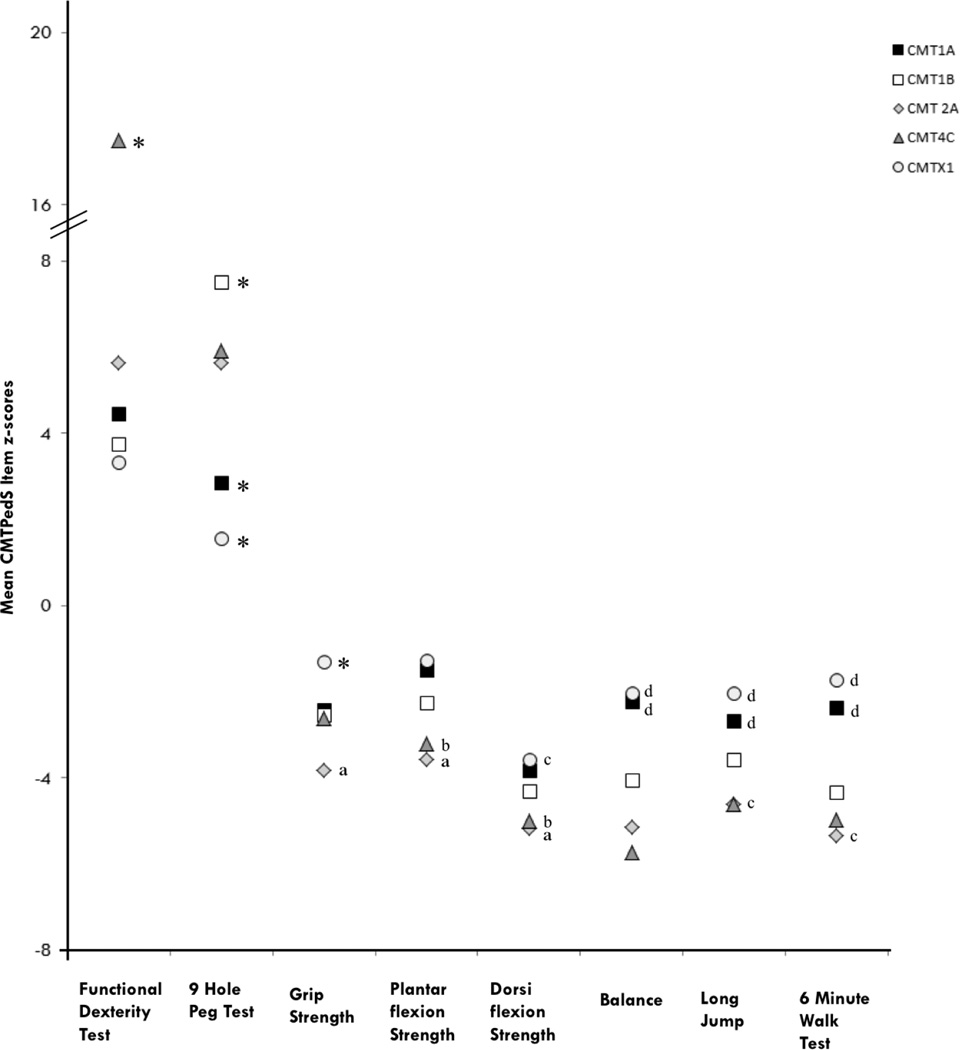
For individual CMTPedS item z-scores there was a significant effect for age (p<0.05), whereby increasing age produced a worse score for each item. There was also a significant effect for sex on the 9 hole peg test (F(1,258)=10.856, p=0.001) where females performed slower than males. No other items had a significant effect for sex (p>0.05). CMT type had a significant effect on all CMTPedS item z-scores (p<0.05) (Table 4) (Figure 5). For the functional dexterity test, participants with CMT4C were significantly slower than all other CMT types (p<0.001). For the 9 hole peg test, participants with CMT1A were significantly faster than types 1B, 2A and 4C (p<0.05) while participants with CMTX1 were significantly faster than all other types (p<0.05). Participants with CMT2A demonstrated significantly weaker grip strength than types 1A, 1B and X1 (p<0.05) and participants with CMTX1 were significantly stronger than all other types (p<0.05). Participants with CMT2A and CMT4C had significantly weaker ankle plantarflexion and dorsiflexion strength than types 1A and X1 (p<0.05) as well as reduced long jump and 6 minute walk test distance. Participants with CMT2A were significantly worse for ankle strength, long jump and 6 minute walk test distance than CMT1B (p<0.05). Participants with CMT1A and CMTX1 had significantly better balance than participants with types 1B, 2A and 4C (p<0.05).
Table 4.
Correlation matrix of variables associated withCMTPedSscore
| Variable | CMTPedS Score | p-value |
|---|---|---|
| Age | 0.350 | <0.001 |
| Sex | −0.085 | 0.064 |
| Height | 0.251 | <0.001 |
| Weight | 0.232 | <0.001 |
| BMI Percentile | −0.110 | 0.024 |
| Foot Posture Index | −0.032 | 0.486 |
| Ankle Lunge Test | −0.076 | 0.113 |
| Foot Pain | 0.155 | 0.001 |
| Leg Cramps | 0.163 | <0.001 |
| Unsteady Ankles | 0.191 | <0.001 |
| Daily Trips and Falls | 0.074 | 0.107 |
| Hand Pain | 0.055 | 0.230 |
| Hand Weakness | 0.263 | <0.001 |
| Hand Tremor | 0.197 | <0.001 |
| Sensory Symptoms | 0.125 | 0.006 |
Values are Pearson’s correlation Coefficients; FPI, foot posture index.
Figure 5.
CMTPedS item z-score differences between CMT subtypes
Functional dexterity test and nine hole peg test are timed tests so a positive z-score indicates a longer time and therefore a worse performance. For all other measures a negative z-score indicates a worse performance. *Significantly different to all other types (p<0.05); aSignificantly different to CMT1A, CMT1B, and CMTX1 (p<0.05); bSignificantly different to CMT1A and CMTX1 (p<0.05); cSignificantly different to CMT1B (p<0.05); d Significantly different to CMT1B, CMT2A and CMT4C (p<0.05).
Significant correlations with the CMTPedS score were identified for age, height, weight, BMI percentile, foot pain, unsteady ankles, leg cramps, hand weakness, hand tremor, sensory symptoms, (Table 4). Multiple regression modelling identified increasing age, height, self-reported foot pain and self-reported hand weakness as independent predictors of disease severity, explaining 21% of the variance in CMTPedS total score (Table 5).
Table 5.
Multiple regression of items predicting the CMTPedS score
| Variable | Correlation (r) | β | p-value |
|---|---|---|---|
| Increasing age | 0.356 | 0.617 | <0.001 |
| Increasing height | 0.251 | −0.309 | 0.002 |
| Presence of foot pain | 0.162 | 0.114 | 0.009 |
|
Presence of hand weakness |
0.243 | 0.203 | <0.001 |
| Total: r2 = 0.210 | |||
Discussion
This sample of 520 children and young adults with CMT is the largest reported to date and shows the phenotypic variability within CMT genotypes and mutation-specific manifestations between types. Disease severity, measured by the well-validated CMTPedS, ranged from 1–44 and represents almost the entire spectrum of the scale. CMTPedS scores for the five most prevalent genotypes differed significantly. For instance, the most common type of CMT, CMT1A, demonstrated a mean CMTPedS score of 19±8 while participants with CMT2A exhibited a mean CMTPedS score of 30±7 and those with CMTX1 had a mean score of 15±7. This study has identified distinct functional limitations and self-reported impairments. For example, participants with CMT2A were significantly weaker for all strength measures and those with CMT4C performed significantly worse for both hand dexterity measures.
Compared to previous studies exploring the heterogeneity of CMT severity,3,12 our larger cohort in this study containing subtypes of more than 10 participants for most types provided the opportunity to examine phenotypic differences between genotypes. When evaluating CMTPedS scores, children and young adults with CMT1A and CMTX1 were less severely affected than CMT1B, 2A and 4C. CMT2A, specifically caused by MFN2 mutations, has previously been reported to present a more severe phenotype6 than other CMT2 types however was not compared to CMT1, CMT4 or CMTX. CMT4C was recently reported to have a variable phenotype in a study of 10 siblings7 however its severity has not been previously compared to other CMT types. The findings of our study confirm this variability with a CMTPedS score range of 15–40. The disease severity of CMT4C (CMTPedS total score mean 29.8±8.6) was similar to that of CMT2A (average 29.7±7.1) and worse than that of CMT1A (average 18.9±7.7). Specifically, we identified hand dexterity as a major limitation for children and young adults with CMT4C. Participants with CMT4C also exhibited significantly reduced sensation compared to CMT1A (p<0.001). Although sensation was only measured by vibration and pinprick in the lower limbs in this study, reduced sensation may be globally limiting hand dexterity in these participants. Variability has also been reported within other CMT subtypes.4,8 For instance, in CMT1B different MPZ mutations may cause different disease severity.8 The reason for the variability is not well understood. A recent study reported that participants with CMT had more rare variants in neuropathy-associated genes compared to unaffected participants and hence suggested that mutation burden in neuropathy participants may contribute to the phenotypic variability.5 Further studies following our cohort longitudinally will investigate if the disease progression within different types of CMT is also variable.
In our cohort, the 7 males with CMTX1 were marginally more affected than the females with CMTX1 however this was not significant. It has previously been reported that males with CMTX1 demonstrate a milder phenotype during the first two decades of life with increasing severity later in life.4,13 However, this study suggests that the CMTPedS scores change more rapidly in childhood compared to adolescence in participants with CMTX1. Longitudinal studies of this cohort will further explore the rate of disease progression in the future natural history studies in this cohort.
CMT is classically described as ‘length dependent’ with lower limb manifestations reported to precede upper limb involvement14. The finding of height as an independent predictor of disease severity supports the length-dependency theory. Our study indicates that ankle dorsiflexion strength and functional hand dexterity test are the most affected items on the scale suggesting that both upper limb and lower limb manifestations are present from an early age across all CMT types. This confirms a previous report that upper limb impairment can be identified in children with CMT1A as young as 3 years of age15. In addition, the significant differences between CMT types for the upper limb measures indicate that some forms may have greater hand impairment. Specifically, children and young adults with CMT4C performed much worse on the functional dexterity test than the other types of CMT. Children and young adults with CMT1B, CMT2A and CMT4C all performed worse on the 9 hole peg test, when compared to CMT1A, suggesting that hand and finger dexterity are more significantly affected in these types.
Cross-sectional studies are useful in that they can give some prediction for longitudinal data when one correlates subtypes, in this case, with age. Figure 4 shows that CMTPedS scores seem to change more rapidly in childhood for CMT4C and CMTX1 and more rapidly during adolescence for CMT1B and CMT2A, while a consistent progression was observed in participants with CMT1A. Indeed multiple regression modelling indicated older age as well as increasing height, self-reported foot pain and hand weakness symptoms best predicted the CMTPedS total score. Interventions addressing foot pain and hand weakness may be appropriate therapeutic targets to reduce disease severity. Although, as only 21% of the variance in CMTPedS total score could be explained by these factors, specifically targeting the most affected CMTPedS items (e.g. ankle dorsiflexion strength) may also be appropriate to reduce disability. Additionally, interventions targeting hand function, specifically hand and finger dexterity might provide further benefits to reduce disease severity. Nevertheless before treatment trials can be conducted, it is important to understand the rate of disease progression in longitudinal natural history studies of children and young adults with CMT.
This study provides a comprehensive phenotypic characterisation of CMT both within and between CMT types in children and young adults. Phenotypic variability within CMT genotypes and mutation-specific manifestations between types was identified. CMT1B, CMT2A and CMT4C were more severely affected than CMT1A and CMTX1. The most affected aspects of disease severity were ankle dorsiflexion strength and hand dexterity. This study highlights that significant impairment is present from the earliest stages of the disease, even in the milder CMT1A and CMTX1 types. Therefore, any disease modifying therapies that aim to slow or halt disease progression should ideally be implemented during childhood. These therapies may have limited benefits once significant axonal degeneration has occurred in older populations. Understanding these genotype-phenotype correlations will assist with accurately targeting future therapeutic trials in children and young adults with CMT.
Acknowledgments
We acknowledge support from the National Institutes of Neurological Diseases and Stroke and office of Rare Diseases (U54NS065712). The INC (U54NS065712) is a part of the NCATS Rare Diseases Clinical Research Network (RDCRN). The authors would like to acknowledge Prof Stephen Reddel for his input on the length-dependency analysis.
MMR is grateful to the Medical Research Council (MRC), MRC Centre grant (G0601943).
MMR and ML are grateful to the National Institute for Health Research University College London Hospitals Biomedical Research Centre.
FM wishes to acknowledge the support of the MRC Neuromuscular centre and of the Great Ormond Street Hospital Biomedical Research Centre.
DP acknowledges support from Charcot-Marie-Tooth Association and Muscular Dystrophy Association.
JB acknowledges support from the NHMRC (National Health and Medical Research Council of Australia, Centre of Research Excellence #1031893), Muscular Dystrophy Association, CMT Association of Australia.
KC acknowledges financial support from the Natural Sciences and Engineering Research Council of Canada and her University of Sydney International Scholarship.
Footnotes
Conflicts of Interest: None
References
- 1.Skre H. Genetic and clinical aspects of Charcot-Marie-Tooth's disease. Clinical Genetics. 1974;6(2):98–118. doi: 10.1111/j.1399-0004.1974.tb00638.x. [DOI] [PubMed] [Google Scholar]
- 2.Rossor AM, Polke JM, Houlden H, Reilly MM. Clinical implications of genetic advances in Charcot–Marie–Tooth disease. Nature Reviews Neurology. 2013;9(10):562–571. doi: 10.1038/nrneurol.2013.179. [DOI] [PubMed] [Google Scholar]
- 3.Burns J, Ouvrier R, Estilow T, et al. Validation of the Charcot–Marie–Tooth disease pediatric scale as an outcome measure of disability. Annals of Neurology. 2012;71(5):642–652. doi: 10.1002/ana.23572. [DOI] [PMC free article] [PubMed] [Google Scholar]
- 4.Fridman V, Bundy B, Reilly M, et al. CMT subtypes and disease burden in patients enrolled in the Inherited Neuropathies Consortium natural history study: a cross-sectional analysis. Journal of Neurology, Neurosurgery & Psychiatry. 2014;86(8):873–878. doi: 10.1136/jnnp-2014-308826. [DOI] [PMC free article] [PubMed] [Google Scholar]
- 5.Gonzaga-Jauregui C, Harel T, Gambin T, et al. Exome Sequence Analysis Suggests that Genetic Burden Contributes to Phenotypic Variability and Complex Neuropathy. Cell Reports. 2015;12(7):1169–1183. doi: 10.1016/j.celrep.2015.07.023. [DOI] [PMC free article] [PubMed] [Google Scholar]
- 6.Feely S, Laura M, Siskind C, et al. MFN2 mutations cause severe phenotypes in most patients with CMT2A. Neurology. 2011;76(20):1690–1696. doi: 10.1212/WNL.0b013e31821a441e. [DOI] [PMC free article] [PubMed] [Google Scholar]
- 7.Varley TL, Bourque PR, Baker SK. Phenotypic variability of CMT4C in a French-Canadian kindred. Muscle & Nerve. 2015;52(3):444–449. doi: 10.1002/mus.24640. [DOI] [PubMed] [Google Scholar]
- 8.Sanmaneechai O, Feely S, Scherer SS, et al. Genotype-phenotype characteristics and baseline natural history of heritable nueropathies caused by mutations in the MPZ gene. Brain. 2015:1–13. doi: 10.1093/brain/awv241. [DOI] [PMC free article] [PubMed] [Google Scholar]
- 9.Redmond AC, Crosbie J, Ouvrier RA. Development and validation of a novel rating system for scoring standing foot posture: the Foot Posture Index. Clinical Biomechanics. 2006;21(1):89–98. doi: 10.1016/j.clinbiomech.2005.08.002. [DOI] [PubMed] [Google Scholar]
- 10.Bennell K, Khan K, Matthews B, Singleton C. Changes in hip and ankle range of motion and hip muscle strength in 8–11 year old novice female ballet dancers and controls: a 12 month follow up study. British Journal of Sports Medicine. 2001;35(1):54–59. doi: 10.1136/bjsm.35.1.54. [DOI] [PMC free article] [PubMed] [Google Scholar]
- 11.Redmond AC, Crane YZ, Menz HB. Normative values for the foot posture index. Journal of Foot and Ankle Research. 2008;1(1):6. doi: 10.1186/1757-1146-1-6. [DOI] [PMC free article] [PubMed] [Google Scholar]
- 12.Burns J, Menezes M, Finkel RS, et al. Transitioning outcome measures: relationship between the CMTPedS and CMTNSv2 in children, adolescents, and young adults with Charcot-Marie-Tooth disease. Journal of the Peripheral Nervous System. 2013;18(2):177–180. doi: 10.1111/jns5.12024. [DOI] [PMC free article] [PubMed] [Google Scholar]
- 13.Shy M, Siskind C, Swan E, et al. CMT1X phenotypes represent loss of GJB1 gene function. Neurology. 2007;68(11):849–855. doi: 10.1212/01.wnl.0000256709.08271.4d. [DOI] [PubMed] [Google Scholar]
- 14.Lencioni T, Piscosquito G, Rabuffetti M, et al. The influence of somatosensory and muscular deficits on postural stabilization: insights from an instrumented analysis of subjects affected by different types of Charcot-Marie-Tooth disease. Neuromuscular Disorders. 2015 doi: 10.1016/j.nmd.2015.05.003. [DOI] [PMC free article] [PubMed] [Google Scholar]
- 15.Burns J, Bray P, Cross LA, North KN, Ryan MM, Ouvrier RA. Hand involvement in children with Charcot–Marie-Tooth disease type 1A. Neuromuscular Disorders. 2008;18(12):970–973. doi: 10.1016/j.nmd.2008.08.004. [DOI] [PubMed] [Google Scholar]


