Abstract
We have performed a series of experiments which demonstrate the effect of open-ended coaxial diameter on the depth of penetration. We used a two layer configuration of a liquid and movable cylindrical piece of either Teflon or acrylic. The technique accurately demonstrates the depth in a sample for which a given probe diameter provides a reasonable measure of the bulk dielectric properties for a heterogeneous volume. In addition we have developed a technique for determining the effective depth for a given probe diameter size. Using a set of simulations mimicking four 50 Ω coaxial cable diameters, we demonstrate that the penetration depth in both water and saline has a clear dependence on probe diameter but is remarkably uniform over frequency and with respect to the intervening liquid permittivity. Two different 50 Ω commercial probes were similarly tested and confirm these observations. This result has significant implications to a range of dielectric measurements, most notably in the area of tissue property studies.
Keywords: Dielectric, open-ended coaxial probe, penetration depth, probe diameter, tissue properties
I. Introduction
Tissue dielectric properties have been studied for many decades for multiple possible uses [1]-[3]. Tissues with large proportions of polar molecules – primarily water, generally have high permittivity while non-polar compounds – such as adipose tissue – have low permittivity [2]. These properties are often remarkably instructive with respect to identifying unwanted pathologies such as breast cancer or for the identification of edema in post surgical care [4]-[10]. Research groups have been interested in exploiting tissue contrast between benign and malignant breast cancer for years with several systems recently translating to actual clinical use [11,12]. At a basic level, this contrast is largely a water effect because the predominant adipose tissue has much lower dielectric properties than the higher water content tumors [4,5,13]. However, more sophisticated analyses have suggested that mechanisms such as bound water effects may also play a role over particular frequency ranges [14,15]. Expanding on the water theme, a new series of coaxial probes has been developed that can monitor cutaneous and fat water levels based on elevated dielectric property levels [16]. A modestly priced device is now commercially available and has been applied to a range of diagnostic indications such as lymphedema monitoring and wound healing [8,17-20]. Early work tended to focus on lower frequency studies because of test equipment limitations and the tissue preparation necessary [21]. Nelson [22] presented a thorough summary of measurement hardware and algorithms used over a broad frequency range including single and multi-frequency, time domain and transmission and reflection modes. In spite of these challenges, important insights were developed with respect to tissue property dispersions and the effects of various phenomena such as bound water [15].
For most measurement techniques, the basic rationale was to interrogate the tissue with microwave fields and deduce what the dielectric properties must have been to perturb the field measurements from when nothing was present to when the sample was in place [22]. One of the more important innovations in this field came with the advent of the open-ended coaxial dielectric probe [23,24]. In this instance, the field interrogation occurred at the end of an open-ended coaxial cable where changes in the reflected signal are uniquely tied to the tissue dielectric properties. Numerous algorithms have been developed for deducing the properties from measurements depending on the models and approximations used to represent the fields at the end of the coaxial line [25]-[28]. These range from simple methods using fringing capacitance at the probe tips to more sophisticated techniques that match the range of coaxial and free space propagation modes [26,29,30]. These have been widely used for testing a range of tissue types over very large frequency ranges [31]-[33].
One of the more challenging issues for the open-ended coaxial probe is the effective penetration depth in a heterogeneous sample. A report by Hagl et al. [34] demonstrated that for a 2.3 mm diameter dielectric probe, a homogeneous sample size needed to be 3 mm deep to ensure an accurate measurement. However, that result has been extrapolated to measurements for a range of homogeneous and heterogeneous tissue samples [35,36] without validation in a systematic study on a heterogeneous phantom. Examples exist where small probes have been used to measure in vivo breast tissue through the skin while applying the assumption that the skin was sufficiently thin as to only slightly perturb the breast tissue property measurement [37]. Not surprisingly, the measurements produced values consistent with that of skin. Practitioners of this technique are well aware of the importance of probe contact to the sample and the concomitant problems associated with measuring solids [29]. Application notes published by Keysight Technologies explicitly discourage use with solids because even the slightest air gaps can dramatically skew the desired measurements [38,39]. Both of these examples suggest that the volume closest to the probe surface is especially important with respect to a bulk measurement.
In a recent publication by Meaney et al. [40], the authors demonstrated in a controlled, two-layered phantom experiment that the first 0.3 mm of the sample closest to the probe tip has a disproportionally large influence on the tissue properties compared to the subsequent 2.7 mm (for a total of a 3 mm deep sensing volume) for the 2.3 mm diameter probe used in the Lazebnik studies [35,36]. This result was for a single probe diameter and illustrated the fact that the sample zone influence was essentially constant over a broad frequency range.
Exact knowledge of the penetration depth can have significant ramifications in certain applications. For instance, Meaney et al. [41] have utilized a small diameter probe to acquire superficial measurements of teeth surfaces to distinguish between actual tooth enamel and restorative dental resins for use in electron paramagnetic resonance (EPR) radiation dose experiments. For this situation it was critical that the measurement be predominantly superficial and not include contributions from the underlying dentin and other tissue types. Karni et al. [42] reported clinical results using a 7 mm diameter probe to effectively sense the margins in breast cancer conservation surgeries to minimize re-excisions. The probe can sense to within 1 mm depth which is an acceptable distance for detecting tumor margins. This penetration depth is consistent with measurements discussed in this paper. Other reports have applied small probes for superficial measurements such as for skin hydration [43], and various thin packaging materials [44,45]. In related multi-layer studies, researchers explored ways to acquire multiple measurements in efforts to deconvolve the exact properties at different levels [46,47]. The former of these two developed their own technique for determining an effective penetration depth which is similar in some respects to that described in this paper. This effort was primarily geared towards differentiating the properties of skin and subcutaneous fat. It did indicate that the penetration depth was primarily a function of the probe diameter but the results were limited to simulations and only performed at a quite low frequency – 394 MHz. From a scientific perspective, our results are an important validation of this earlier report and emphasize where more recent instances did not considered these earlier analyses [35,36]. The latter study [47] developed a clever way to accurately determine the dielectric properties of a homogeneous material in cases where there was a thin intervening layer of unknown thickness. It is an important result in that it deals with the multi-layer property measurement problem, but provides only minimal insight into discerning an effective penetration depth.
In the present study, we utilize the same measurement configuration but with a range of different diameter open-ended coaxial probes to illustrate that the effective penetration depth of penetration is closely related to the probe diameter. We have developed a technique for systematically determining an effective penetration depth that explicitly attempts to identify a region below the probe surface where both the intervening liquid and solid sample have representative influence on the bulk tissue property measurements. The first results illustrate the electrical fields for two different layered medium cases to demonstrate how quickly the fringing fields fall off from the probe surface. The second results are a set of simulations for four different, commercially available, diameter coaxial cables performed at 2 and 4 GHz in both water and physiological saline, respectively, for correlation with the results presented in Meaney et al [40]. The next set are a combination of simulation and actual measurements performed at 300 MHz for a set of different diameter probes manufactured as a clinical product for assessing cutaneous edema [48] and the standard Slim Form Dielectric Probe manufactured by Keysight Technologies, Inc. (Santa Clara, CA). Given the broadband nature of this phenomenon, these results are representative of the behavior over a broader spectrum. Finally, we present simulation data demonstrating that the penetration depths are virtually constant over frequency and with respect to the permittivities of the intervening liquids but are linearly dependent on probe diameter. The following sections describe the measurement procedure in detail, the associated results for the different diameter probes and the analysis for determining the effective penetration depth.
II. Methods
A. Simulations of the Dielectric Probes
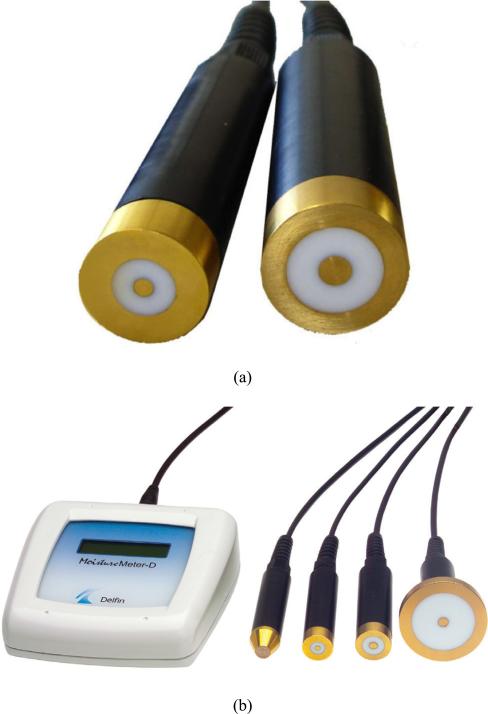
CST Microwave Studio software (Framingham, MA) was used to measure the fields in the proximity of the dielectric probes used in these experiments. For these situations, the differences in the fields and how they were impacted by the presence of objects other than the homogeneous medium were examined. In particular, tests were performed for a large dielectric cylinder as it approached the probe surface. Simulations were examined for low frequencies (300 MHz) for the larger Delfin probes and higher frequencies (2 and 4 GHz) for the different RG-designated cables, respectively. Dimensions of the probes tested match those for two probes manufactured by Delfin Technologies (Figure 1a, Table I) and for four commercially available, 50 Ω probes fabricated from semi-rigid coaxial cables – radio guide designations UT-047-M17 (does not have an RG designation), RG-405 (essentially equivalent to the Keysight Technologies Slim Form Dielectric Probe), RG-402, and RG-401, respectively (Table II). The reflection coefficients were computed using methods developed by Hodgetts [49] and later validated experimentally by Gregory et al [50]. These S11 values are ultimately used to determine the perceived dielectric properties at the probe interface. The technique assumes a large surrounding cylinder which is sufficiently large to have minimal impact on the measurements. However, in the case of the largest probe (M25) tested at 300 MHz, because the losses of the liquid and that of the acrylic cylinder are quite low, it is difficult to completely dampen the minor standing waves and the associated errors increased to roughly 2 – 3%. For the purposes of illustrating the effects of the probe diameter on the penetration depth, this approach is adequate.
Fig. 1.
Photographs of (a) the two probes used in this experiment, and (b) the complete measurement system.
TABLE I.
Diameters of the two Delfin Technologies probes (Figure 1)
| Probe | Center Conductor Diam. (mm) | Insulator Outer Diam. (mm) | Outer Coax Diam. (mm) |
|---|---|---|---|
| S15 | 3.0 | 10.0 | 18.0 |
| M25 | 5.0 | 15.0 | 21.0 |
TABLE II.
Diameters of the four 50 Ω probes simulated in these experiments
| Probe | Center Conductor Diam. (mm) | Insulator Outer Diam. (mm) | Outer Coax Diam. (mm) |
|---|---|---|---|
| UT-047-M17 | 0.32 | 0.94 | 1.19 |
| RG405 | 0.57 | 1.68 | 2.18 |
| RG402 | 1.02 | 2.99 | 3.58 |
| RG401 | 1.83 | 5.44 | 6.35 |
B. Calculation of the Dielectric Properties from Actual S11 Values
For the actual measurements, the dielectric probes in this case were tested at 300 MHz. The technique for extracting the dielectric properties from the measurements utilized a variational approximation of the coaxial probe which is considered as an electrostatic circuit element whose capacitance is computed using a stationary functional. The fundamental TEM modes and evanescent wavemodes within the cable are used as basis functions while the fields outside the probe are represented with Hankel functions. The probes were calibrated using a common set of calibration standards including air, water:ethanol mixtures and water. S11 measurements of these known standards were taken with the Delfin probes and the corresponding measurement system along with an open-ended coaxial probe in conjunction with an HP8753B vector network analyzer (VNA). The Delfin probes were calibrated against the VNA measurements utilizing a standard curve fitting procedure. The overall approach and validation tests are described thoroughly in Alanen et al. [29]. The static approximations limit the model's use to frequencies below 500 MHz, but are more than sufficient for these 300 MHz experiments. The method has been proven to be accurate and easy to implement.
In the case of the simulated results, the inversion technique to recover the complex permittivity from the S11 data utilized a gradient-descent method with first order differentiation developed by Grant et al. [30]. It has been validated with respect to probe dimensions over a range of dielectric properties and associated frequencies.
C. Effective Penetration Depth Determination
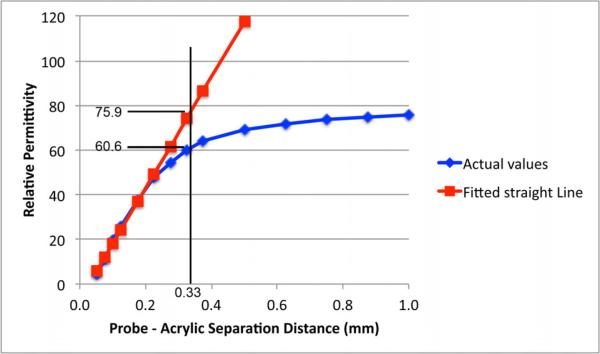
Dielectric probe measurements are most useful when they provide relatively even weight to contributions to the bulk properties from different depths from the probe. This implies that for a two layer problem, the properties should vary almost linearly from that of one material to that of the other for the region within the effective penetration depth as the solid object is moved away from the probe. This is illustrated in the sample experiment using a 2.16 mm diameter probe (Keysight Technologies Slim Form Dielectric Probe) and plotting the perceived relative permittivity as a function of distance for a Teflon cylinder submerged in water (Figure 2). Note that Teflon was used only for this experiment while an acrylic cylinder was used for all remaining experiments. In this example the curve is virtually linear until a separation of 0.22 mm after which it tails off and asymptotically approaches the properties of water. We have defined the effective penetration depth as the distance when the perceived properties at that separation distance drop 20% below that of the ideal straight line extrapolated from the straightest section of the curve beginning at exact contact. In this case, we define the right position of the straight section for where the fit to a straight line for the section below it has a straight line correlation coefficient of 0.99. (As more data points at greater distances are included, the curve deviates progressively from a straight and the correlation coefficient decreases.) For this calculation, the straight line was represented as y = m1x + b1 where m1 is the slope and b1 is the y-intercept. Because the actual curve is comprised of discrete points, it is unlikely that any point would fall exactly 20% below the straight line. To overcome this problem, a linear interpolation process is applied using the two points on the curve closest to the 20% reduction from the straight line location. The equation for these two points can be constructed for that line segment represented by, y = m2x + b2, where m2 is the slope and b2 is the y-intercept, respectively. Combining these two equations and using the 20% permittivity reduction definition, the penetration depth is defined as
| (1) |
Fig. 2.
Example of calculation used to determine the penetration depth. Data is from measurements for a 2.16 mm diameter Slim Form Dielectric Probe (Keysight Technologies) submerged in water with a Teflon cylinder for the second layer.
In this case the slope of the line was 249 relative permittivity units/mm with an R2 value of 0.993. The point at which the perceived value drops 20% below the fitted curve value occurs at a separation of 0.33 mm (interpolated from the nearest data points). The associated perceived relative permittivity values for the actual curve and fitted straight line were 60.6 and 75.9, respectively. It should be noted that for this test the acrylic cylinder was replaced with a Teflon one. The overall curve is offset slightly to the right because the Teflon is slightly compressible allowing for the probe to partially press into the block at the first measurement location. Therefore, the first actual offset location was roughly 0.05 mm to the right of the true zero. In this situation, the penetration depth must be adjusted lower to 0.28 mm to account for this.
D. Description of Physical Experiment
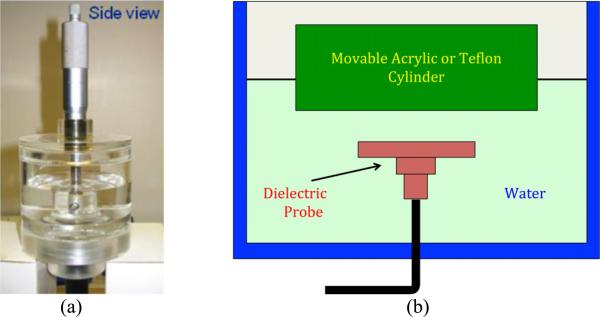
A two layer problem was used to test the penetration depth concept. Figure 3 shows the set up with an open-ended coaxial probe mounted inside a water filled tank with the probe facing upwards. The opposite end of the coaxial line was connected to a HP8753B network analyzer (Hewlett Packard, Santa Clara, CA) to record the return loss measurements. A movable acrylic piston was positioned above the probe and formed the second portion of the two-layered structure. Because the acrylic piston was relatively thick (10 mm), the second region was considered to have an infinite extent. The capacitance of the probe as a function of the first layer thickness was calculated from the reflection coefficient measured with the network analyzer. All measurements were performed at 300 MHz and the acrylic dielectric constant was 3.0. The tests were performed for the two Delfin Technologies probes. The liquids were allowed to equilibrate overnight to room temperature which was 23.0°C and our measurements indicate that the temperature variation was within ± 0.1°C over a two hour measurement period.
Fig. 3.
Measurement system used to test the two-layered problem showing the water tank, dielectric probe and dielectric cylinder: (a) photograph, and (b) schematic diagram.
III. Results
A. Simulations
1) Probe Electric Fields in Layered Dielectric Media
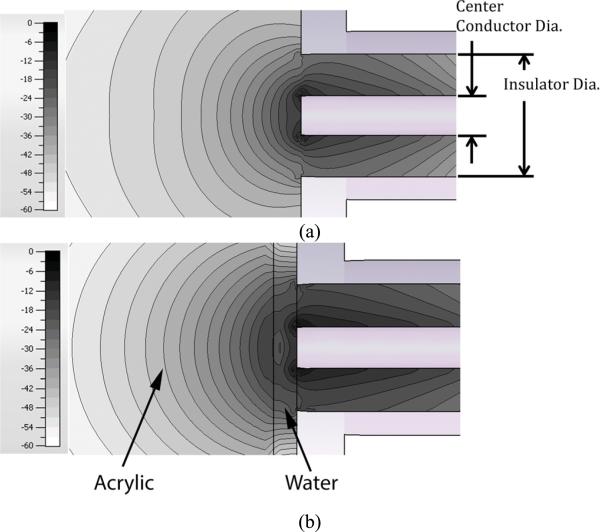
Figures 4a and b show close-up axial magnitude contour plots of the fields at 900 MHz within the coax and the area outside of the probe for the RG401 coaxial cable with the former medium being entirely water and the latter comprised of water for the closest layer and an acrylic layer starting 1mm from the probe surface.
Fig. 4.
2D contour plots of the axial plane electric field magnitudes from a coaxial probe: (a) probe in water, and (b) for the probe in water with an acrylic layer positioned 1 mm from the surface.
For the homogeneous case, the magnitude contour pattern basically declines monotonically extending away from the open-ended coax and the high strength fields appear tightly packed in around the probe tip with field strength ranging from roughly −12 dB to −25 dB across the probe face. At a distance of 1mm from the probe face, the field strengths range roughly between –18 dB and −35 dB. For the heterogeneous case, there appears to be an example of a standing wave between the acrylic and the coax and offset closer to the acrylic. The circular contours are disrupted and essentially start their more normal pattern to the left of the water:acrylic interface. In both cases there is a concentration of the fields around the edge of the center conductor at the probe edge. In addition, the magnitude profiles across the probe faces only differ slightly in values and shape illustrating the feature that field values at the probe interface are only marginally different for the situation when an object is within the penetration depth and when one is not.
2) 2 & 4 GHz, 50 Ω Coaxial Probe Studies
Figures 5a-d show the 2 and 4 GHz simulation plots of the perceived relative permittivity as a function of separation distance for the four different coaxial probe sizes. For the shorter distances of each plot there is a straight line extending from the value of 3 when the probe is touching the acrylic to roughly a value of 55-60 where it rolls off and asymptotically approaches the relative permittivity values of water which are 78.8 and 75.8 at 2 and 4 GHz, respectively. The penetration depths were calculated using the same technique described in Section II.D. Table III shows the penetration depths for the four probes at 2 and 4 GHz. In addition, Table III also presents the values when physiological saline (0.9%) is used instead of water. The relative permittivity values for 0.9% saline are 78.1 and 75.2 for 2.0 and 4.0 GHz, respectively. The penetration depths demonstrate a clear dependence with probe diameter with maximum differences of 7.1 and 6.8% between the water and saline cases at 2 and 4 GHz, respectively. In general the values are consistent as a function of frequency, but as the probe gets larger, especially for the RG-401 cable, the depths for the higher frequency do gradually increase compared to that for the 2 GHz case.
Fig. 5.
Plots of the 2 and 4 GHz perceived relative permittivity values from simulations for the two layered problem as a function of separation distance for the four coaxial cables: (a) UT-047-M17, (b) RG-405, (c) RG-402, and (d) RG-401.
TABLE III.
Penetration depths (mm) for the UT-047-M17, RG-405, RG-402, and RG-401 coaxial probes for 2 and 4GHz when tested in water and 0.9% saline.
| Probe | Water | Saline | ||
|---|---|---|---|---|
| 2 GHz | 4 GHz | 2 GHz | 4 GHz | |
| UT-047-M17 | 0.157 | 0.162 | 0.158 | 0.158 |
| RG-405 | 0.286 | 0.286 | 0.283 | 0.283 |
| RG-402 | 0.486 | 0.494 | 0.483 | 0.487 |
| RG-401 | 0.874 | 0.896 | 0.866 | 0.894 |
3) Summary of Probe Diameter, Frequency and Medium Permittivity Effect on Penetration Depth
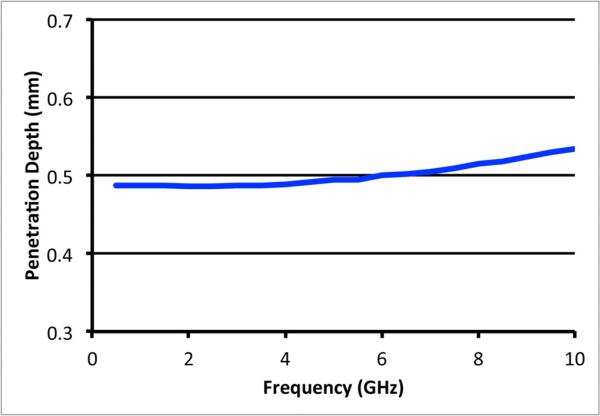
Simulations were performed using the RG-402 coaxial probe to compute the penetration depths as a function of frequency using water as the intervening liquid. Figure 6 shows the penetration depth plotted as a function of frequency over the 0.5 – 10.0 GHz span.
Fig. 6.
Plot of the penetration depth as a function of frequency from simulations for the RG-402 coaxial probe.
The values are virtually flat at 0.489 mm with only a slight suggestion of an increasing trend at the higher frequencies. The fit of the data to a second order polynomial yields:
| (2) |
where × is the frequency in GHz. The correlation coefficient for the fit was 0.999.
Simulations were also performed using the RG-402 coaxial probe to compute the penetration depths for the case where the intervening liquids covered a broad range of permittivities. In this case we performed the simulations with an intervening liquid having relative permittivities ranging from 10 to 80 in intervals of 10 with a constant conductivity of 1.0 S/m (Table IV).
TABLE IV.
List of permittivity and conductivity values at 2 GHz for different intervening liquids.
| Sample | Permittivity | Conductivity (S/m) |
|---|---|---|
| 1 | 10 | 1.0 |
| 2 | 20 | 1.0 |
| 3 | 30 | 1.0 |
| 4 | 40 | 1.0 |
| 5 | 50 | 1.0 |
| 6 | 60 | 1.0 |
| 7 | 70 | 1.0 |
| 8 | 80 | 1.0 |
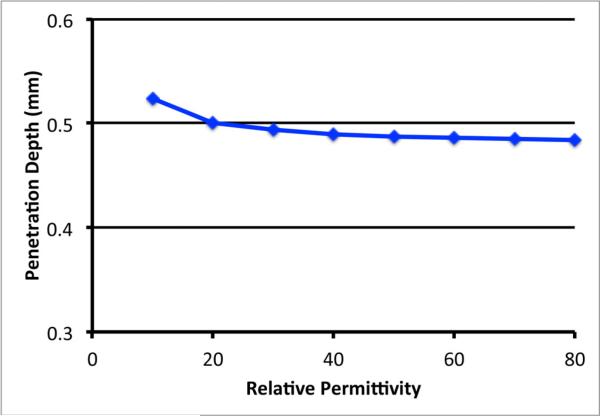
Figure 7 shows the progression in penetration depth with respect to liquid permittivity values at 2 GHz.
Fig. 7.
Plot of the penetration depth as a function of the relative permittivity of the intervening liquid for the RG-402 coaxial probe.
The depth is relatively flat as a function of permittivity while rising slightly at the lower values similar to an exponential curve. When fitted to an exponential equation, the result was:
| (3) |
where × is the liquid permittivity. The correlation coefficient for the fit was 0.95.
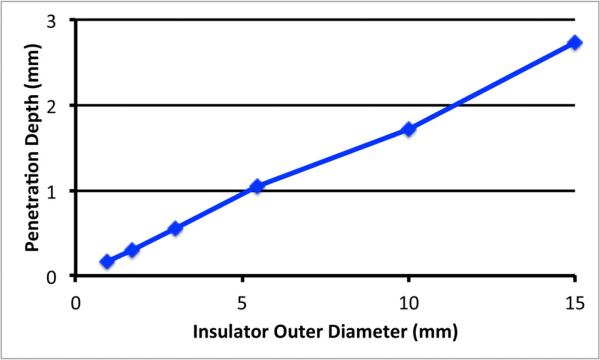
Finally, in examining the influence of probe diameter on penetration depth, the extremes are bounded by the smallest reasonable probe diameter on the low end and the point at which the coaxial line will no longer support a single TEM wave when the diameter becomes electrically large. This imposes a practical limit as to the number of actual probe diameters that can be tested at a given frequency. To explore the consistency of these measurements over a broad diameter range, the penetration depths for the simulated probe measurements at 2 GHz in water from Section III.B are plotted with the two depths for the Delfin probes in water at 300 MHz in Section III.C (Figure 8).
Fig. 8.
Penetration depths for a water sample as a function of probe diameter. Data for the RG designated probes at 2 GHz and Delfin probes at 300 MHz are plotted.
It is clear that there is a linear influence of penetration depth with probe diameter with a correlation coefficient of 0.998. In this case the relationship is:
| (4) |
where × is the probe insulator outer diameter (mm).
B. Measurements
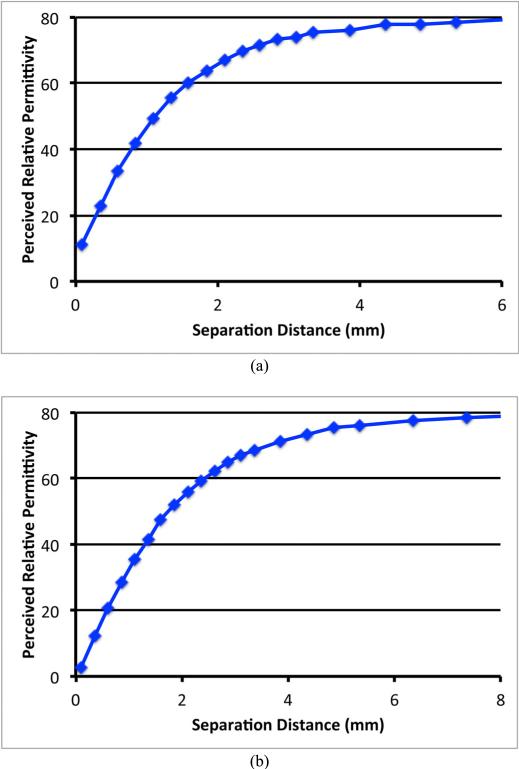
Figure 1a shows the two Delfin Technologies probes used in this experiment – S15 and M25. Each probe has been independently tested with a series of liquid dielectric property measurements to provide accurate property values [29]. Figures 9a and b show plots of the perceived permittivity curves at 300 MHz as a function of the water layer thickness. All cases demonstrate similar characteristic curves which are virtually straight for the smaller separation distances and gradually fall off and asymptotically approach the actual values of water properties at larger separation distances.
Fig. 9.
Plots of the 300 MHz perceived relative permittivity values for the two layered problem as a function of separation distance: (a) S15, and (b) M25.
Similarly to the example presented in the previous section, Table V shows the perceived penetration depths of each probe for both the measured and simulated cases. The penetration depths demonstrate a clear probe diameter dependence and show consistency between measurement and simulations.
TABLE V.
Measured and simulated penetration depths for two 50 Ω Delfin Technologies probes at 300 MHz.
| Model | Measured Depth of Penetration (mm) | Simulated Depth of Penetration (mm) |
|---|---|---|
| S15 | 1.84 | 1.77 |
| M25 | 2.74 | 2.45 |
It should be noted that for the purposes of the Delfin Technologies literature [48], a different definition was used for defining the penetration depth. For that case, they determined the separation distance at which the perceived permittivity values reached 75% of the actual water properties – in this case 60 at 300 MHz. The values for the S15 and M25 models were 1.59 and 2.43 mm, respectively, corresponding to only 14 and 11% lower values than those computed with this technique.
IV. Conclusions
Dielectric probes of different diameters can be used for a number of applications involving different penetration depths. We have developed a robust method of determining the effective penetration depth which allows for meaningful measurements in heterogeneous material mixtures. These results demonstrate that the penetration depth is clearly a function of probe diameter. While there is some influence to the property measurements from the second layer beyond the prescribed depth developed in this analysis, the influence is minimal. When requiring accurate measurements of homogeneous samples, the measurement sample thicknesses should be extended beyond the penetration depths described here. There is only a mild variation with respect to both frequency and intervening liquid permittivity. This analysis confirms the challenges involved with measuring solid materials because even small amounts of air at the probe interface can have disproportionally large influences on the measurements. It also indicates that for the process of deconvolving the dielectric properties at different depths, the most likely method will inevitably involve applying probes of different diameters.
We present data for a relatively low frequency and multiple higher frequencies which showed that the penetration depth for a single diameter probe did not vary appreciably over the extended range from 0.5 to 10 GHz. This data confirms that penetration depth varies with probe diameter but is essentially constant with frequency and intervening material permittivity. While there are an infinite number of possible heterogeneous property distributions, the multi-layer configuration is quite common and representative with respect to challenges encountered using the open-ended coaxial probes. Further investigation is certainly warranted to assess the effects of material heterogeneities extending out radially from the main axis of the coaxial probe.
Acknowledgment
This work was supported by the NIH/NCI Grant # RO1 CA191227-01.
Biography
Paul M. Meaney (M'92–SM'10) received the A.B. degree in computer science and electrical engineering from Brown University, Providence, RI, in 1982, the M.S. degree in electrical engineering from the University of Massachusetts, Boston, MA, in 1985, and the Ph.D. in biomedical engineering from Dartmouth College, Hanover, NH, in 1995.
From 1996 to 1997, he was a North Atlantic Treaty Organization/National Science Foundation Postdoctoral Fellow at the Royal Marsden Hospital, Sutton, U.K. He is currently a Research Professor at Dartmouth College, where since 1997, he has been a faculty member. His research interests include developing microwave imaging for biomedical applications, especially breast imaging and hyperthermia monitoring.
Andrew P. Gregory received the B.Sc. degree in physics from the University of Manchester in 1984. Since then he has worked in at the National Physical Laboratory on dielectric measurements on liquids and solids at RF and microwave frequencies using a wide range of techniques. These include transmission line, coaxial sensor, resonant cavity, and quasi-optic methods. He has also been involved in establishing facilities for the measurement of Specific Absorption Rate (SAR) at NPL. Current research interests include traceable measurement of the dielectric properties of liquids, dielectric measurements at temperatures up to 1000 °C, and measurement of the dielectric properties of surfaces on the micron scale with a resonant Near-Field Scanning Microwave Microscope.
Jan Seppälä was born in Kotka, Finland, in 1973. He studied medical physics in Kuopio University Hospital, Finland during the years 1994-1999. In 1999 he accepted a position as a junior medical physicist in South Karelia Central Hospital radiotherapy department in Lappeenranta and in 2000 he gained master's degree from the University of Kuopio as the subject for the research was the dosimetry of endovascular brachytherapy. In 2004 he got a degree of Licentiate of Philosophy with research based on IMRT and direct optimization. In 2005 he was appointed as a medical physicist in the Turku University Hospital Radiotherapy Department, Finland. He worked at Turku for five years and he was privileged to learn more about medical imaging especially PET imaging with close collaboration with Turku PET Centre. In 2010 he continued his research in IMRT and in 2012 he obtained his doctor's degree in medical physics from University of Turku. In 2010 he joined the Kuopio University Hospital Cancer Center as a medical physicist and in 2014 became the acting chief physicist of the department. His current research interests include intensity modulated radiotherapy techniques, molecular imaging, electrical machines, electronics and radiobiology.
Tapani Lahtinen was born in 1950. He received the M.Sc. degree in physics from the University of Jyväskylä, Finland, in 1973 and the Ph.D. degree in medical physics from University of Kuopio, Finland, in 1981. Since January 1976, he has been with Kuopio University Hospital, Finland until retirement in 2014. He is now currently working with Delfin Technologies Ltd, Kuopio, Finland. Prior to this, he has been a Researcher in medical physics in Switzerland in 1987 and a visiting professor in electrical engineering, Sophia University, Tokyo, Japan during 1990-1991. His current interests include biomedical applications of electromagnetic waves, development of new technology for human tissue water measurement, and combination of radiation and magnetic fields to enhance radiation response in cancer radiotherapy.
Contributor Information
Paul M. Meaney, Thayer School of Engineering at Dartmouth College, Hanover, NH 03755 USA (paul.meaney@dartmouth.edu)..
Andrew P. Gregory, Materials Division of the National Physical Laboratory in Teddington, Middlesex, UK TW11 0LW (andrew.gregory@npl.co.uk).
Jan Seppälä, Cancer Center at Kuopio University Hospital in Kuopio, Finland 70210 (jan.seppala@kuh.fi)..
Tapani Lahtinen, Delfin Technologies, Kuopio, Finland (tapani.lahtinen@delfintech.com)..
REFERENCES
- 1.Schwan HP. Electrical properties of tissue and cell suspensions. Adv. Biol. Med. Phys. 1957;5:147–209. doi: 10.1016/b978-1-4832-3111-2.50008-0. [DOI] [PubMed] [Google Scholar]
- 2.Cooke R, Kuntz ID. The properties of water in biological systems. Annu. Rev. Biophys. Bioeng. 1974;3:95–126. doi: 10.1146/annurev.bb.03.060174.000523. [DOI] [PubMed] [Google Scholar]
- 3.Schwan HP, Foster KR. Microwave dielectric properties of tissue: some comments on the rotational mobility of tissue water. Biophys. J. 1977 Feb;17(2):193–197. doi: 10.1016/S0006-3495(77)85637-3. [DOI] [PMC free article] [PubMed] [Google Scholar]
- 4.Joines WT, Zhang Y, Li C, Jirtle RL. The measured electrical properties of normal and malignant human tissue from 50 to 900 MHz. Med. Phys. 1994 Apr;41(4):547–550. doi: 10.1118/1.597312. [DOI] [PubMed] [Google Scholar]
- 5.Chaudhary SS, Mishra RK, Swarup A, Thomas JM. Dielectric properties of normal and malignant human breast tissues at radiowave and microwave frequencies. Indian. J. Biochem. Bio. 1984 Feb;21(1):76–79. [PubMed] [Google Scholar]
- 6.Surowiec A, Stuchly S, Barr J, Swarup A. Dielectric properties of breast carcinoma and the surrounding tissues. IEEE T. Biomed. Eng. 1988 1988 Apr;35(4):257–263. doi: 10.1109/10.1374. [DOI] [PubMed] [Google Scholar]
- 7.Petäjä L, Nuutinen J, Uusaro A, Lahtinen T, Ruokonen E. Dielectric constant of skin and subcutaneous fat to assess fluid changes after cardiac surgery. Physiol. Meas. 2003 Apr;24(2):383–90. doi: 10.1088/0967-3334/24/2/313. [DOI] [PubMed] [Google Scholar]
- 8.Mayrovitz HN, Davey S, Shapiro E. Local tissue water assessed by tissue dielectric constant: anatomical site and depth dependence in women prior to breast cancer treatment-related surgery. Clin. Physiol. Funct. I. 2008 Sep;28(5):337–342. doi: 10.1111/j.1475-097X.2008.00814.x. [DOI] [PubMed] [Google Scholar]
- 9.Johansson K, Lahtinen T, Björk-Eriksson T. Breast edema following breast conserving surgery and radiotherapy. Eur. J. Lymphology. 2014;24:1–5. [Google Scholar]
- 10.Lahtinen T, Seppälä J, Viren T, Johansson K. Experimental and analytical comparisons of tissue dielectric constant (TDC) and bioimpedance spectroscopy (BIS) in the assessment of early arm lymphedema in breast cancer patients after axillary surgery and radiotherapy. Lymphat. Res. Biol. 2015 Sep;10(2):176–185. doi: 10.1089/lrb.2015.0019. [DOI] [PubMed] [Google Scholar]
- 11.Poplack SP, Paulsen KD, Hartov A, Meaney PM, Pogue B, Tosteson T, Grove M, Soho S, Wells W. Electromagnetic breast imaging: pilot results in women with abnormal mammography. Radiology. 2007 May;243(2):350–359. doi: 10.1148/radiol.2432060286. [DOI] [PubMed] [Google Scholar]
- 12.Klemm M, Craddock I, Leendertz J, Preece A, Benjamin R. IEEE Ant. Prop. Intl. Symp. San Diego, CA: 2008. Experimental and clinical results of breast cancer detection using UWB microwave radar; pp. 1–4. [Google Scholar]
- 13.Schepps JL, Foster KR. The UHF and microwave dielectric properties of normal and tumour tissues: variation in dielectric properties with tissue water content. Phys. Med. Biol. 1980 Nov;25(6):1149–1159. doi: 10.1088/0031-9155/25/6/012. [DOI] [PubMed] [Google Scholar]
- 14.Meaney PM, Golnabi AH, Epstein N, Geimer SD, Fanning MW, Paulsen KD. Integration of a microwave tomographic imaging system with MR for improved breast imaging. Med. Phys. 2013 Oct;40(10):103101–1-103101-13. doi: 10.1118/1.4820361. [DOI] [PMC free article] [PubMed] [Google Scholar]
- 15.Foster KR, Schepps JL. Dielectric properties of tumor and normal tissues at radio through microwave frequencies. J. Microwave Power EE. 1981 Feb;16(2):107–119. doi: 10.1080/16070658.1981.11689230. [DOI] [PubMed] [Google Scholar]
- 16.Alanen E, Lahtinen T, Nuutinen J. Measurement of dielectric properties of subcutaneous fat with open-ended coaxial sensors. Phys. Med. Biol. 1998;43:475–485. doi: 10.1088/0031-9155/43/3/001. [DOI] [PubMed] [Google Scholar]
- 17.Mayrovitz HN, Davey S, Shapiro E. Skin tissue water assessed via tissue dielectric constant measurements in persons with and without diabetes mellitus. Diabetes Technol. Ther. 2013;15:60–65. doi: 10.1089/dia.2012.0197. [DOI] [PubMed] [Google Scholar]
- 18.Mayrovitz HN, Weingrad D, Lopez L. Patterns of temporal changes in tissue dielectric constant (TDC) as indices of localized skin water changes in women treated for breast cancer: a pilot study. Lymphat. Res. Biol. 2015;13:20–32. doi: 10.1089/lrb.2014.0024. [DOI] [PubMed] [Google Scholar]
- 19.Birkballe S, Jensen MR, Noerregaard S, Gottrup F, Karls-mark T. Can tissue dielectric constant measurement aid in differentiating lymphoedema from lipoedema in women with swollen legs? Brit. J. Dermatol. 2014 Jan;170(1):96–102. doi: 10.1111/bjd.12589. [DOI] [PubMed] [Google Scholar]
- 20.Guihan M, Bates-Jenson BM, Chun S, Parachuri R, Chin AS, McCreath H. Assessing the feasibility of subepidermal moisture to predict erythema and stage 1 pressure ulcers in persons with spinal cord injury: A pilot study. J. Spinal Cord Med. 2012 Jan;35(1):46–52. doi: 10.1179/204577211X13209212104141. [DOI] [PMC free article] [PubMed] [Google Scholar]
- 21.Schwan HP. The determination of biological impedances. Phys. Tech. Biol. Res. 1963;6:323–407. [Google Scholar]
- 22.Nelson SO. Fundamentals of dielectric properties measurements and agricultural applications. J. Microwave Power EE. 2010;44(2):98–113. doi: 10.1080/08327823.2010.11689778. [DOI] [PubMed] [Google Scholar]
- 23.Stuchly MA, Stuchly SS. Coaxial line reflection method for measuring dielectric properties of biological substances at radio and microwave frequencies – a review. IEEE Trans. Instrum. Meas. 1980 Sep;29(9):176–183. [Google Scholar]
- 24.Athey TW, Stuchly MA, Stuchly SS. Measurement of radio frequency permittivity of biological tissue with an open-ended coaxial line: Part 1. IEEE Trans. Microw. Theory Techn. 1982 Jan;30(1):82–86. [Google Scholar]
- 25.Gajda GB, Stuchly SS. Numerical analysis of open-ended coaxial lines. IEEE Trans. Microw. Theory Techn. 1983 May;31(5):380–384. [Google Scholar]
- 26.Gabriel C, Chan TYA, Grant EH. Admittance models for open ended coaxial probes and their place in dielectric spectroscopy. Phys. Med. Biol. 1994 Dec;39(12):2183–2200. doi: 10.1088/0031-9155/39/12/004. [DOI] [PubMed] [Google Scholar]
- 27.Chan TYA, Gabriel C, Grant EH. Modeling of the reflection coefficient of an open ended coaxial line and its use for accurate complex permittivity measurements at frequencies up to 20 GHz. IEEE Int. Conf. Dielectric Materials, Measurements and Applications. 19921992:366–369. [Google Scholar]
- 28.Anderson JM, Sibald CL, Stuchly S. Dielectric measurements using a rational function model. IEEE Trans. Microw. Theory Techn. 1994 Feb;42(2):199–204. [Google Scholar]
- 29.Alanen E, Lahtinen T, Nuutinen J. Variational formulation of open-ended coaxial line in contact with layered biological medium. IEEE T. Biomed. Eng. 1998 Oct;45(10):1241–1248. doi: 10.1109/10.720202. [DOI] [PubMed] [Google Scholar]
- 30.Grant JP, Clarke RN, Symm GT, Spyrou NM. A critical study of the open-ended coaxial line sensor technique for RF and microwave complex permittivity measurements. J. Phys. E. Sci. Instrum. 1989 Sep;1989(9):757–770. [Google Scholar]
- 31.Gabriel S, Lau RW, Gabriel C. The dielectric properties of biological tissues: II. Measurements in the frequency range 10 Hz to 20 GHz. Phys. Med. Biol. 1996 Nov;41(11):2251–2269. doi: 10.1088/0031-9155/41/11/002. [DOI] [PubMed] [Google Scholar]
- 32.Gabriel S, Law RW, Gabriel C. The dielectric properties of biological tissues: III. Parametric models for the dielectric spectrum of tissues. Phys. Med. Biol. 1996 Nov;41(11):2271–2293. doi: 10.1088/0031-9155/41/11/003. [DOI] [PubMed] [Google Scholar]
- 33.Gregory AP, Clarke RN, Hodgetts TE, Symm GT. RF and microwave dielectric measurements upon layered materials using coaxial sensors. National Physical Laboratory Report MAT13. 2008 [Google Scholar]
- 34.Hagl DM, Popovic D, Hagness SC, Booske JH, Okoniewski M. Sensing volume of open-ended coaxial probes for dielectric characterization of breast tissue at microwave frequencies. IEEE Trans. Microw. Theory Techn. 2003 Apr;51(4):1194–1206. [Google Scholar]
- 35.Lazebnik M, McCartney L, Popovic D, Watkins CB, Lindstrom MJ, Harter J, Sewall S, Magliocco A, Booske JH, Okoniewski M, Hagness SC. A large-scale study of the ultrawideband microwave dielectric properties of normal breast tissue obtained from reduction surgeries. Phys. Med. Biol. 2007;52(10):2637–2656. doi: 10.1088/0031-9155/52/10/001. [DOI] [PubMed] [Google Scholar]
- 36.Lazebnik M, Popovic D, McCartney L, Watkins CB, Lindstrom MJ, Harter J, Sewall S, Ogilvie T, Magliocco A, Breslin TM, Temple W, Mew D, Booske JH, Okoniewski M, Hagness SC. A large-scale study of the ultrawideband microwave dielectric properties of normal, benign and malignant breast tissues obtained from cancer surgeries. Phys. Med. Biol. 2007;52(20):6093–6115. doi: 10.1088/0031-9155/52/20/002. [DOI] [PubMed] [Google Scholar]
- 37.Burdette EC. Nussbaum GH, editor. Electromagnetic and acoustic properties of tissues. Physical Aspects of Hyperthermia. Med. Phys. Mg. 1982;(8):105–150. [Google Scholar]
- 38.Keysight 85070E Dielectric Probe Kit: Technical Overview. Keysight Technologies (Santa Clara, CA) 2014 Application Note 5989-0222EN. [Google Scholar]
- 39.Basics of measuring the dielectric properties of materials. Keysight Technologies (Santa Clara, CA) 2014 Application Note 5989-2589EN. [Google Scholar]
- 40.Meaney PM, Gregory A, Epstein N, Paulsen KD. Microwave open-ended coaxial dielectric probe: interpretation of the sensing volume re-visited. BMC Med. Phys. 2014 Jun;14(3) doi: 10.1186/1756-6649-14-3. paper # 1756-6649. [DOI] [PMC free article] [PubMed] [Google Scholar]
- 41.Meaney PM, Williams BB, Geimer SD, Flood AB, Swartz HM. A Coaxial Dielectric Probe Technique for Distinguishing Tooth Enamel from Dental Resin. Adv. Biomed. Eng. Res. 2015 Dec;3(1):8–17. doi: 10.14355/aber.2015.03.002. [DOI] [PMC free article] [PubMed] [Google Scholar]
- 42.Karni T, Pappo I, Sandbank J, Lavon O, Kent V, Spector R, Morgenstern S, Lelcuk S. A device for real-time, intraoperative margin assessment in breast conservation surgery. Am. J. Surg. 2007;194:467–473. doi: 10.1016/j.amjsurg.2007.06.013. [DOI] [PubMed] [Google Scholar]
- 43.Li LL, Ismail NH, Taylor LS, Davis CC. Coaxial microwave probes for measuring thin moisture layers. IEEE T. Biomed. Eng. 1992 Jan;39(1):49–57. doi: 10.1109/10.108127. [DOI] [PubMed] [Google Scholar]
- 44.Lim YY, Rotaru MD, Alphones A, Popov AP. Simple and improved dielectric parameter extraction of thin organic packaging materials using open-ended coaxial line technique. IEE Proc.-Microw. Antennas Propag. 2005 Aug;152(4):214–220. [Google Scholar]
- 45.Cenanovic A, Martius S, Kilian A, Schur J, Schmidt L. Non destructive complex permittivity determination of glass material with planar and convex surface. Proc. 6th Ger. Microw. Conf.; Darmstadt, Germany. 2011.pp. 1–4. [Google Scholar]
- 46.Stevens N, Martens L. Dimensioning of open-ended coaxial probes for the dielectric characterization of thin-layered materials. IEEE Instrum. Meas. Tech. Conf.; Budapest, Hungary. May 2001.pp. 1288–1290. [Google Scholar]
- 47.Chen G, Li K, Ji Z. Bilayered dielectric measurement with an open-ended coaxial probe. IEEE Trans. Microw. Theory Techn. 1994 Jun;42(6):966–971. [Google Scholar]
- 48.Kiiskinen M, Nuutinen J, Alanen E. Measurement depths of a skin-water analyzer (MoistureMeter-D) Skin Res. Technol. 2005;11:292. [Google Scholar]
- 49.Hodgetts TE. The calculation of the equivalent circuits of coaxial-line step discontinuities. NASA STI/Recon Technical Report N. 1981 [Google Scholar]
- 50.Gabriel C, Gabriel S, Courthout E. The dielectric properties of biological tissues: I. literature survey. Phys. Med. Biol. 1996 Nov;41(11):2231–2249. doi: 10.1088/0031-9155/41/11/001. [DOI] [PubMed] [Google Scholar]


