Abstract
Clinically, prostate adenocarcinoma is diagnosed by recognizing certain morphology on histology. While the Gleason grading system has been shown to be the strongest prognostic factor for men with prostrate adenocarcinoma, there is a significant intra and interobserver variability between pathologists in assigning this grading system.
In this study, we present a new method for prostate gland segmentation from which we then utilize to develop a computer aided Gleason grading. The novelty of our method is a region-based nuclei segmentation to get individual gland without using lumen as prior information. Because each gland region is surrounded by nuclei, individual gland can be segmented by using the structure features and Delaunay Triangulation. The precision, recal and F1 of this approach are 0.94±0.11, 0.60±0.23 and 0.70±0.19 respectively.
Our method achieves a high accuracy for prostate gland segmentation with less computation time.
I. INTRODUCTION
Prostate adenocarcinoma is a very common cancer in men over the age of 50. The initial diagnosis of prostate adenocarcinoma is usually made on biopsies performed after an abnormal digital rectal exam (DRE) and/or elevated Prostate Specific Antigen (PSA) level. On these biopsy materials, pathologists assign a score based on the Gleason grading system, which is derived by adding the most prevalent primary pattern and the second most prevalent pattern. Gleason scores assigned on biopsies typically range from 6 (primary pattern 3 + secondary pattern 3) to 10 (primary pattern 5 + secondary pattern 5). Pattern 3 consists of infiltrative well-formed glands, varying in size and shapes. Pattern 4 consists of poorly formed, fused or cribriform glands. Pattern 5 consists of solids sheets or single cells with no glandular formation. The Gleason grading system has been shown to be the strongest prognostic factor for men with prostate adenocarcinoma.
A recent study showed that all Gleason scores can be grouped and assigned to prognostic groups I to V. Patients with Gleason score of 7 are divided into two prognostic groups, group II for those with primary pattern 3 + secondary pattern 4, and group III for those with primary pattern 4 + secondary pattern 3[1]. Previous studies have shown that even though both patterns comprise Gleason score of 7, biological behavior of pattern 4 + 3 is worse than that of pattern 3 + 4[2].
Since there is a significant difference between pattern 4 + 3 and pattern 3 + 4, it is very important to be able to separate pattern 3 and pattern 4 accurately. Unfortunately, since it is difficult at times to objectively assign these patterns, a substantial interobserver variability exists, especially among general pathologists who do not specialize in urologic pathology[3, 4]. In this study, we present a computer aided analysis method for prostate gland segmentation using pattern 3 and 4 Hematoxylin and Eosin (H&E) stained pathology images.
There have been many studies on computer aided Gleason grading, however some of them focus on the architecture of the images instead of analyzing intact gland region. In general, there are four approaches on prostate cancer grading: texture-based, nuclei-based, gland-based and nuclei-gland-based. For the studies of texture-based approaches, they utilize low level information instead of glandular structure and need to calculate all the pixel information in the images[5]–[8]. The nuclei-based method computes nuclei features, but there is no gland features involved and nuclei on stroma lead to wrong segmentation[9, 10]. Gland-based approach highly takes advantage of the existence of lumen, thus for the regions without lumen, or multiple lumen appearance, the methods easily fail[11]–[17]. Recently, a nuclei-gland-based method has been proposed, but it is computationally expensive and easily leads to overlapped gland region[18].
II. MATERIAL AND METHODS
In this study, all the prostate images were from Pathology Department at Johns Hopkins Medical Institutes. The images were stained by Hematoxylin and Eosin (H&E). In total, 18 images from 18 patients were used for this study. The images were acquired under 10× objective, with 1024×1360 pixels. Though only 18 images were used for the preliminary study, those images come from 18 patients and most important aspect was the staining characteristics of those images were very different from each other.
The method we present in this article is a region-based nuclei and gland grouping approach. The approach is proposed for discriminating the Gleason score 3 and 4 images from different graphic structures. Each individual gland is segmented by its surrounding nuclei grouped without using lumen as prior information. Our method includes three main steps. First, image pre-processing is implemented for removal of staining variations from different images. Second, all the nuclei and global gland regions are identified respectively. Third, each individual gland is constructed from the distance map of gland region with grouping its adjacent surrounding nuclei. Finally a shape descriptor is quantified for each segmented gland.
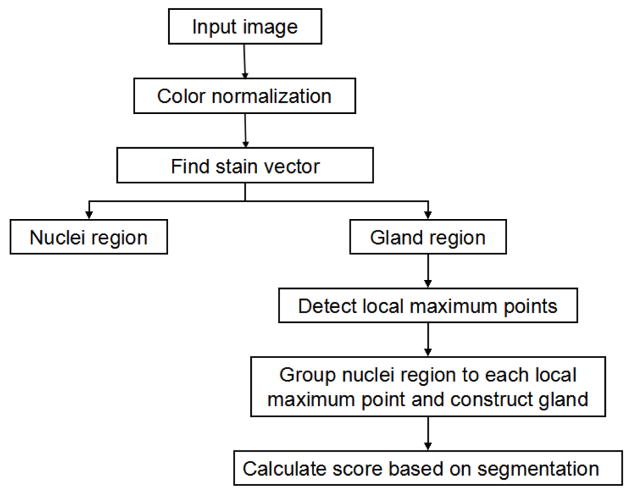
The several steps of our approach are summarized in Fig. 1. Using a well-defined H&E stained image as a reference image, all the images are normalized for removal staining variations. From their staining vectors, nuclei and glands regions are identified by color deconvolution. Based on an assumption that only one whole lumen locates in one single gland no matter grade 3 individual gland structure or grade 4 gland infusion, local maximum points in distance map of gland region are applied to identify the number of glands in each gland region. Because many glands do not have lumen and lumen usually located in the center of glands, surrounding adjacent nuclei on each gland region are classified to different local maximum points by Delaunary triangulation grouping approach.
Fig. 1.
Flow chart of our method
A. Color Normalization for removal stain variations
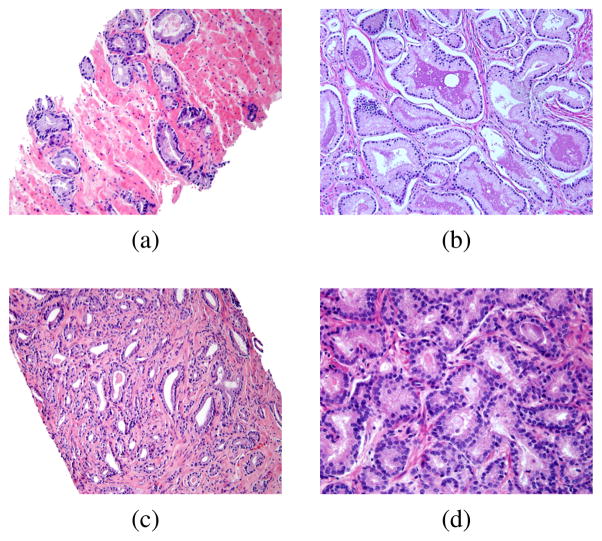
Because of stain variations within those H&E stained images, color normalization is applied to have image quality control as its pre-processing step. The one with clear gland boundaries and all the glands can be detected easily by human eyes is chosen as a reference image. Fig. 2 shows four examples of H&E stained prostate pathology slides. Although the images come from the same institute, they have different staining appearances for nuclei, cytoplasm, stroma and lumern.
Fig. 2.
Examples of four H&E stained images, but with quite different staining appearance for nuclei, cytoplasm, stroma and lumen. (a) and (b) shows a trend of gland infusion, many glands have touched other glands, while glands in (c) and (d) have merged together and it’s more difficult than (a) and (b) to separate each gland.
We use color map normalization method, which is described in[19]. The reason to choose this normalization approach is that it uses unique color in the image instead of color frequency of all the pixels. So we use a well-defined H&E stained image as a reference image, and all the images are normalized by the color map of the reference image for removal staining variations.
B. Identification nuclei region and gland region
After color normalization, color deconvolution[20] is applied to extract nuclear region mask and glandular region mask. Because stain vectors are automatically acquired from color deconvolution, shown as two examples in Fig. 3 (a). Given a different threshold to the stain vector image, we can get nuclear region mask and glandular region mask. For the glandular region mask, a small area threshold is used to remove noise, as shown in Fig. 3 (b). And the nuclear region mask is shown in Fig. 3 (c).
Fig. 3.
(a) Stain vector contains gland and nuclei information; (b) Glandular region mask; (c) Nuclear region mask
C. Gland construction
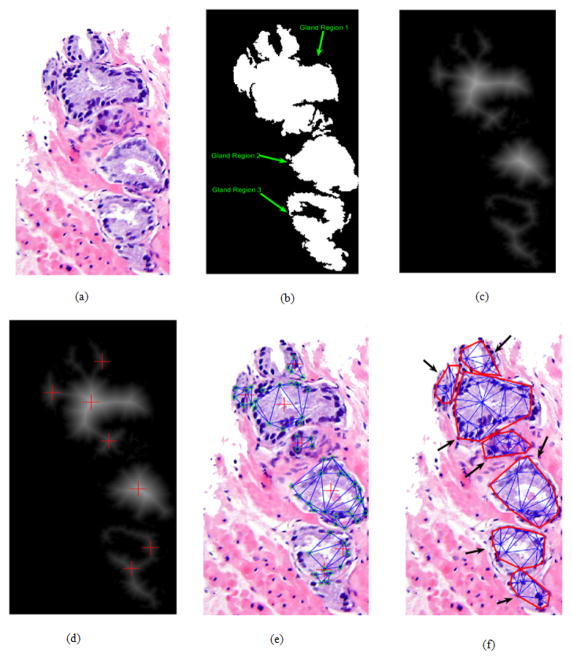
Since we get the mask of nuclear region and glandular region, we can group each nuclei region to each gland, and therefore construct each gland from gland regions. Assume we have a gland region G, and use this gland region to multiply nuclei region to get nuclei regions on the gland. Suppose there are Nk(k=1...m) nuclei regions, where Nk denotes the kth nuclei region on the gland and m denotes total number of nuclei regions on the gland. Fig. 4 (a) is original image and Fig. 4 (b) is the glandular region mask of original image and there are three gland regions in the image.
Fig. 4.
(a) Original Image; (b) Gland region mask, in which there are three gland regions in the images and are labeled by green arrows; (c) Distance transform of glandular region mask; (d) Local maximum points of distance transform image; (e) Grouping the nuclei that connect with local maximum points directly; (f) Contours of final (in red) image of gland segmentation, each black arrow indicates one gland.
Transform the gland region to a distance image, then localize its local maximal points on it. The distance map is shown in Fig. 4 (c), and local maximum points are shown in Fig. 4 (d). Based on the assumption that only one whole lumen locates in one single gland no matter grade 3 individual gland structure or grade 4 gland infusion, the local maximum points in distance map of gland region are applied to identify the number of glands in each gland region. So we have several glands Gi, (i=1...n), here n denotes number of local maximum points in each gland region and Gi denotes the ith gland region. Fig. 4 (d) shows the local maximum points on the distance transform map.
-
For the gland region with just one local maximum point, we consider it as a single gland and use nuclei regions’ centroids and the local maximum point to construct Delaunay triangulation and therefore find border of the gland; while for others, following steps are applied to each gland region as follows.
While there is nuclei region Nk unlabeled, If the nuclei region Nk only directly connected with Gi Nk is classified as Gi’s nuclei Else if nuclei Nk directly connected with multiple local maximum points, such as Gp ... Gq (1 ≤ p < q ≤ n) Nk is classified to the gland having the largest nuclei density Else if the nuclei densities of Gp ... Gq are same Choose the gland with closest distance end end Since each gland Gi has its nuclei regions, we can construct part of the complete gland by using local maximum point and nuclei regions, as shown in Fig. 4 (e).
For those non-directly connected nuclei regions, searching their adjacent classified glands, they are assigned to the gland with smallest distance.
The glands have less than three nuclei region will be discarded because it’s not enough to construct a triangulation. After all the nuclei regions are grouped, we reconstruct each gland using Delaunay triangulation, the result is shown in Fig. 4 (f), and each black arrow denotes a segmented gland.
D. Gland score
To quantify the shape variations, a gland score is defined as the ratio of gland area to a circle area with the same perimeter as a gland area. For each gland, assume its area is Garea and perimeter length is Glength, so a circle with the same length as the gland has a area of Glength2/(4π), therefore the score equals to
| (1) |
where Gscore is a gland score. For the grade 4 glands, Gscore should be less than Gscore of grade 3 glands due to the arbitrary shape variation progression in grade 4 glands.
III. EXPERIMENT RESULTS
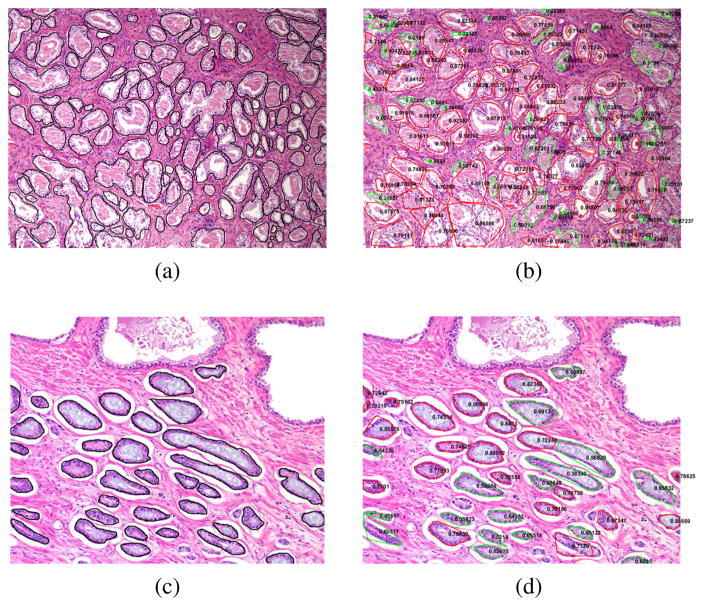
Here segmentation results of two representative examples are show in Fig. 5 (b) and (d). And the manual annotation of the glands within the two examples of the data set are shown in Fig. 5 (a) and (c). Each segmented gland is circled in red or green line with its corresponding gland score on it. If gland score is less than 0.7, it is contoured by green line, otherwise contoured by red line. We empirically use Gscore = 0.7 as a threshold for the glands with Gscore more than 0.7 have more regular shapes than the glands with Gscore less than 0.7. Also, the gland score statistics of the whole data set are shown in TABLE I. From the Fig. 5, we can notice the glands without lumen can be segmented. Each gland is quantified by its gland score representing its shape variation.
Fig. 5.
Each individual gland segmentation result of two representative example images. The manual annotation of each gland is shown in (a) and (c). Each segmented gland by using our approach is contoured in red or green line with its corresponding gland score on it as shown in (b) and (d).
TABLE I.
Gland score statistics of the whole data set
| All glands | Gscore ≥ 0.7 | Gscore<0.7 | |
|---|---|---|---|
| Percentage | 100% | 58% | 42% |
| Mean | 0.69 | 0.81 | 0.52 |
| Standard Deviation | 0.18 | 0.06 | 0.15 |
| 5th Percentiles | 0.32 | 0.71 | 0.22 |
| 95th Percentiles | 0.91 | 0.92 | 0.69 |
We use precision (P), recall (R) and F1 score to measure this approach quantitatively. The intersection between the segmentation results and the manually annotation results divided by the segmentation results and the manually annotation results is defined as P and R, respectively. And F1 = 2 × P × R=(P + R). The mean and standard deviation of P, R and F1 for our approach are 0.94±0.11, 0.60±0.23 and 0.70±0.19, which shows gland segmentation and ground truth annotations have a relative good agreement between them. Due to manually annotation tends to have a larger outer gland contour, that leads a relative low value of R.
For the glands which have only one local maximum point, the time complexity is O(X1), where X1 is the number of glands with only one local maximum point; while for other glands, the time complexity is O(NM), where N is the number of nuclei regions on the glands and M is the number of local maximum points. For an image (1024±1360), using a computer with the Intel Xeon processor and 16.0 GB RAM, the approach is implemented in MATLAB and the average running time is less than one minute. The experimental procedures involving human subjects described in this paper were approved by the Institutional Review Board. The Institution’s Ethical Review Board approved all experimental procedures involving human subjects.
IV. CONCLUSIONS
In this article, we present a new method to handle H&E stained prostate gland segmentation with stain variation and glandular structural difference. Basing on the assumption that the number of glands equal to the number of local maximal points within the glandular region, Dealaunay Triangulation is applied to connect adjacent surrounding nuclei regions to its corresponding gland. Then the individual glands are constructed from the nuclear and glandular regions. Finally a quantitative gland shape score is calculated to represent the gland shape variation progression from grade 3 gland to grade 4 gland. In future, a merging gland algorithm will be proposed to handle multiple local maximum to ensure it be only one gland instead of false multiple ones. And we would like to compare our method with others on large data set with clearly labels of Gleason score 3 and 4 for better validation.
Footnotes
This research was funded, in part, by grants from NIH contract 5R01CA156386-10 and NCI contract 5R01CA161375-03, NLM contracts 5R01LM009239-06 and 5R01LM011119-04.
Contributor Information
Jian Ren, Email: jian.ren0905@rutgers.edu.
Evita T. Sadimin, Email: esadimin@jhmi.edu.
Daihou Wang, Email: daihou.wang@rutgers.edu.
Jonathan I. Epstein, Email: jepstein@jhmi.edu.
David J. Foran, Email: foran@cinj.rutgers.edu.
Xin Qi, Email: qixi@cinj.rutgers.edu.
References
- 1.Pierorazio P, Walsh P, Partin A, Epstein J. Prognostic Gleason grade grouping: data based on the modified Gleason scoring system. BJU international. 2013;111(5):753760. doi: 10.1111/j.1464-410X.2012.11611.x. [DOI] [PMC free article] [PubMed] [Google Scholar]
- 2.Makarov D, Sanderson H, Partin A, Epstein J. Gleason Score 7 Prostate Cancer on Needle Biopsy: Is the Prognostic Difference in Gleason Scores 4 3 and 3 4 Independent of the Number of Involved Cores? The Journal of urology. 2002;167(6):24402442. [PubMed] [Google Scholar]
- 3.Allsbrook W, Mangold K, Johnson M, et al. Interobserver reproducibility of Gleason grading of prostatic carcinoma: urologic pathologists. Human pathology. 2001;32(1):7480. doi: 10.1053/hupa.2001.21134. [DOI] [PubMed] [Google Scholar]
- 4.Allsbrook W, Mangold K, Johnson M, et al. Interobserver reproducibility of Gleason grading of prostatic carcinoma: urologic pathologists. Human pathology. 2001;32(1):8188. doi: 10.1053/hupa.2001.21134. [DOI] [PubMed] [Google Scholar]
- 5.Jafari-Khouzani K, Zadeh H. Multiwavelet grading of pathological images of prostate. Biomedical Engineering IEEE Transactions on. 2003;50(6):697704. doi: 10.1109/TBME.2003.812194. [DOI] [PubMed] [Google Scholar]
- 6.Yoon H, Li C, Christudas C, et al. Cardinal multiridgelet-based prostate cancer histological image classification for Gleason grading, Bioinformatics and Biomedicine (BIBM). 2011 IEEE International Conference on; 2011. p. 315320. [Google Scholar]
- 7.Khurd P, Bahlmann C, Maday P, et al. Computer-aided gleason grading of prostate cancer histopathological images using texton forests. Biomedical Imaging: From Nano to Macro, 2010 IEEE International Symposium on; 2010. p. 636639. [DOI] [PMC free article] [PubMed] [Google Scholar]
- 8.Tai S, Li C, Wu Y, et al. Classification of prostatic biopsy, Digital Content, Multimedia Technology and its Applications (IDC). 2010 6th International Conference on; 2010. p. 354358. [Google Scholar]
- 9.Khurd P, Grady L, Kamen A, et al. Network cycle features: Application to computer-aided gleason grading of prostate cancer histopathological images. Biomedical Imaging: From Nano to Macro, 2011 IEEE International Symposium on; 2011. p. 16321636. [DOI] [PMC free article] [PubMed] [Google Scholar]
- 10.Doyle S, Feldman M, Shihe N, Tomaszewski J, Madabhushi A. Cascaded discrimination of normal, abnormal, and confounder classes in histopathology: Gleason grading of prostate cancer. BMC bioinformatics. 2012;13(1):282. doi: 10.1186/1471-2105-13-282. [DOI] [PMC free article] [PubMed] [Google Scholar]
- 11.Naik S, Doyle S, Agner S, Madabhushi A, et al. Automated gland and nuclei segmentation for grading of prostate and breast cancer histopathology, Biomedical Imaging: From Nano to Macro, 2008. ISBI 2008. 5th IEEE International Symposium on; 2008. p. 284287. [Google Scholar]
- 12.Li C, Xu C, Gui C, Fox M. Level set evolution without reinitialization: a new variational formulation, Computer Vision and Pattern Recognition. IEEE Computer Society Conference on; 2005. p. 430436. [Google Scholar]
- 13.Peng Y, Jiang Y, Eisengart L, et al. Segmentation of prostatic glands in histology images. Biomedical Imaging: From Nano to Macro, 2011 IEEE International Symposium on; 2011. p. 20912094. [Google Scholar]
- 14.Vidal J, Bueno G, Galeotti J, et al. A fully automated approach to prostate biopsy segmentation based on level-set and mean filtering. Journal of pathology informatics. 2011;2 doi: 10.4103/2153-3539.92032. [DOI] [PMC free article] [PubMed] [Google Scholar]
- 15.Xu J, Sparks R, Janowczyk A, et al. High-throughput prostate cancer gland detection, segmentation, and classification from digitized needle core biopsies. Prostate Cancer Imaging. Computer-Aided Diagnosis, Prognosis, and Intervention. 2010:7788. [Google Scholar]
- 16.Monaco J, Tomaszewski J, Feldman M, et al. High-throughput detection of prostate cancer in histological sections using probabilistic pairwise Markov models. Medical image analysis. 2010;14(4):617629. doi: 10.1016/j.media.2010.04.007. [DOI] [PMC free article] [PubMed] [Google Scholar]
- 17.Nguyen K, Sarkar A, Jain A. Structure and context in prostatic gland segmentation and classification Medical image analysis. Medical Image Computing and Computer-Assisted Intervention–MICCAI 2012. 2012;14(4):115123. doi: 10.1007/978-3-642-33415-3_15. [DOI] [PubMed] [Google Scholar]
- 18.Nguyen K, Sarkar A, Jain A. Prostate Cancer Grading: Use of Graph Cut and Spatial Arrangement of Nuclei. 2014 doi: 10.1109/TMI.2014.2336883. [DOI] [PubMed] [Google Scholar]
- 19.Kothari S, Phan J, Moffitt R, et al. Automatic batch-invariant color segmentation of histological cancer images. Biomedical Imaging: From Nano to Macro, 2011 IEEE International Symposium on; 2011. p. 657660. [DOI] [PMC free article] [PubMed] [Google Scholar]
- 20.Macenko M, Niethammer M, Marron J, et al. A Method for Normalizing Histology Slides for Quantitative Analysis. ISBI. 2009;9:11071110. [Google Scholar]


