Abstract
Background
Retinoblastoma (RB) is the most common malignant tumor of the eye in childhood. The objective of this paper was to investigate carboplatin (CAR)- and melphalan (MEL)-induced dynamic module changes in RB based on multiple (M) differential networks, and to generate systems-level insights into RB progression.
Material/Methods
To achieve this goal, we constructed M-differential co-expression networks (DCNs), assigned a weight to each edge, and identified seed genes in M DCNs by ranking genes based on their topological features. Starting with seed genes, a module search was performed to explore candidate modules in CAR and MEL condition. M-DMs were detected according to significance evaluations of M-modules, which originated from refinement of candidate modules. Further, we revealed dynamic changes in M-DM activity and connectivity on the basis of significance of Module Connectivity Dynamic Score (MCDS).
Results
In the present study, M=2, a total of 21 seed genes were obtained. By assessing module search, refinement, and evaluation, we gained 18 2-DMs. Moreover, 3 significant 2-DMs (Module 1, Module 2, and Module 3) with dynamic changes across CAR and MEL condition were determined, and we denoted them as dynamic modules. Module 1 had 27 nodes of which 6 were seed genes and 56 edges. Module 2 was composed of 28 nodes and 54 edges. A total of 28 nodes interacted with 45 edges presented in Module 3.
Conclusions
We have identified 3 dynamic modules with changes induced by CAR and MEL in RB, which might give insights in revealing molecular mechanism for RB therapy.
MeSH Keywords: Gene Regulatory Networks, Protein Interaction Maps, Retinoblastoma
Background
Retinoblastoma (RB) originates from progenitors of retinal sensory cells and is the most common malignant tumor of the eye in childhood, accounting for about 2–3% of all pediatric malignancies [1]. Its incidence is approximately 1 in 15 000–20 000 live births each year, and 60% of cases are unilateral [2]. Therefore, effective diagnosis and treatment methods of RB are urgently needed, which mainly comprise enucleation, external beam radiotherapy, thermotherapy, laser photocoagulation, and systemic chemo-reduction [3]. Enucleation is curative in more than 90% of cases but results in adverse physiological and psychological effects [4]. Chemotherapy has become the forefront of treatment in the past decade, in the search for globe-preserving measures and to avoid the adverse effects [5,6]. However, even these sometimes fail to prevent tumor recurrence owing to several factors, such as larger tumor size, vitreous seedings, age of onset, and family history of RB [7]. Therefore, insights into molecular mechanisms of antitumor agents, such as carboplatin (CAR) and melphalan (MEL), and their relationship with the drug-resistant states, would provide effective options for chemotherapy prevention [8,9].
CAR, cis-diammine(1,1-cyclobutanedicarboxylato)platinum(II), belongs to the group of platinum-based antineoplastic agents and is a chemotherapy drug used against cancers, for example, ovarian carcinoma, lung cancers, and RB [10,11]. CAR uptake triggers activation of DNA repair pathways and, in case damage is beyond repair, cell cycle arrest and apoptosis [12]. The greatest benefit of CAR is its reduced adverse effects, particularly the elimination of nephrotoxic effects [13]. Another common drug agent is MEL, which chemically alters through alkylation of the DNA nucleotide guanine and causes linkages between strands of DNA [14]. This chemical alteration inhibits DNA synthesis and RNA synthesis, which are functions necessary for cells to survive [15].
The response of RB patients to CAR and MEL is variable, necessitating identification of biomarkers that can reliably predict drug sensitivity and resistance. In this study we sought to identify dynamically controlled genes and modules associated with drug response in RB.
Material and Methods
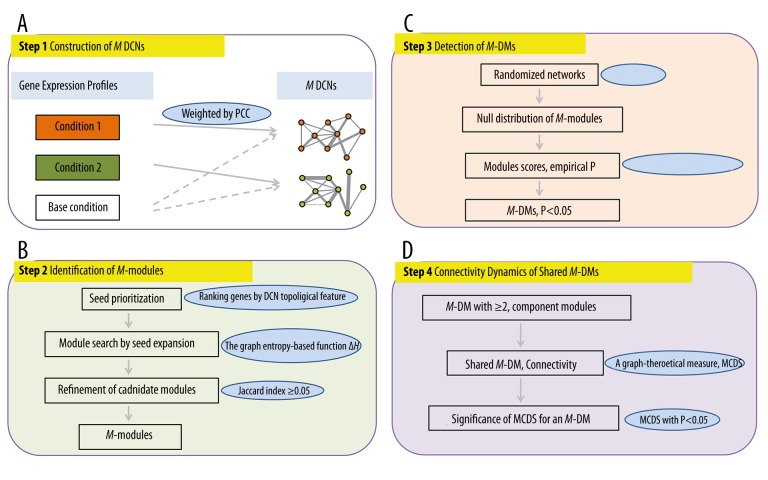
Based on gene expression profile, inference of dynamic modules included 4 steps (Figure 1). The first step was construction of multiple (M) differential co-expression networks (DCNs), 1 for each condition (Figure 1A). Two genes were connected in a DCN if they exhibited correlated expression profiles across conditions and their expression levels were significantly different between the RB and the baseline conditions (normal control). The second step was identification of M-modules present in M DCNs adapting the M-module algorithm comprised of seed prioritization, module search by seed expansion, refinement of candidate modules, and calculation of significance of candidate modules (Figure 1B). Using randomized networks and multiple testing, the statistical significance of M-modules was evaluated, and M-modules with P<0.05 were defined as M-differential modules (DMs) (Figure 1C). Finally, by analyzing M-DMs that were present in multiple conditions, we revealed dynamic changes in M-DM activity and connectivity on the basis of significance of Module Connectivity Dynamic Score (MCDS) (Figure 1D), and obtained dynamic modules across RB conditions.
Figure 1.
The scheme flow for inference of dynamic modules in UM. (A) Construction of M DCNs; (B) Identification of M-modules; (C) Detection of M-DMs; (D) Connectivity dynamics of shared M-DMs.
Recruitment of gene expression data
In the current study, 2 gene expression profiles of RB, with accessing number E-GEOD-34379 and E-GEOD-34381, were recruited from the online ArrayExpress database, presented on the A-AFFY-141-Affymetrix GeneChip Human Gene 1.0 ST Array [HuGene-1_0-st-v1] Platform. In detail, E-GEOD-34379 consisted of 5 samples (4 normal controls and 1 retinoblastoma samples treated with carboplatin), while E-GEOD-34381 included 4 normal samples and 2 retinoblastoma samples treated with melphalan. In total, there were 8 normal samples (base condition), 1 carboplatin-treated sample (CAR condition), and 2 melphalan samples (MEL condition). Therefore, we should note that M=2 (CAR and MEL) compared to base condition in the present work, and there were 2 DCNs and 2-DMs. By converting data of the microarray profile on probe-level into gene symbols, we obtained a total of 12 329 genes for further exploitation.
Construction of DCN
In this paper, we utilized the global human protein-protein interaction network (PPIN) from the Search Tool for the Retrieval of Interacting Genes/proteins (STRING) (16), which included 787 896 interactions among 16 730 genes, as the global PPIN (GPPIN). Taking intersections between genes in the GPPIN and gene expression profiles, we obtained the background co-expression networks (BCNs) with 10 954 genes and 355 016 interactions.
Subsequently, these interactions in BCNs were evaluated by Pearson correlation coefficient (PCC), which evaluated the probability of 2 co-expressed gene pairs (17). The absolute value of PCC for an interaction was denoted as δ, we only selected interactions which met to the threshold of δ ≥0.99 and the corresponding genes to construct the DCN. The PCC of a pair of genes (x and y) was calculated as:
Where s was the number of samples of the gene expression data; g(x, i) or g(y, i) was the expression level of gene x or y in the sample i under a specific condition; ḡ(x) or ḡ(y) represented the mean expression level of gene x or y and g(x) or g(y) represented the standard deviation of expression level of gene x (or y).
At last, weights were assigned to edges in the DCNs, before which the q value of differential gene expression between the CAR, MEL, and baseline condition was calculated by one-sided t-test (18). The weight Wx,y on edge (x, y) in the M DCNs was defined as follows:
Where qx and qy represented q values for genes x and y, respectively; V was the node set of the co-expression network, and PCC (x, y) was the absolute value of PCC between genes x and y based on their expression profiles.
In M DCNs, the node sets (V) were the same, but the edge sets (Ek) were different, thus they were expressed as Gk=(V, Ek) (1≤k≤M). When adding the weight (Wx,y) on the edge e(x, y) to Gk, a 3-dimensional matrix A=(αxyk)nxnxM was produced. An M-DM (C) was defined as a set of genes whose connectivity within them was stronger than random expectation across all M DCNs under consideration.
Identification of M-modules
We implemented the M-module algorithm to identify M-modules with high connectivity in DCNs [19]. This approach contained 3 parts: seed prioritization, module search by seed expansion, and refinement of candidate modules.
Seed prioritization
For the purpose of detecting seed genes across M DCNs, we ranked genes based on their topological features in individual DCN. Each Gk=(V, Ek) (1≤k≤M) had its own adjacency matrix Ak=(αxyk)nxn, and the importance of gene x in the corresponding network was assessed by a function, g(x) [20].
And
Of which Nk(x) was the set of neighbors of x in Gk; A′xyk represented the degree normalized weighted adjacency matrix; and D denoted a diagonal matrix with element Dxy=∑yAxyk. The equation indicated that the importance of a node depended on the number of its neighbors, strength of connection, and importance of its neighbors. Here, for each gene, after obtaining its ranks in all individual networks, denoted as {g=g(1), g(2), …, g(M)}, a z-score for each rank was computed [21]. Then we gained the rank for that gene across all DCNs by averaging the z-scores among all DCNs. The top 1% of genes were selected as seed genes.
Module search by seed expansion
In this step, a graph entropy-based objective function (ΔH) was proposed to estimate the scale of module search, which started with a seed gene [22]. The searching process was not terminated until there was no decrease after adding genes iteratively led to the maximum decrease in the ΔH iteratively. Taking any seed gene (v) as an M-module C={v}, for each vertex u in its neighborhood in all networks, N(v)=UiNi(v) (u∈N(v)) was defined, in which was the neighbor set in Gi as the candidate for C. The new candidate module C′=CU{u} and the entropy decrease between C and C′ was defined as following:
And the graph entropy for C across all networks and normalized for the size of C was
Where Hk(C)=∑i∈cH(Cj) was the sum of all vertices in C and network k, Ci (1≤i≤τ) was as the group of modules being sought where τ was the number of modules. H(C′) was calculated similarly. ΔH(C′, C)>0 indicated that addition of vertex u improved the connectivity of the former candidate M-modules. The vertex u whose addition maximized ΔH was added to C. The expansion step terminates until no additional vertex can reduce the entropy of the evolving M-modules further.
Refinement of candidate M-modules
Candidate M-modules with sizes <5 were removed due to bad connectivity, whereas there were overlaps among many candidate modules. To merge overlapping candidate M-modules into M-modules, we applied Jaccard index [23], which is the ratio of intersection over union for 2 sets. A Jaccard index of 0.5 was used in this study.
Detection of M-DMs
To detect M-DMs, we evaluated the statistical significance of M-modules utilizing randomized networks and their null score distributions. For each randomized network, the edges were captured from 355016 co-expression interactions, and the amount of edges was the same as that in DCN. Each network was completely randomized 100 times by degree-preserved edge shuffling. Subsequently, module search was performed for the randomized networks in order to construct the null distribution for module scores. On the basis of the null distribution, we defined the empirical P value of an M-module as the probability of the module having the observed score or smaller by chance. P values were corrected for multiple testing utilizing the method of Benjamini-Hochberg [24], and M-modules with P<0.05 were defined as M-DMs.
Quantification of connectivity dynamics of shared M-DMs
By definition, each M-DM had multiple component modules from different DCNs. Because component modules of an M-DM shared the same set of genes in multiple DCNs but could differ in their connectivity, M-DM provided a natural way to capture dynamic changes in connectivity. Hence, to quantify the change in the connectivity of component modules, the MCDS [25] of an M-DM C was employed, which was defined as the average of connectivity changes across all adjacent conditions:
Where Aci(1≤i≤M) stood for weighted adjacent matrices of the corresponding induced sub-graphs; represented the MCDS between 2 adjacent M-DMs, which equaled to ||ACi − ACi+1||2/|C|. The statistical significance of MCDS for an M-DM was computed in a similar way as that for M-DMs. MCDS with P<0.05 were considered to be significant.
Results
In the present study, apart from base conditions, there were 2 conditions, CAR and MEL, M=2, hence we could obtain 2 DCNs, identify 2-DMs, and utilize their significance and MCDS to investigate significant genes further. The significant genes across 2 conditions may give insight to reveal molecular mechanism of CAR and MEL treated RB.
Construction of DCNs
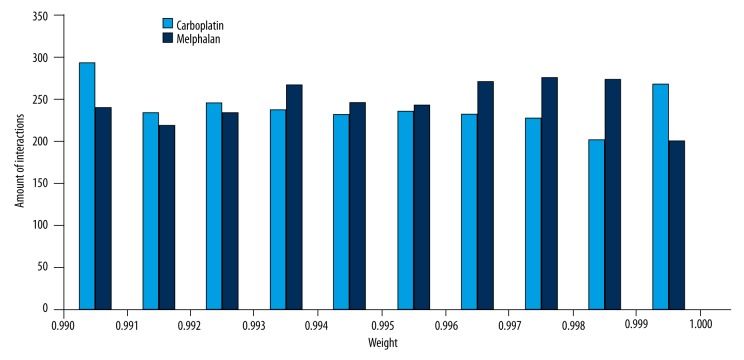
By taking intersection between PPIN and 12392 genes in the gene expression profile, we obtained 10 954 genes and 355 016 interactions. To remove indirect correlation and make the network more confidence, the interactions which met to the criterion δ≥0.990 in BCN were chosen to construct the DCN. There were 2147 nodes and 4822 interactions in 2 DCNs, but the weights of edges in them were different, as shown in Figure 2. We found that the weight distribution between CAR and MEL condition was different, especially for the section of weight >0.996.
Figure 2.
Weight distribution of DCNs in Carboplatin and Melphalan condition.
Identification of 2-DMs
A total of 21 seed genes were detected in DCNs, and their average z-scores are displayed in Table 1. The 5 top ranked seed genes were UBE2K (z-score=122.981), PMPCB (z-score=102.737), DLD (z-score=98.219), RARS (z-score=94.988), and ARL1 (z-score=93.541). Regarding the 21 seed genes as starts, we performed a module search based on the entropy decrease ΔH(C, C′) between C and C′, and gained candidate modules. After eliminating candidate modules with sizes <5, we merged the modules among which the Jaccard index was ≥0.5, and identified 20 2-modules.
Table 1.
Seed genes and their z-scores in DCNs.
| No. | Seed genes | Average z-score |
|---|---|---|
| 1 | UBE2K | 122.981 |
| 2 | PMPCB | 102.737 |
| 3 | DLD | 98.219 |
| 4 | RARS | 94.988 |
| 5 | ARL1 | 93.541 |
| 6 | UBA2 | 87.820 |
| 7 | TRIP12 | 86.272 |
| 8 | NAA50 | 78.967 |
| 9 | SMC3 | 74.420 |
| 10 | MED4 | 73.486 |
| 11 | NUP37 | 70.312 |
| 12 | DHX15 | 68.418 |
| 13 | ASUN | 67.100 |
| 14 | DDX18 | 65.763 |
| 15 | DDX1 | 64.094 |
| 16 | NUSAP1 | 61.953 |
| 17 | IPO5 | 61.883 |
| 18 | NDUFV2 | 61.822 |
| 19 | SNX4 | 61.277 |
| 20 | KIF11 | 60.718 |
| 21 | MTF2 | 59.927 |
Detection of 2-DMs
To evaluate the statistical significance of 2-modules in CAR and MEL conditions compared with base condition, we constructed a randomized network of 4822 edges captured from 355 016 interactions at random to search modules. This type of randomized network was constructed for 100 times, and a total of 3087 modules were obtained. The empirical P value of 2-modules was defined as the probability of the module having the observed score or smaller by chance, and then was adjusted by Benjamini-Hochberg test. Only modules with P<0.05 were regarded as 2-DMs, and we identified 18 2-DMs between CAR, MEL conditions and base condition.
Quantification of connectivity dynamics of shared 2-DMs
To quantify the dynamics of 2-DMs, the MCDS was devised, which not only quantified the presence and absence of edges but also changed in edge weights that could be viewed as the interaction strength among genes. The statistical significances of MCDS for 18 2-DMs were evaluated, and MCDS with P<0.05 were considered to be significant. We obtained 3 significantly different MCDS across CAR and MEL conditions, and 2-DMs with significant MCDS might play key roles in RB than other modules. Seed genes in the significant 2-DMs were more important than other seed genes to reveal molecular mechanism for the difference between CAR- and MEL-treated RB progression.
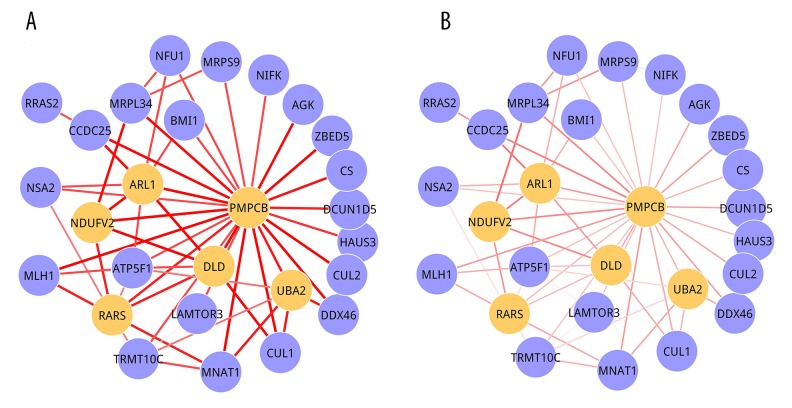
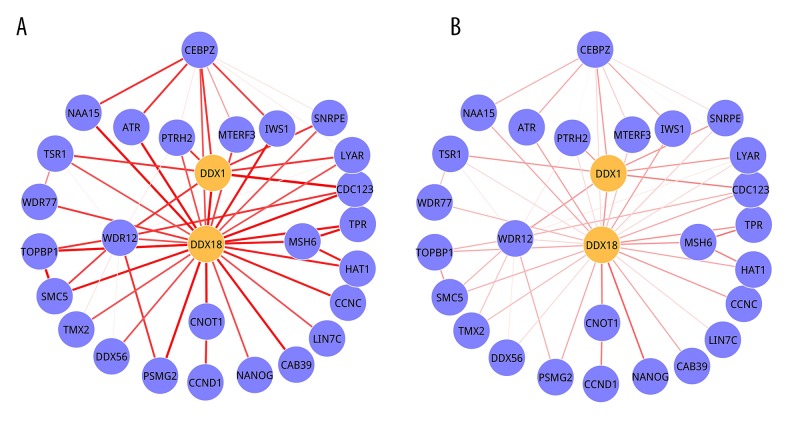
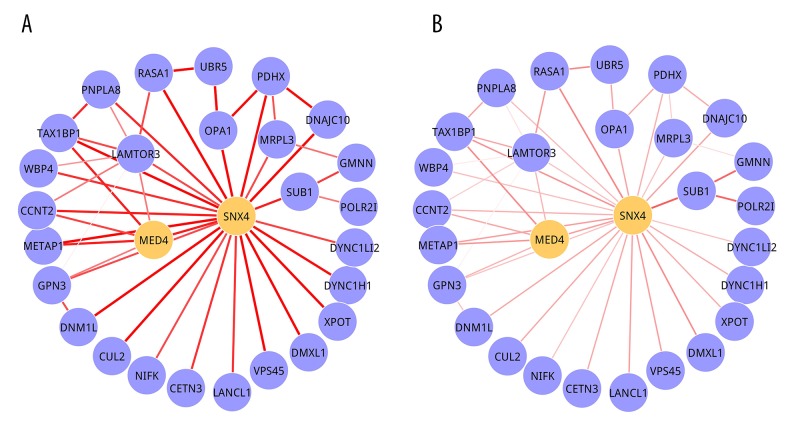
The 3 significant 2-DMs ae illustrated in Figure 3 (Module 1), Figure 4 (Module 2), and Figure 5 (Module 3). For Module 1, there were 27 nodes, of which 6 were seed genes (PMPCB, ARL1, NDUFV2, DLD, RARS, and UBA2), and 56 edges. PMPCB, the start seed gene of this module, had the highest degree, with 25, but its interactions in 2 conditions were different. The strengths were obviously decreased in MEL condition (Figure 3B) when compared with CAR condition (Figure 3A). Module 2 was composed of 28 nodes and 54 edges, and only 2 seed genes (DDX1 and DDX18) were involved in it. DDX18 was the start seed gene. A total of 28 nodes interacted with 45 edges presented in Module 3, and SNX4 and MED4 were its seed genes. The P value and seed genes for 3 modules are listed in Table 2.
Figure 3.
Module 1. (A) CAR condition; (B) MEL condition. Nodes were genes and edges stood for interactions among them. The orange nodes represented seed genes. The width of edges stood for the strength between 2 genes.
Figure 4.
Module 2. (A) CAR condition; (B) MEL condition. Nodes were genes and edges stood for interactions among them. The orange nodes represented seed genes. The width of edges stood for the strength between 2 genes.
Figure 5.
Module 3. (A) CAR condition; (B) MEL condition. Nodes were genes and edges stood for interactions among them. The orange nodes represented seed genes. The width of edges stood for the strength between 2 genes.
Table 2.
Properties of three significant 2-DMs.
| Module | Nodes | Edges | P value | Seed genes | Start seed gene |
|---|---|---|---|---|---|
| Module 1 | 27 | 56 | 5.48 E-03 | PMPCB, ARL1, UBA2, NDUFV2, DLD, RARS | PMPCB |
| Module 2 | 28 | 54 | 6.69E-03 | DDX1, DDX18 | DDX18 |
| Module 3 | 28 | 45 | 2.59E-02 | SNX4, MED4 | SNX4 |
Discussion
Previous studies on drug resistance in RB are mostly based on proteins playing a role in drug resistance reported in other cancers [26]. In the current work, we revealed dynamic module changes induced by CAR and MEL at the molecular level and predicated potential markers for drug resistance in RB, systematically utilizing multiple differential networks.
Networks characterize the complex interactions and the intricate interwoven relationships that govern cellular functions, among those tissues and disease-related genes to explain the molecular processes during disease development and progression [27]. Traditionally, if an interaction between a gene pair shows highly correlated strength in one condition, the interaction would be selected as an edge of the network [28]. However, if a gene in the interaction is differently expressed but the other is not, it may not be considered as significant interaction for the whole dataset. The challenge has been worked out to a great extent by constructing M DCNs.
Based on M DCNs, we identified M-DMs and investigated their dynamic changes. A key innovation of the method is the ability to identify unique and shared modules from multiple differential gene networks, each representing a different perturbation condition [25]. Moreover, sets of genes that are differentially expressed under RB states but do not exhibit correlated expression pattern will not be identified as a module [29]. Hence, the dynamic modules give more proof of the pathological mechanism of RB progression.
In the present study we identified 3 dynamic modules: Module 1, Module 2, and Module 3. Taking Module 1 as an example, PMPCB was the start seed gene and had the highest degree. PMPCB, peptidase (mitochondrial processing) β, is the main peptidase responsible for cleaving the mitochondrial import signal from hundreds of mitochondrial proteins 16, but it only functions as part of a heterodimeric complex [30]. Impaired or dysregulated function of mitochondrial proteases is associated with ageing and with many pathological conditions such as neurodegenerative disorders, metabolic syndromes, and cancer [31]. Expression and up-regulation of tumor-associated antigen (PMPCB) represents an interesting approach in cancer immunotherapy [32]. Therefore, this gene is closely related to cancers, which indicated that Module 1 was correlated to RB to some extent.
Conclusions
In conclusion, we have identified 3 dynamic modules with changes induced by CAR and MEL in RB, which might give insights into the molecular mechanism by which RB therapy acts.
Footnotes
Source of support: Departmental sources
Statement
This research received no specific grants from any funding agency in public, commercial, or not-for-profit sectors.
Conflict of interest
We state we have no conflicts of interest.
References
- 1.Villanueva MT. Tumorigenesis: Establishing the origin of retinoblastoma. Nat Rev Cancer. 2014;14:706–7. doi: 10.1038/nrc3849. [DOI] [PubMed] [Google Scholar]
- 2.Aerts I, Lumbroso-Le Rouic L, Gauthier-Villars M, et al. Retinoblastoma. Orphanet J Rare Dis. 2006;1:31. doi: 10.1186/1750-1172-1-31. [DOI] [PMC free article] [PubMed] [Google Scholar]
- 3.Pellicanò M, Larbi A, Goldeck D, et al. Immune profiling of Alzheimer patients. J Neuroimmunol. 2012;242:52–59. doi: 10.1016/j.jneuroim.2011.11.005. [DOI] [PubMed] [Google Scholar]
- 4.Dhar SU, Chintagumpala M, Noll C. Outcomes of integrating genetics in management of patients with retinoblastoma. Arch Ophthalmol. 2011;129:1428–34. doi: 10.1001/archophthalmol.2011.292. [DOI] [PubMed] [Google Scholar]
- 5.Nalini V, Segu R, Deepa PR. Molecular insights on post-chemotherapy retinoblastoma by microarray gene expression analysis. Bioinform Biol Insights. 2013;7:289–306. doi: 10.4137/BBI.S12494. [DOI] [PMC free article] [PubMed] [Google Scholar]
- 6.Chan HS, Gallie BL, Munier FL, Beck Popovic M. Chemotherapy for retinoblastoma. Ophthalmol Clin North Am. 2005;18:55–63. doi: 10.1016/j.ohc.2004.11.002. [DOI] [PubMed] [Google Scholar]
- 7.Shields CL, Shelil A, Cater J. Development of new retinoblastomas after 6 cycles of chemoreduction for retinoblastoma in 162 eyes of 106 consecutive patients. Arch Ophthalmol. 2003;121:1571–76. doi: 10.1001/archopht.121.11.1571. [DOI] [PubMed] [Google Scholar]
- 8.Goldie JH. Drug resistance in cancer: a perspective. Cancer Metastasis Rev. 2001;20:63–68. doi: 10.1023/a:1013164609041. [DOI] [PubMed] [Google Scholar]
- 9.Wilson MW, Fraga CH, Rodriguez-Galindo C. Expression of the multi-drug resistance proteins and the pregnane X receptor in treated and untreated retinoblastoma. Curr Eye Res. 2009;34:386–94. doi: 10.1080/02713680902859621. [DOI] [PubMed] [Google Scholar]
- 10.Reck M, Bondarenko I, Luft A, et al. Ipilimumab in combination with paclitaxel and carboplatin as first-line therapy in extensive-disease-small-cell lung cancer: Results from a randomized, double-blind, multicenter phase 2 trial. Ann Onco. 2013;24:75–83. doi: 10.1093/annonc/mds213. [DOI] [PubMed] [Google Scholar]
- 11.González-Martín AJ, Calvo E, Bover I, Rubio MJ, et al. Randomized phase II trial of carboplatin versus paclitaxel and carboplatin in platinum-sensitive recurrent advanced ovarian carcinoma: a GEICO (Grupo Español de Investigación en Cáncer de Ovario) study. Ann Oncol. 2014;16:749–55. doi: 10.1093/annonc/mdi147. [DOI] [PubMed] [Google Scholar]
- 12.Galluzzi L, Senovilla L, Vitale I, et al. Molecular mechanisms of cisplatin resistance. Oncogene. 2012;31:1869–83. doi: 10.1038/onc.2011.384. [DOI] [PubMed] [Google Scholar]
- 13.Pignata S, Scambia G, Katsaros D, et al. Carboplatin plus paclitaxel once a week versus every 3 weeks in patients with advanced ovarian cancer (MITO-7): A randomised, multicentre, open-label, phase 3 trial. Lancet Oncol. 2014;15:396–405. doi: 10.1016/S1470-2045(14)70049-X. [DOI] [PubMed] [Google Scholar]
- 14.Usmani SZ. Melphalan continues to rock the myeloma world. Biol Blood Marrow Transplant. 2013;19(5):680–81. doi: 10.1016/j.bbmt.2013.02.014. [DOI] [PubMed] [Google Scholar]
- 15.Xiang Y, Wood ER, Gancar J, et al. Proteomic investigation of melphalan resistance in multiple myeloma to support selection of combination therapy. Cancer Res. 2011;71:5112. [Google Scholar]
- 16.Szklarczyk D, Franceschini A, Wyder S, et al. STRING v10: protein-protein interaction networks, integrated over the tree of life. Nucleic Acids Res. 2015;43(Database issue):D447–52. doi: 10.1093/nar/gku1003. [DOI] [PMC free article] [PubMed] [Google Scholar]
- 17.Nahler . Dictionary of Pharmaceutical Medicine. 2009. Pearson correlation coefficient; p. 132. [Google Scholar]
- 18.Cohen J, Cohen P, West SG, Aiken LS. Applied multiple regression/correlation analysis for the behavioral sciences. Routledge; 2013. [Google Scholar]
- 19.Ma X, Gao L, Tan K. Modeling disease progression using dynamics of pathway connectivity. Bioinformatics. 2014;30:2343–50. doi: 10.1093/bioinformatics/btu298. [DOI] [PMC free article] [PubMed] [Google Scholar]
- 20.Vanunu O, Magger O, Ruppin E, et al. Associating genes and protein complexes with disease via network propagation. PLoS Comput Biol. 2010;6(1):e1000641. doi: 10.1371/journal.pcbi.1000641. [DOI] [PMC free article] [PubMed] [Google Scholar]
- 21.Zhou D, Bousquet O, Lal N, Weston J, Schölkopf B. Learning with local and global consistency. Adv Neural Inf Proc Syst. 2004;16:321–28. [Google Scholar]
- 22.Fortunato S, Barthélemy M. Resolution limit in community detection. Proc Natl Acad Sci USA. 2007;104(1):36–41. doi: 10.1073/pnas.0605965104. [DOI] [PMC free article] [PubMed] [Google Scholar]
- 23.Bouchard M, Jousselme A-L, Doré P-E. A proof for the positive definiteness of the Jaccard index matrix. International Journal of Approximate Reasoning. 2013;54:615–26. [Google Scholar]
- 24.Benjamini, Hochberg Controlling the false discovery rate: a practical and powerful approach to multiple testing. Journal of the Royal Statistical Society Series B (Methodological) 1995;57(1):289–300. [Google Scholar]
- 25.Ma X, Gao L, Karamanlidis G, et al. Revealing pathway dynamics in heart diseases by analyzing multiple differential networks. PLoS Comput Biol. 2015;11:e1004332. doi: 10.1371/journal.pcbi.1004332. [DOI] [PMC free article] [PubMed] [Google Scholar]
- 26.Nalini V, Segu R, Deepa PR. Molecular insights on post-chemotherapy retinoblastoma by microarray gene expression analysis. Bioinform Biolo Insights. 2013;7:289–306. doi: 10.4137/BBI.S12494. [DOI] [PMC free article] [PubMed] [Google Scholar]
- 27.Sun SY, Liu ZP, Zeng T. Spatio-temporal analysis of type 2 diabetes mellitus based on differential expression networks. Sci Rep. 2013;3:2268. doi: 10.1038/srep02268. [DOI] [PMC free article] [PubMed] [Google Scholar]
- 28.Chen, Wang, Zhang . Transcription Regulation: Networks and Models, in Biomolecular Networks. John Wiley & Sons, Inc; 2009. pp. 23–45. [Google Scholar]
- 29.Segal E, Shapira M, Regev A, et al. Module networks: Identifying regulatory modules and their condition-specific regulators from gene expression data. Nat Genet. 2003;34:166–76. doi: 10.1038/ng1165. [DOI] [PubMed] [Google Scholar]
- 30.Teixeira PE, Glaser E. Processing peptidases in mitochondria and chloroplasts. Biochim Biophys Acta. 2013;1833(2):360–70. doi: 10.1016/j.bbamcr.2012.03.012. [DOI] [PubMed] [Google Scholar]
- 31.Quirós PM, Langer T, López-Otín C. New roles for mitochondrial proteases in health, ageing and disease. Nat Rev Mol Cell Biol. 2015;16(6):345–59. doi: 10.1038/nrm3984. [DOI] [PubMed] [Google Scholar]
- 32.Luczynski W, Kowalczuk O, Stasiak-Barmuta A. Acute lymphoblastic leukemia-derived dendritic cells express tumor associated antigens: PNPT1, PMPCB, RHAMM, BSG and ERCC1. Neoplasma. 2008;56:428–34. doi: 10.4149/neo_2009_05_428. [DOI] [PubMed] [Google Scholar]


